| Param | Original file | Final file |
|---|---|---|
| Filename | modeM0/AS1G05_218T05_9000000602_04777cztM0_level2.evt | modeM0/AS1G05_218T05_9000000602_04777cztM0_level2_quad_clean.evt |
| Size (bytes) | 560,577,600 | 76,602,240 |
| Size | 534.6 MB | 73.1 MB |
| Events in quadrant A | 2,954,899 | 490,340 |
| Events in quadrant B | 3,101,571 | 490,252 |
| Events in quadrant C | 4,907,432 | 447,190 |
| Events in quadrant D | 5,584,495 | 449,730 |
| Mode M9 | |||
|---|---|---|---|
| Quadrant | BADHDUFLAG | Total packets | Discarded packets |
| A | 0 | 18 | 0 |
| B | 0 | 18 | 0 |
| C | 0 | 18 | 0 |
| D | 0 | 19 | 0 |
| Mode SS | |||
|---|---|---|---|
| Quadrant | BADHDUFLAG | Total packets | Discarded packets |
| A | 0 | 128 | 0 |
| B | 0 | 128 | 0 |
| C | 0 | 128 | 0 |
| D | 0 | 128 | 0 |
| Mode M0 | |||
|---|---|---|---|
| Quadrant | BADHDUFLAG | Total packets | Discarded packets |
| A | 0 | 13146 | 3 |
| B | 0 | 13510 | 2 |
| C | 0 | 18887 | 2 |
| D | 0 | 20948 | 2 |
| Quadrant | Total seconds | Saturated seconds | Saturation percentage |
|---|---|---|---|
| A | 6330 | 15 | 0.236967% |
| B | 6330 | 26 | 0.410742% |
| C | 6330 | 712 | 11.248025% |
| D | 6330 | 247 | 3.902054% |
Noise dominated data is calculated using 1-second bins in cleaned event files. If a bin has >2000 counts, and if more than 50% of those come from <1% of pixels, then it is considered to be noise-dominated and hence unusable.
| Quadrant | # 1 sec bins | Bins with >0 counts | Bins with >2000 counts | High rate bins dominated by noise | Noise dominated (total time) | Noise dominated (detector-on time) | Marked lightcurve |
|---|---|---|---|---|---|---|---|
| A | 7660 | 6331 | 5 | 5 | 0.07% | 0.08% | 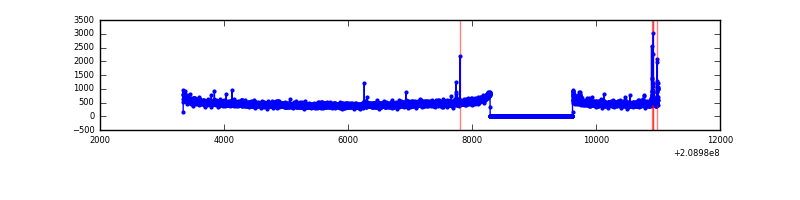 |
| B | 7660 | 6331 | 4 | 4 | 0.05% | 0.06% | 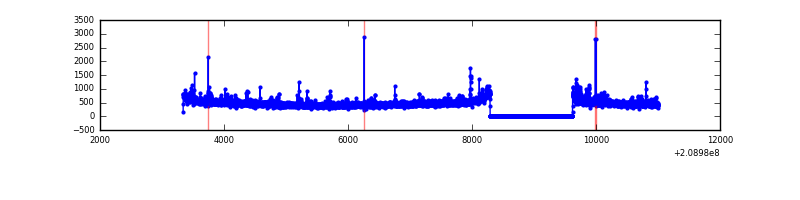 |
| C | 7660 | 6331 | 574 | 574 | 7.49% | 9.07% | 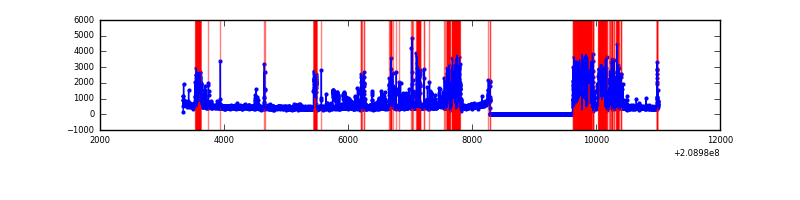 |
| D | 7660 | 6331 | 164 | 164 | 2.14% | 2.59% | 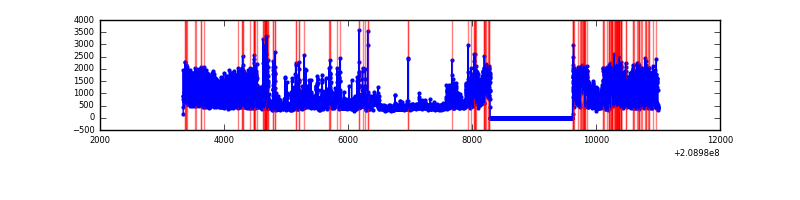 |
Top three noisy pixels from each quadrant. If the there are fewer than three noisy pixels in the level2.evt file, extra rows are filled as -1
| Pixel properties | Quadrant properties | ||||||
|---|---|---|---|---|---|---|---|
| Quadrant | DetID | PixID | Counts | Sigma | Mean | Median | Sigma |
| A | 8 | 15 | 62222 | 414.57 | 737 | 722 | 148.3 |
| A | 0 | 50 | 33921 | 223.79 | 737 | 722 | 148.3 |
| A | 0 | 226 | 7790 | 47.64 | 737 | 722 | 148.3 |
| B | 4 | 80 | 139284 | 974.71 | 750 | 734 | 142.1 |
| B | 14 | 167 | 23200 | 158.05 | 750 | 734 | 142.1 |
| B | 15 | 204 | 14490 | 96.77 | 750 | 734 | 142.1 |
| C | 14 | 48 | 2168512 | 13493.1 | 689 | 693 | 160.7 |
| C | 1 | 16 | 34954 | 213.25 | 689 | 693 | 160.7 |
| C | 9 | 237 | 9789 | 56.62 | 689 | 693 | 160.7 |
| D | 11 | 132 | 2240779 | 13070.43 | 712 | 692 | 171.4 |
| D | 13 | 235 | 193756 | 1126.49 | 712 | 692 | 171.4 |
| D | 2 | 234 | 154070 | 894.93 | 712 | 692 | 171.4 |
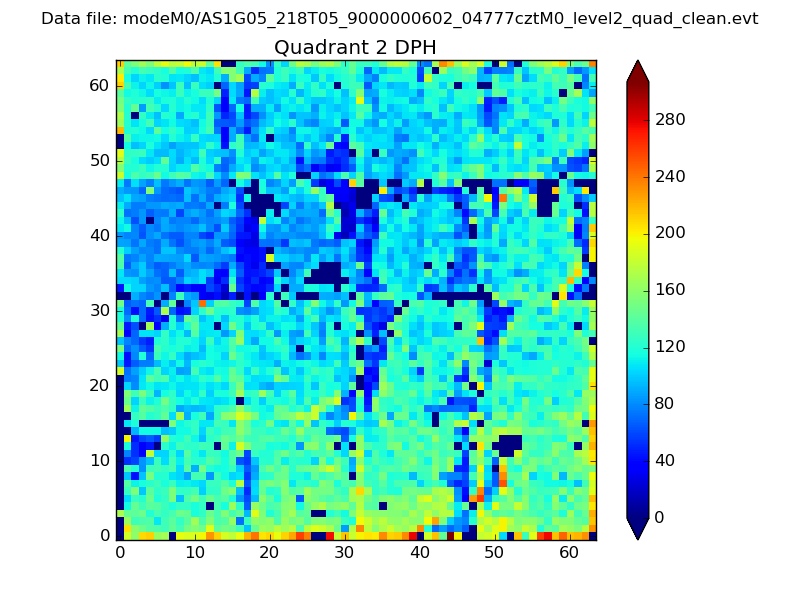
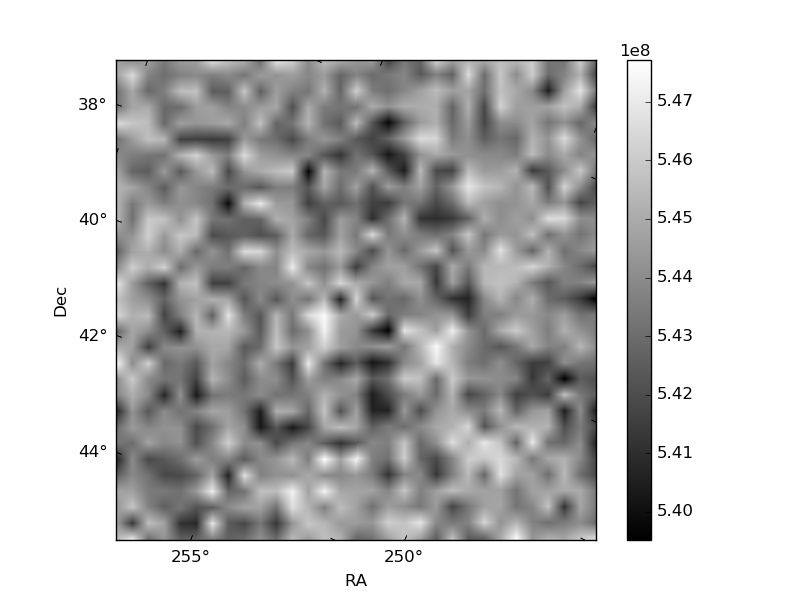
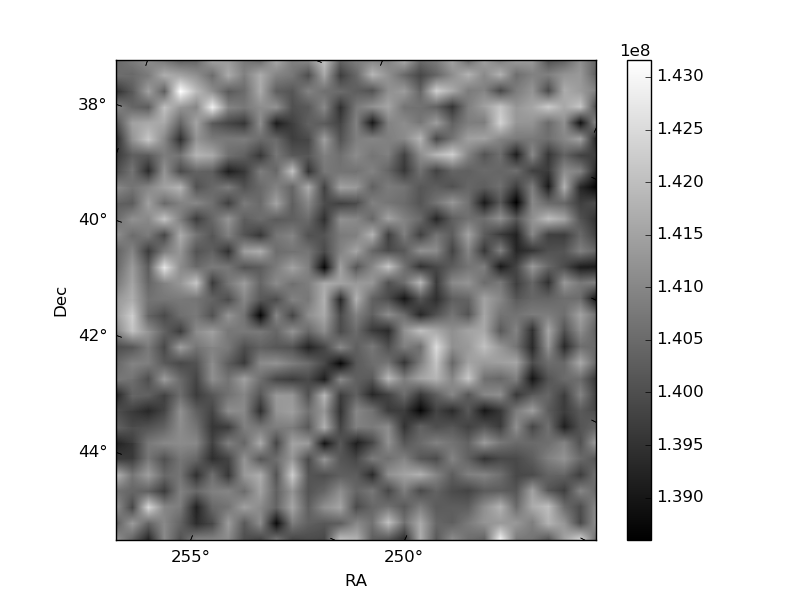
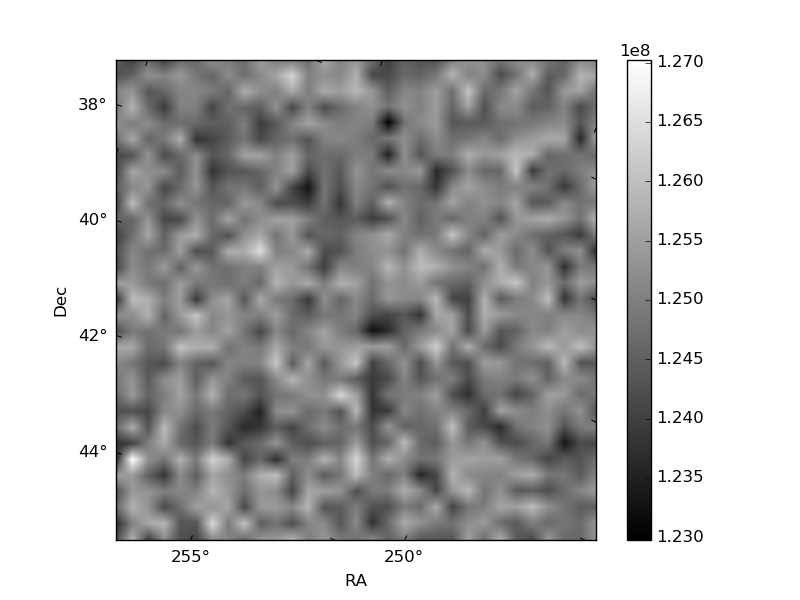
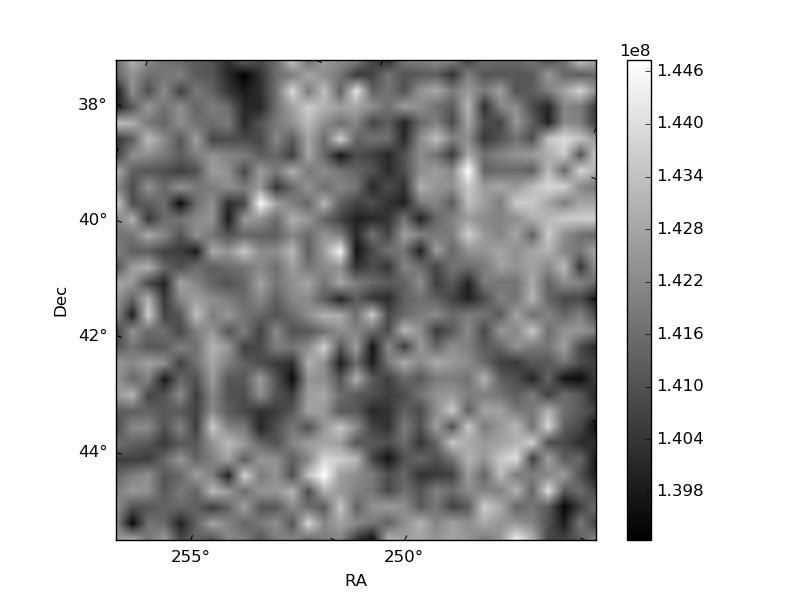
Histogram calculated using DETX and DETY for each event in the final _common_clean file
| Quadrant A | 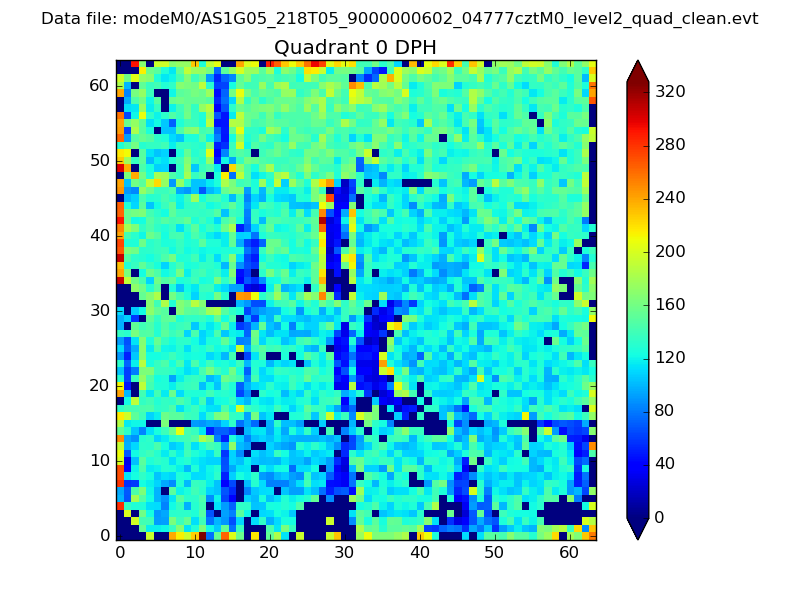 |
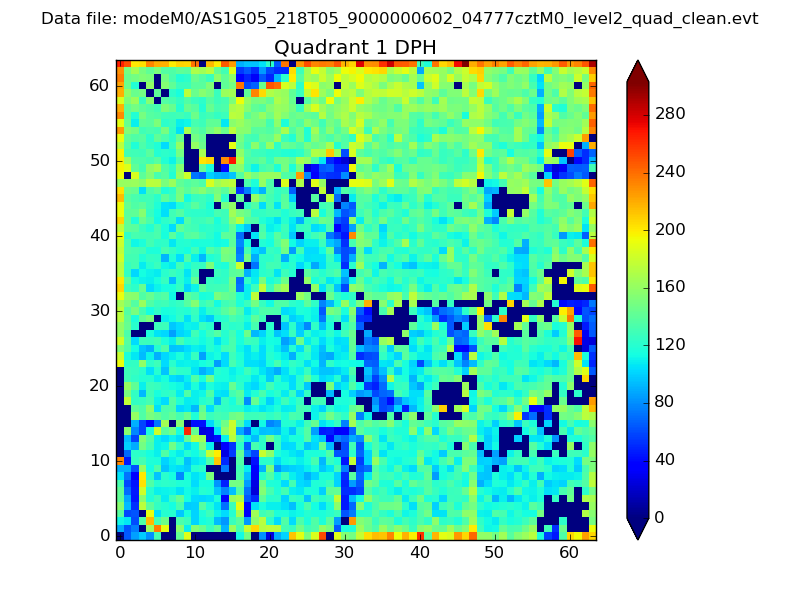 |
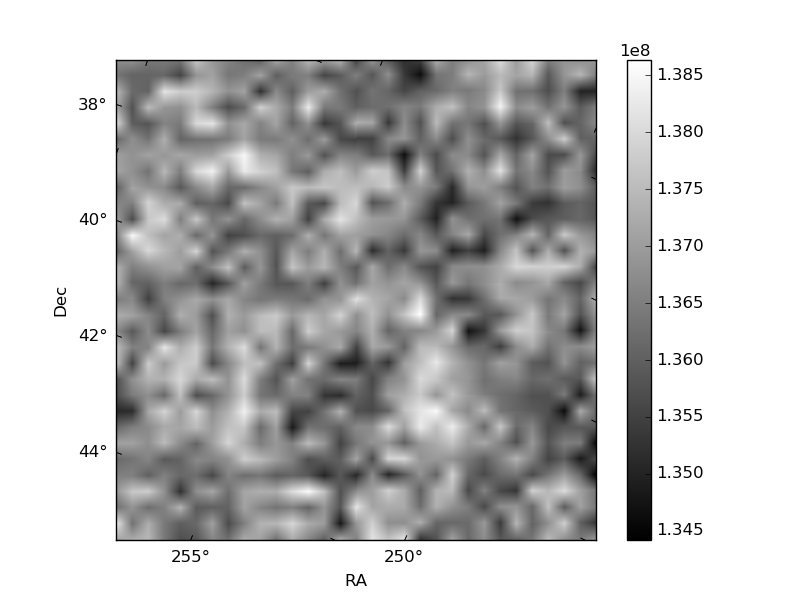
Quadrant B |
|---|---|---|---|
| Quadrant D | 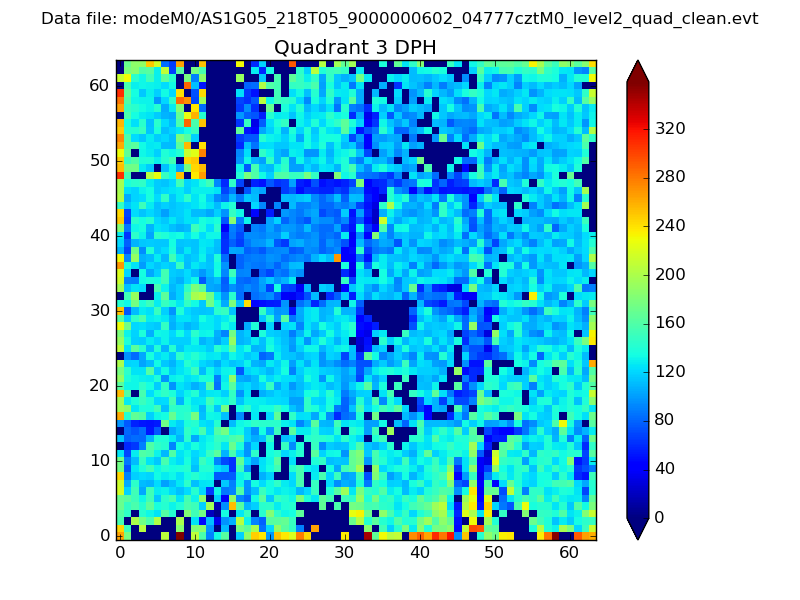 |
 |
Quadrant C |
| Plot type | Count rate plots | Images |
|---|---|---|
| Comparison with Poisson distribution Blue bars denote a histogram of data divided into 1 sec bins. Red curve is a Poisson curve with rate = median count rate of data. |
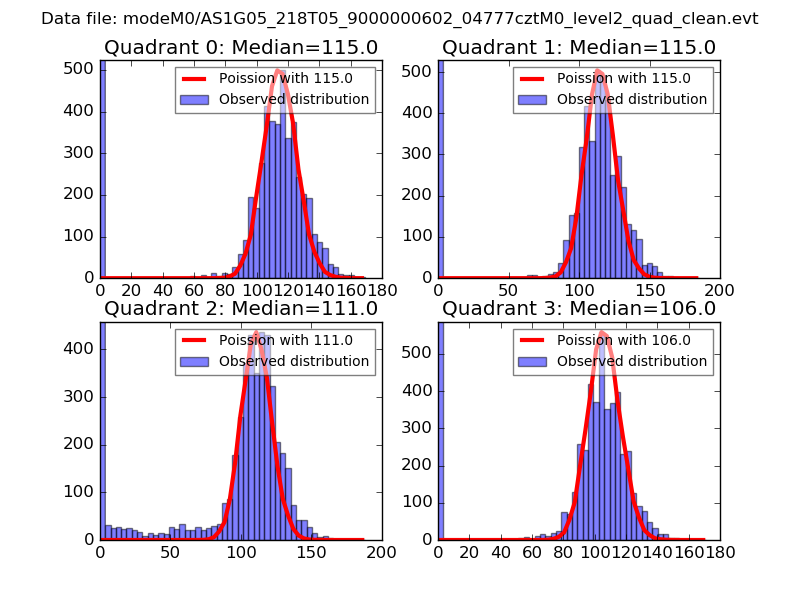 |
 |
| Quadrant-wise count rates Data is divided into 100 sec bins |
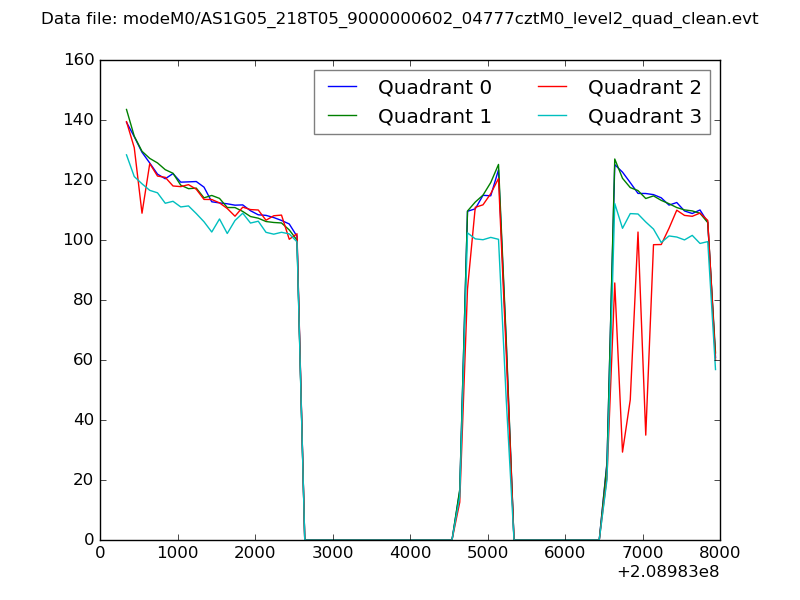 |
|
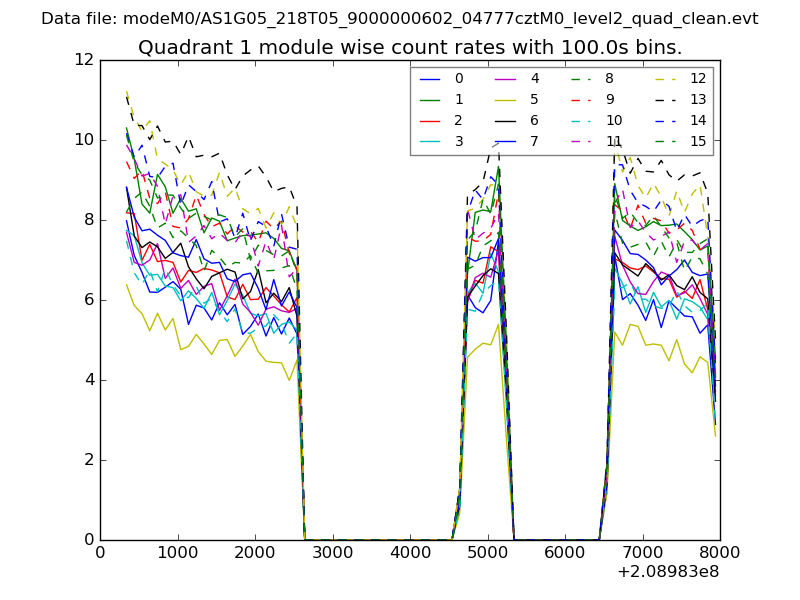
| Module-wise count rates for Quadrant A Data is divided into 100 sec bins |
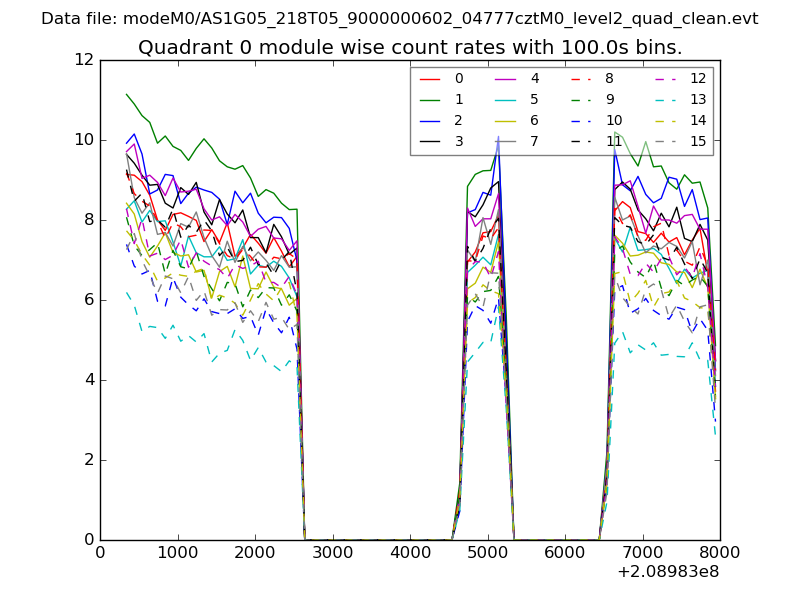 |
 |
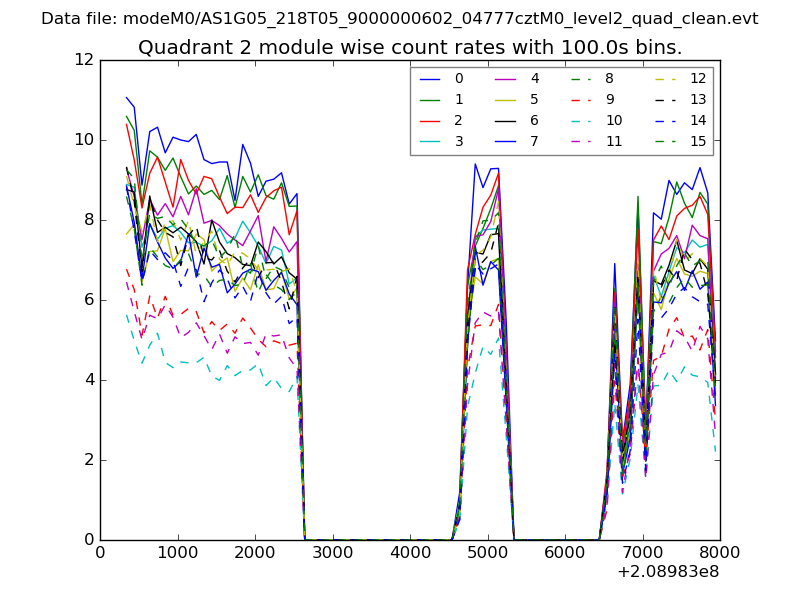
| Module-wise count rates for Quadrant B Data is divided into 100 sec bins |
 |
 |
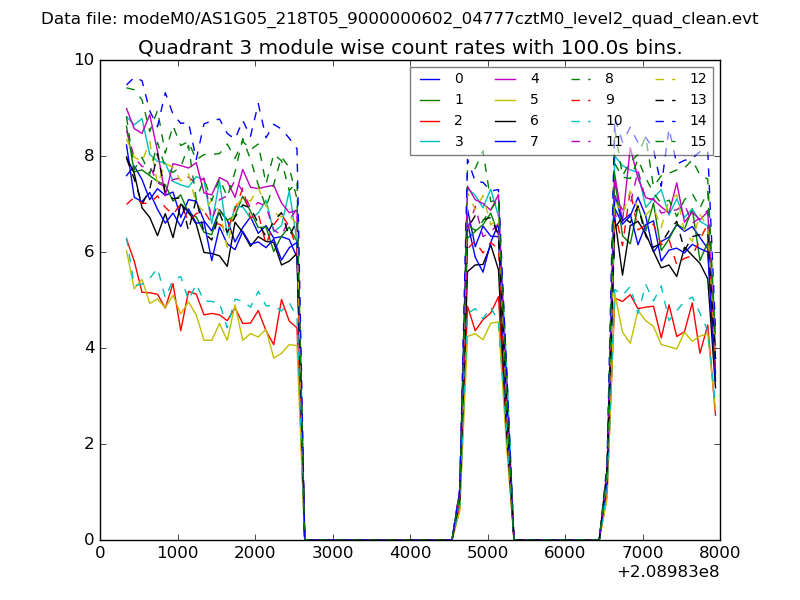
| Module-wise count rates for Quadrant C Data is divided into 100 sec bins |
 |
 |
| Module-wise count rates for Quadrant D Data is divided into 100 sec bins |
 |
 |
| Parameter | Plot |
|---|---|
| CZT HV Monitor | 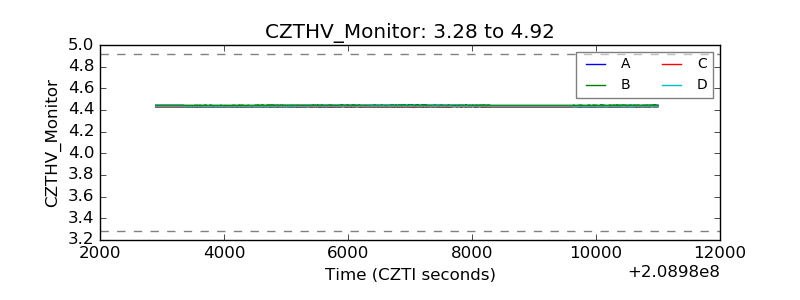 |
| D_VDD | 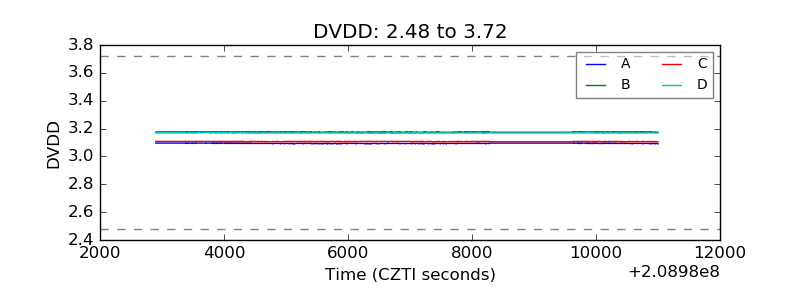 |
| Temperature 1 | 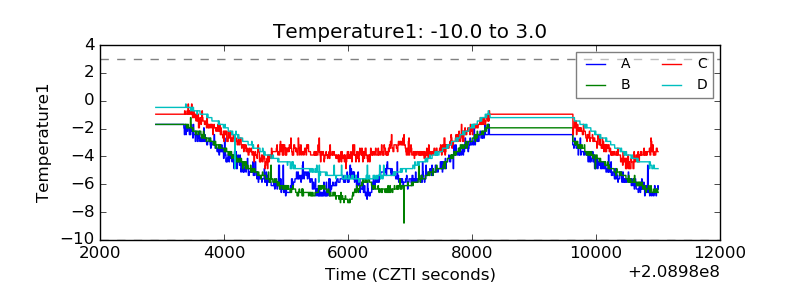 |
| Veto HV Monitor | 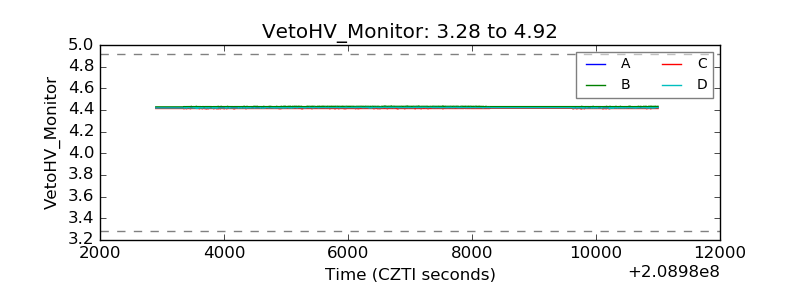 |
| Veto LLD | 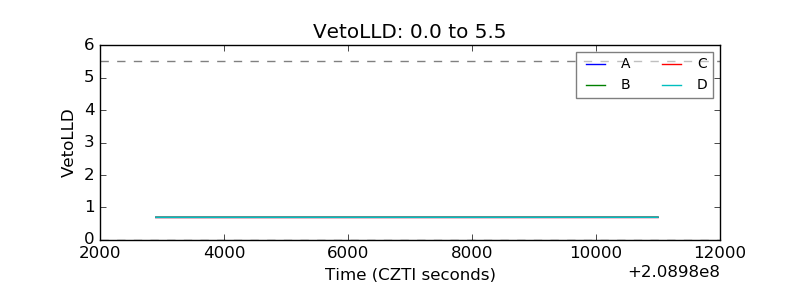 |
| Alpha Counter | 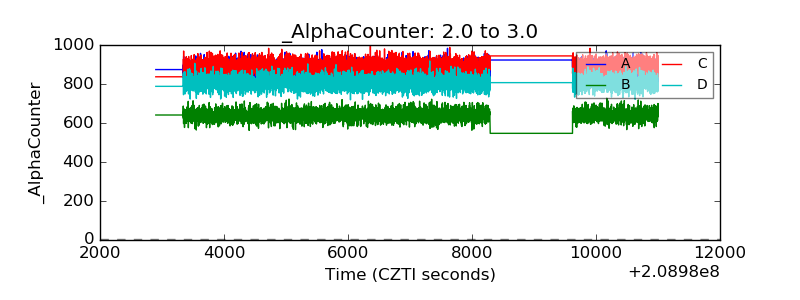 |
| _CPM_Rate | 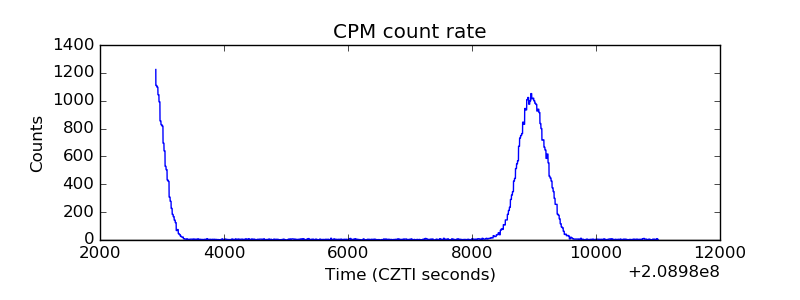 |
| CZT Counter | 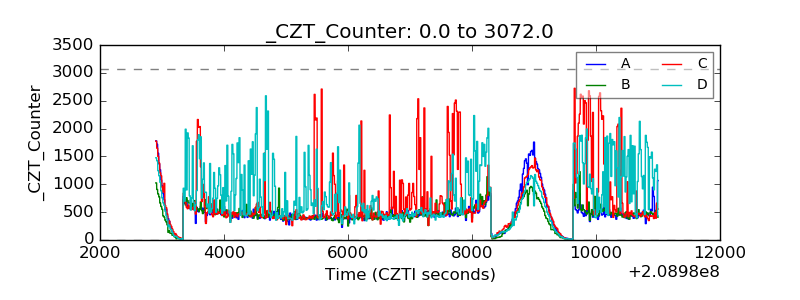 |
| +2.5 Volts monitor | 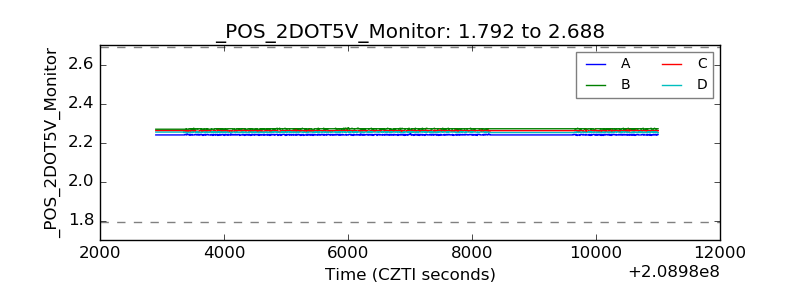 |
| +5 Volts monitor | 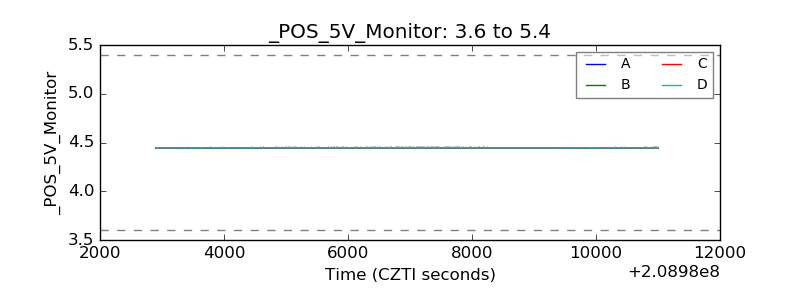 |
| _ROLL_ROT | 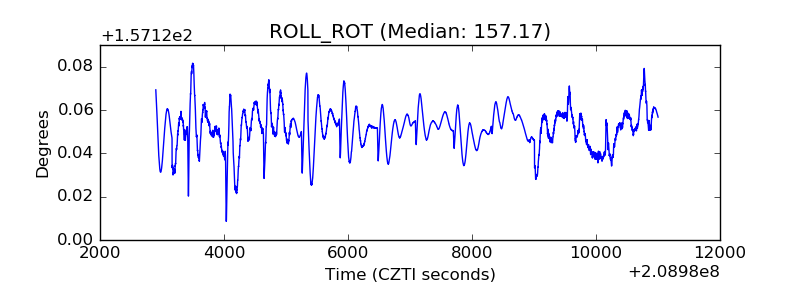 |
| _Roll_DEC | 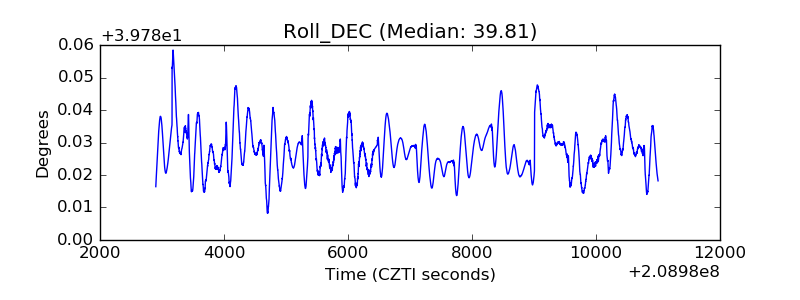 |
| _Roll_RA | 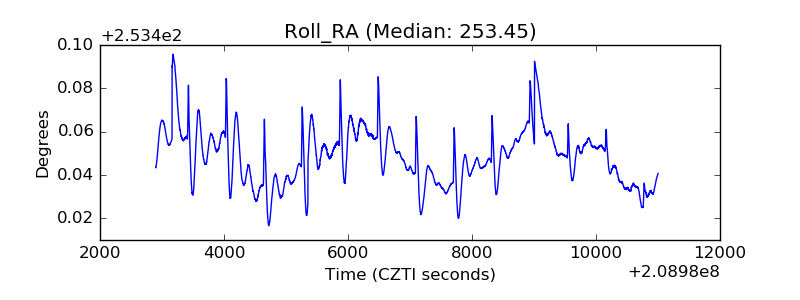 |
| Veto Counter | 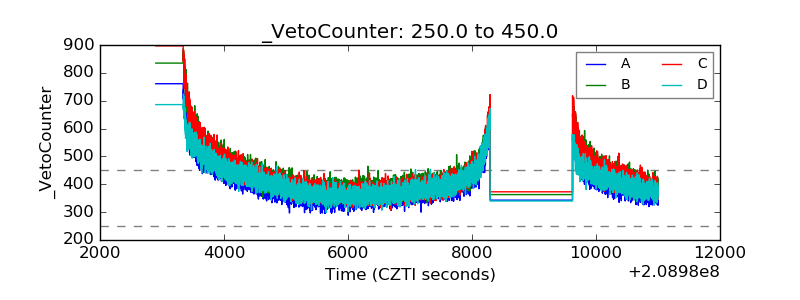 |