| Param | Original file | Final file |
|---|---|---|
| Filename | modeM0/AS1G05_218T05_9000000602_04778cztM0_level2.evt | modeM0/AS1G05_218T05_9000000602_04778cztM0_level2_quad_clean.evt |
| Size (bytes) | 690,462,720 | 73,454,400 |
| Size | 658.5 MB | 70.1 MB |
| Events in quadrant A | 3,383,877 | 476,545 |
| Events in quadrant B | 3,130,234 | 480,721 |
| Events in quadrant C | 8,447,031 | 371,384 |
| Events in quadrant D | 5,512,525 | 443,884 |
| Mode M9 | |||
|---|---|---|---|
| Quadrant | BADHDUFLAG | Total packets | Discarded packets |
| A | 0 | 17 | 0 |
| B | 0 | 17 | 0 |
| C | 0 | 17 | 0 |
| D | 0 | 18 | 0 |
| Mode SS | |||
|---|---|---|---|
| Quadrant | BADHDUFLAG | Total packets | Discarded packets |
| A | 0 | 130 | 0 |
| B | 0 | 130 | 0 |
| C | 0 | 130 | 0 |
| D | 0 | 130 | 0 |
| Mode M0 | |||
|---|---|---|---|
| Quadrant | BADHDUFLAG | Total packets | Discarded packets |
| A | 0 | 14425 | 3 |
| B | 0 | 13740 | 2 |
| C | 0 | 29596 | 2 |
| D | 0 | 21019 | 2 |
| Quadrant | Total seconds | Saturated seconds | Saturation percentage |
|---|---|---|---|
| A | 6465 | 101 | 1.562258% |
| B | 6465 | 13 | 0.201083% |
| C | 6465 | 2305 | 35.653519% |
| D | 6465 | 200 | 3.093581% |
Noise dominated data is calculated using 1-second bins in cleaned event files. If a bin has >2000 counts, and if more than 50% of those come from <1% of pixels, then it is considered to be noise-dominated and hence unusable.
| Quadrant | # 1 sec bins | Bins with >0 counts | Bins with >2000 counts | High rate bins dominated by noise | Noise dominated (total time) | Noise dominated (detector-on time) | Marked lightcurve |
|---|---|---|---|---|---|---|---|
| A | 7635 | 6466 | 71 | 71 | 0.93% | 1.10% | 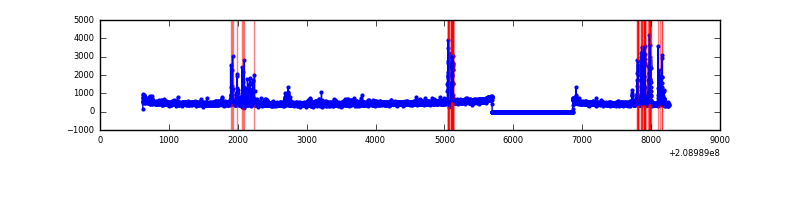 |
| B | 7635 | 6466 | 2 | 2 | 0.03% | 0.03% | 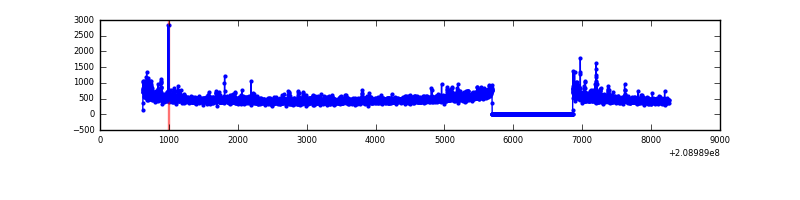 |
| C | 7635 | 6466 | 1881 | 1881 | 24.64% | 29.09% | 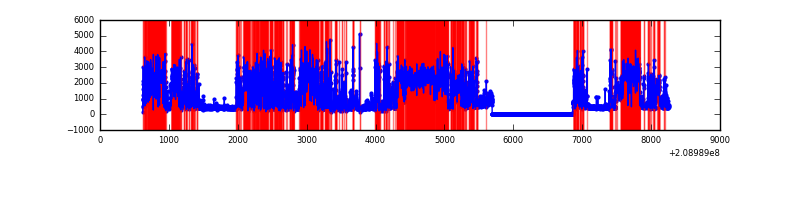 |
| D | 7635 | 6466 | 245 | 245 | 3.21% | 3.79% | 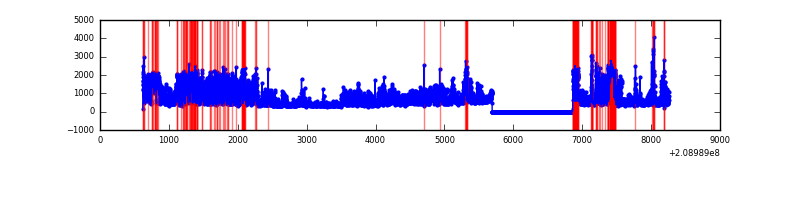 |
Top three noisy pixels from each quadrant. If the there are fewer than three noisy pixels in the level2.evt file, extra rows are filled as -1
| Pixel properties | Quadrant properties | ||||||
|---|---|---|---|---|---|---|---|
| Quadrant | DetID | PixID | Counts | Sigma | Mean | Median | Sigma |
| A | 0 | 50 | 378055 | 2548.22 | 728 | 712 | 148.1 |
| A | 8 | 15 | 181920 | 1223.71 | 728 | 712 | 148.1 |
| A | 14 | 111 | 16474 | 106.44 | 728 | 712 | 148.1 |
| B | 4 | 80 | 134974 | 945.81 | 747 | 729 | 141.9 |
| B | 14 | 167 | 41559 | 287.66 | 747 | 729 | 141.9 |
| B | 15 | 54 | 21576 | 146.87 | 747 | 729 | 141.9 |
| C | 14 | 48 | 6089453 | 43831.58 | 596 | 597 | 138.9 |
| C | 1 | 16 | 16932 | 117.59 | 596 | 597 | 138.9 |
| C | 9 | 237 | 8915 | 59.88 | 596 | 597 | 138.9 |
| D | 11 | 132 | 2187176 | 12942.22 | 706 | 687 | 168.9 |
| D | 2 | 136 | 206213 | 1216.55 | 706 | 687 | 168.9 |
| D | 13 | 235 | 157132 | 926.03 | 706 | 687 | 168.9 |
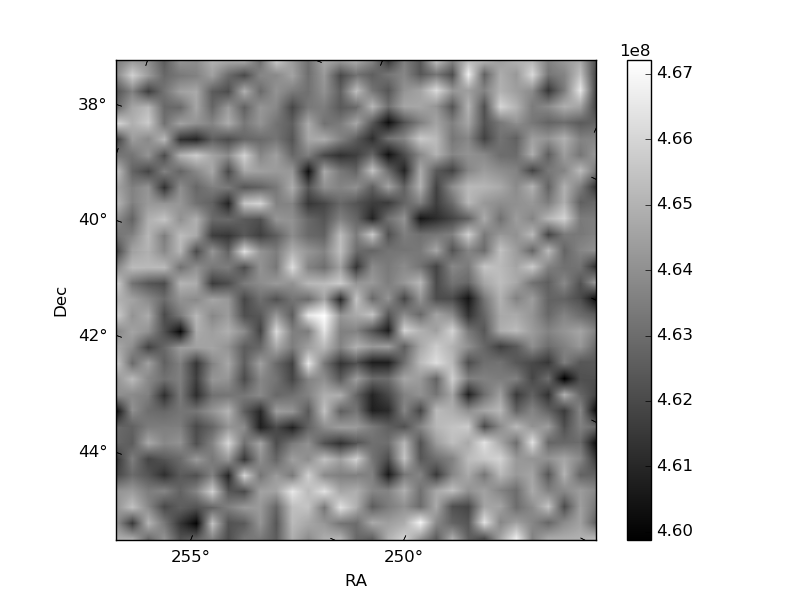
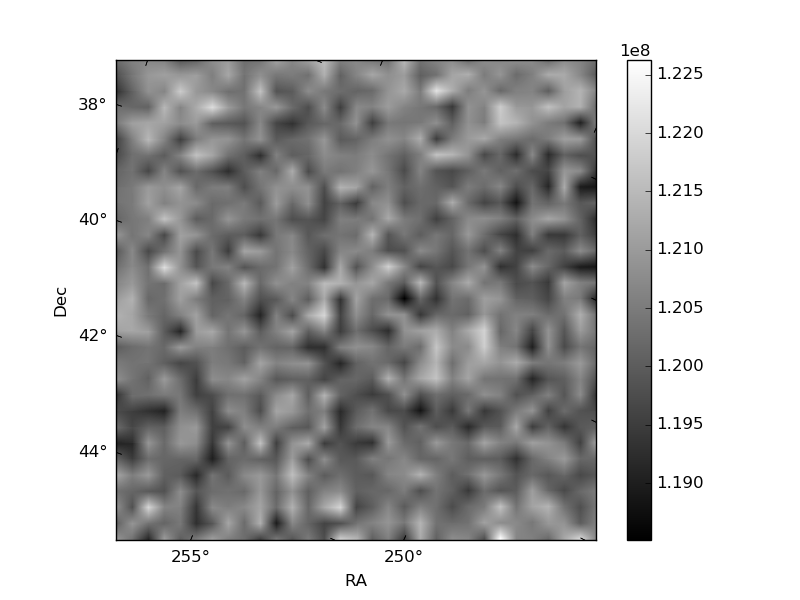
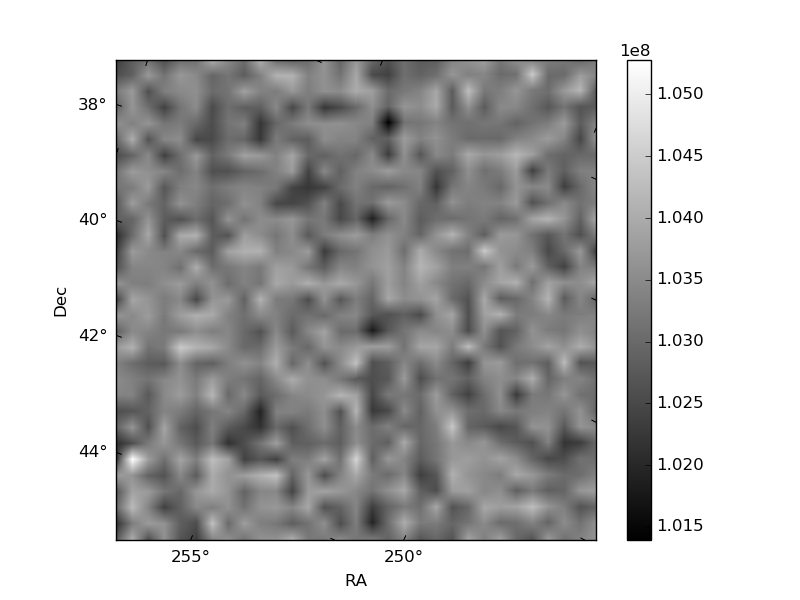
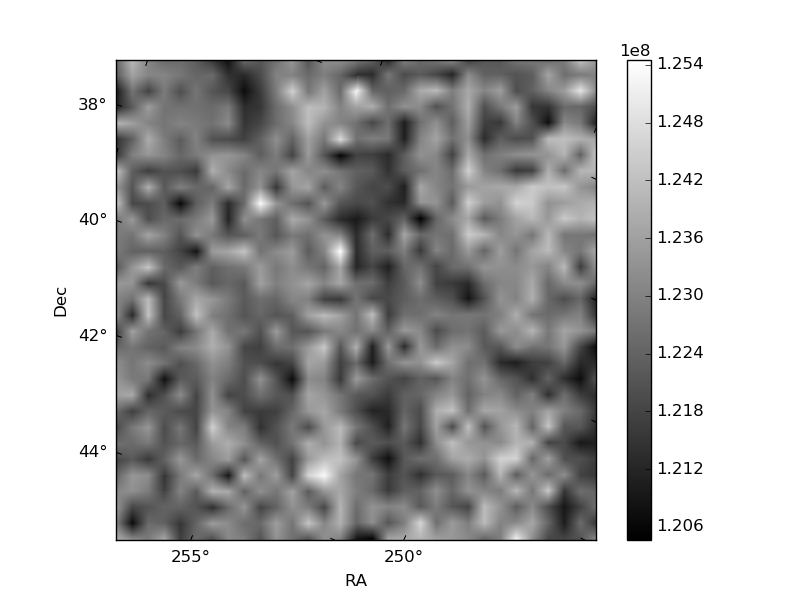
Histogram calculated using DETX and DETY for each event in the final _common_clean file
| Quadrant A | 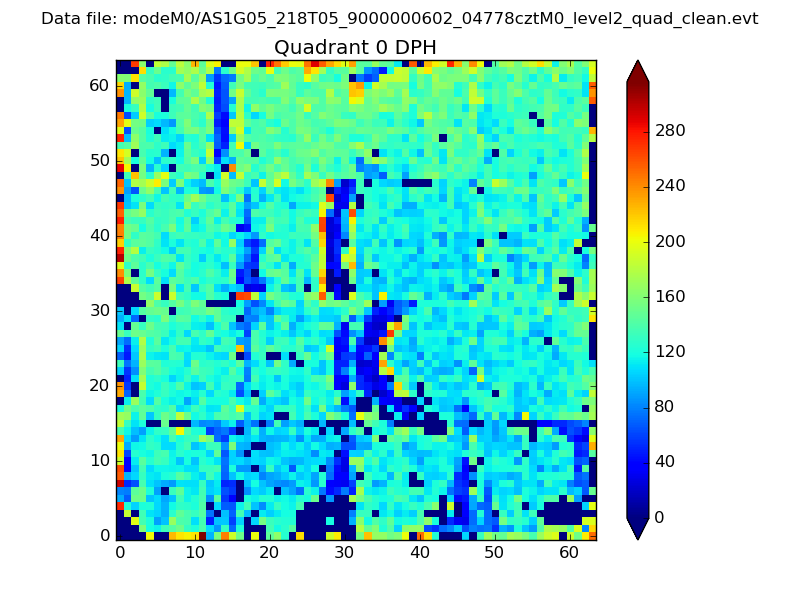 |
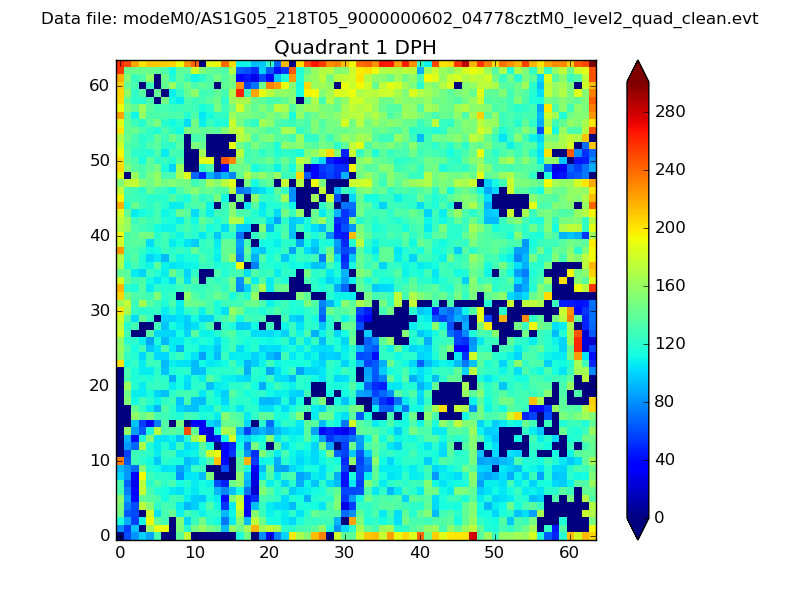 |
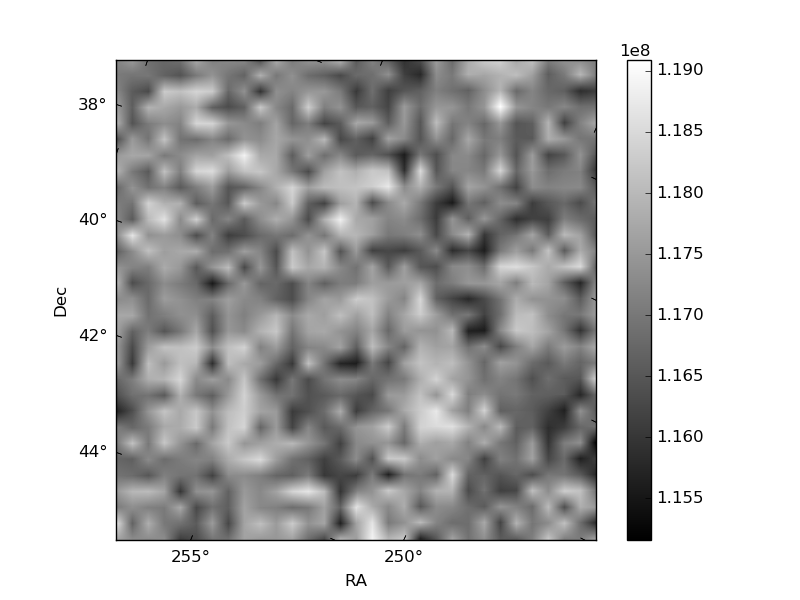
Quadrant B |
|---|---|---|---|
| Quadrant D | 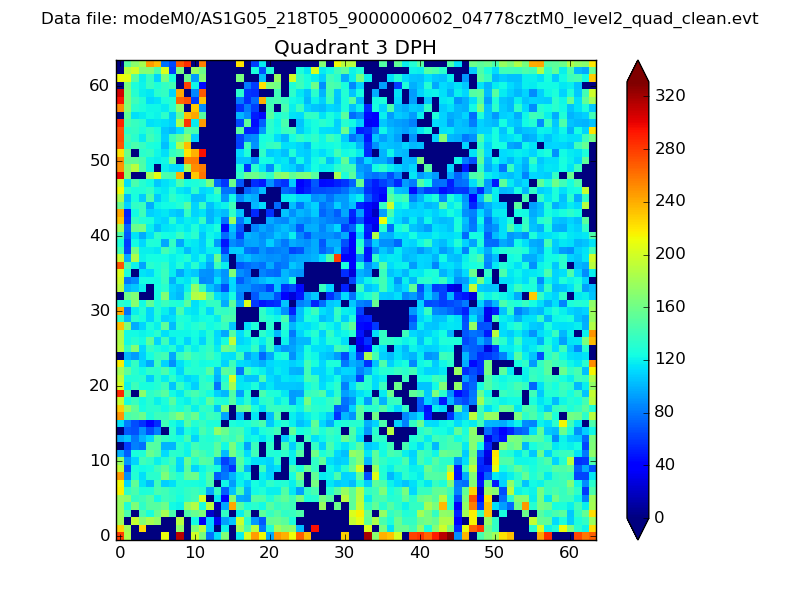 |
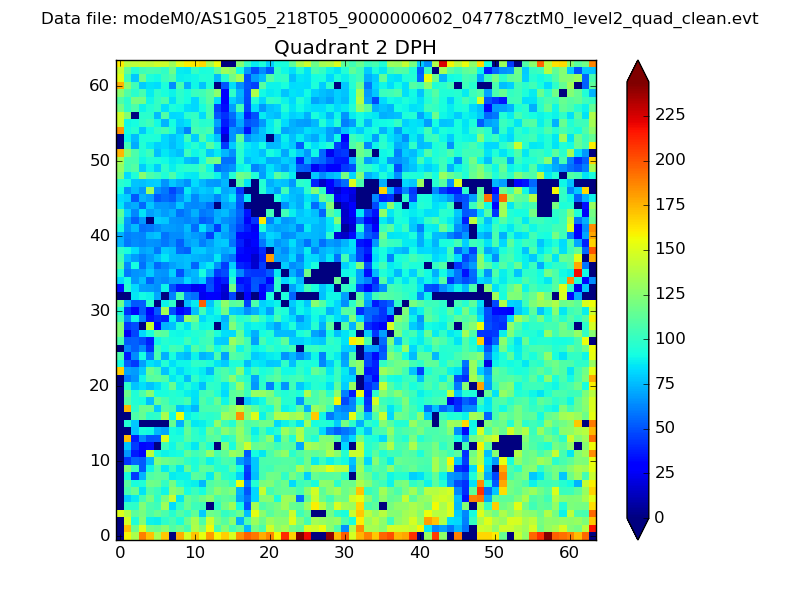 |
Quadrant C |
| Plot type | Count rate plots | Images |
|---|---|---|
| Comparison with Poisson distribution Blue bars denote a histogram of data divided into 1 sec bins. Red curve is a Poisson curve with rate = median count rate of data. |
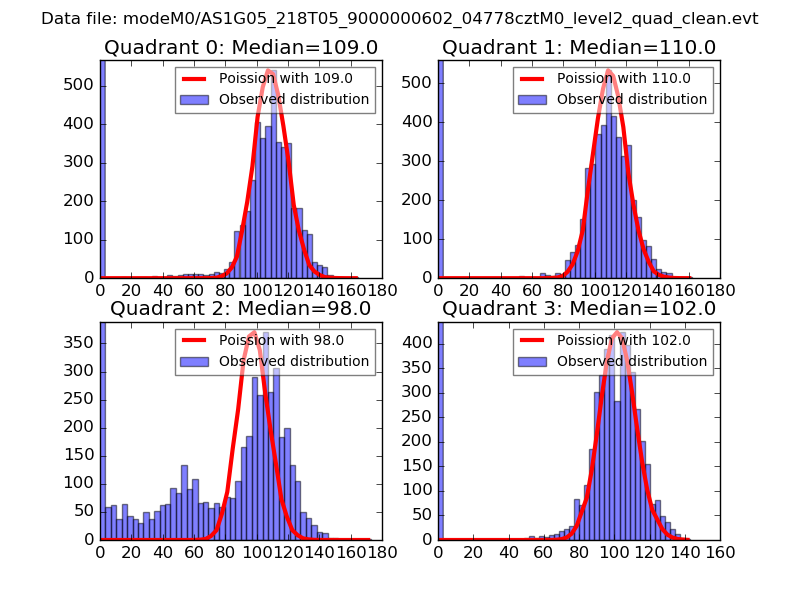 |
 |
| Quadrant-wise count rates Data is divided into 100 sec bins |
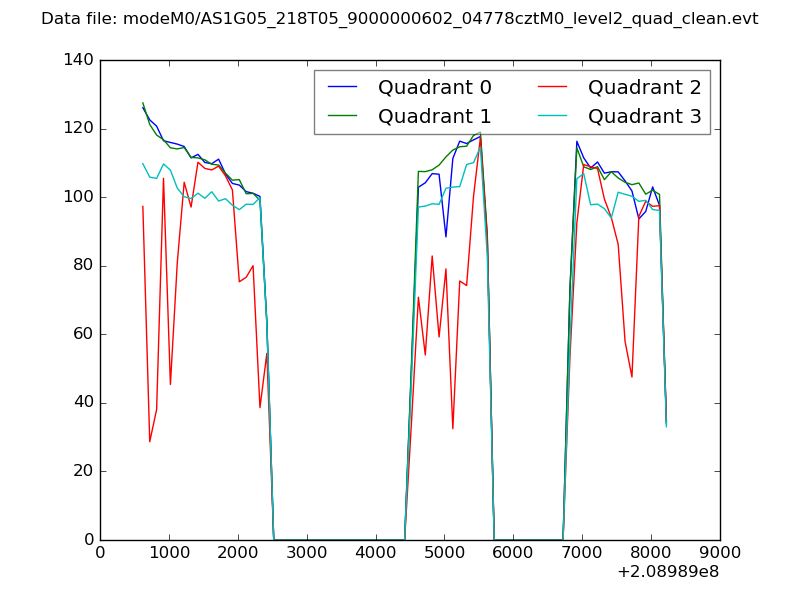 |
|
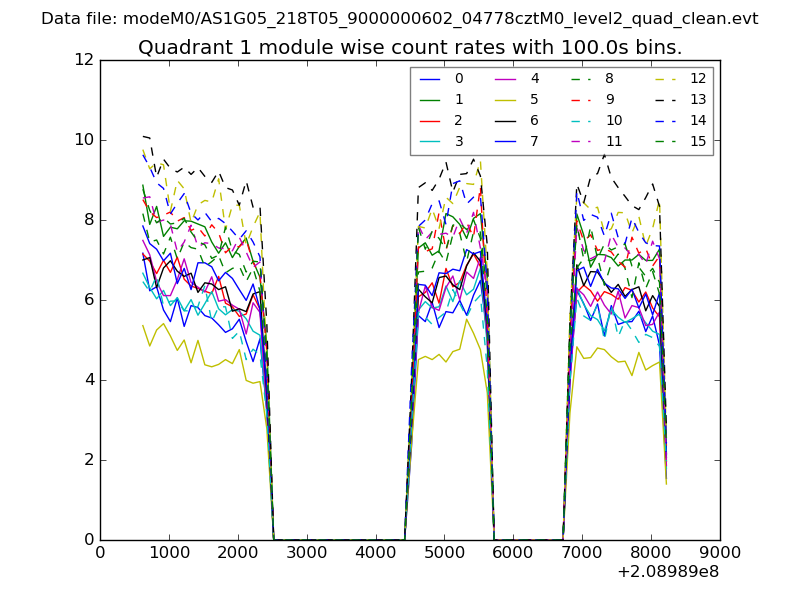
| Module-wise count rates for Quadrant A Data is divided into 100 sec bins |
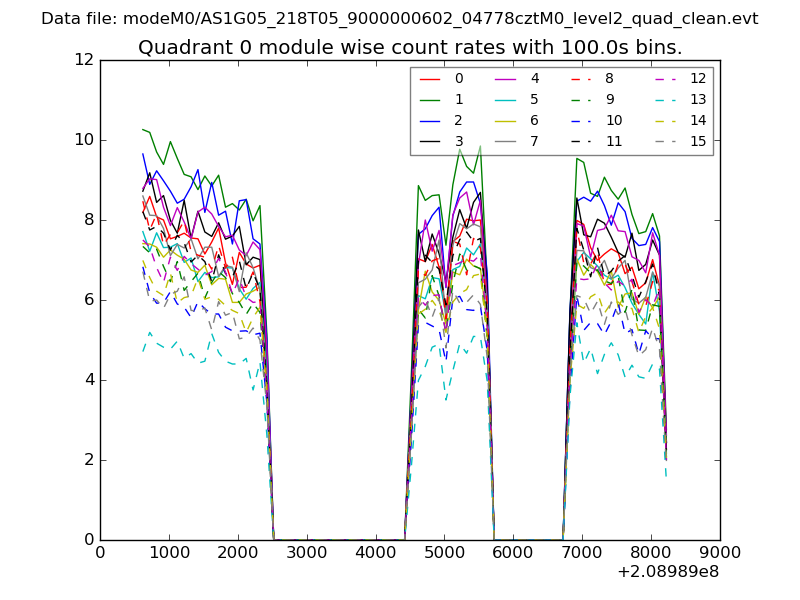 |
 |
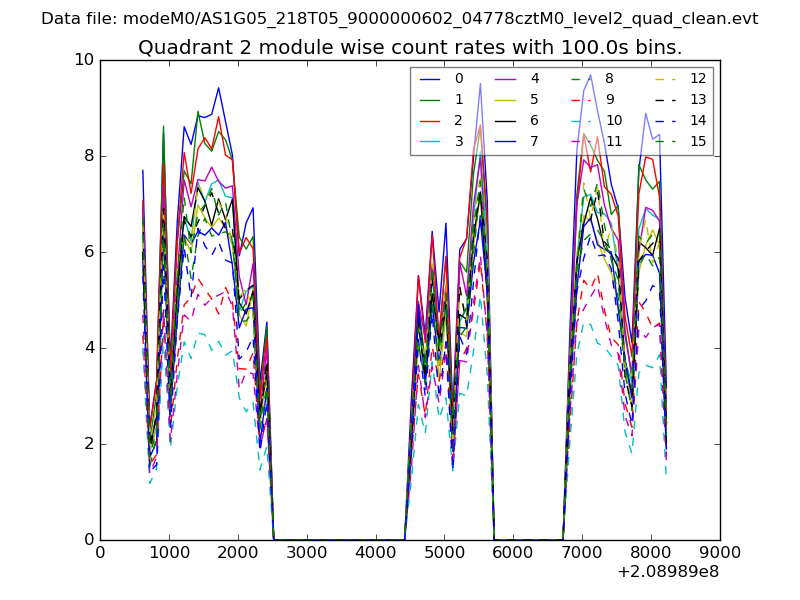
| Module-wise count rates for Quadrant B Data is divided into 100 sec bins |
 |
 |
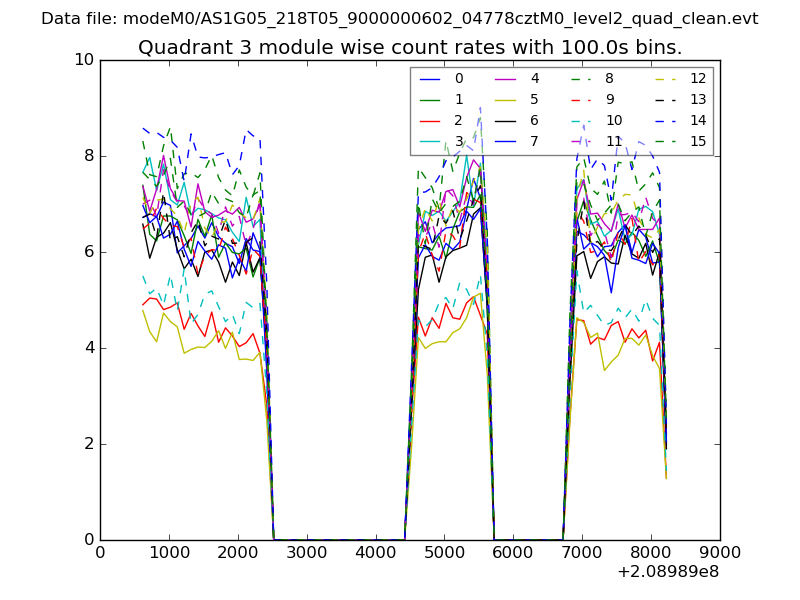
| Module-wise count rates for Quadrant C Data is divided into 100 sec bins |
 |
 |
| Module-wise count rates for Quadrant D Data is divided into 100 sec bins |
 |
 |
| Parameter | Plot |
|---|---|
| CZT HV Monitor | 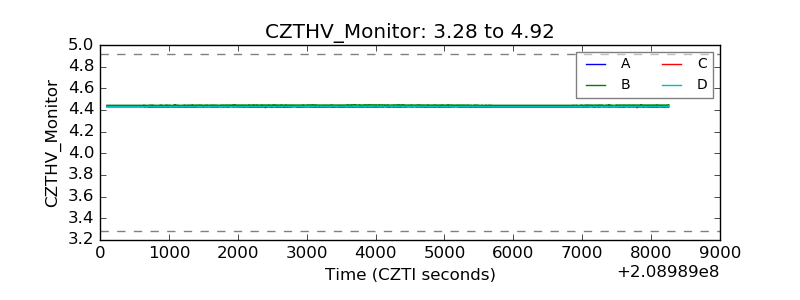 |
| D_VDD | 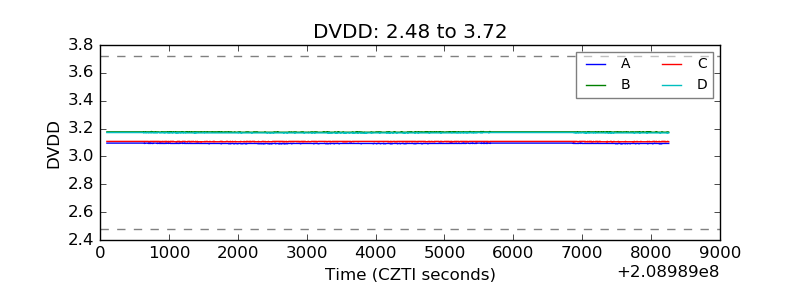 |
| Temperature 1 | 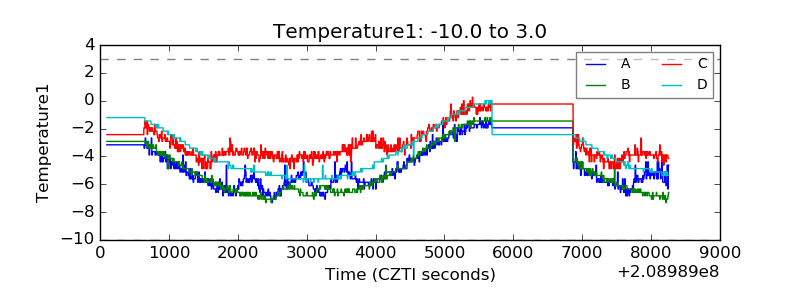 |
| Veto HV Monitor | 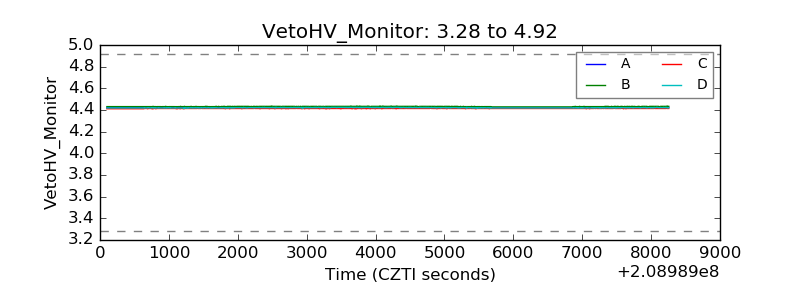 |
| Veto LLD | 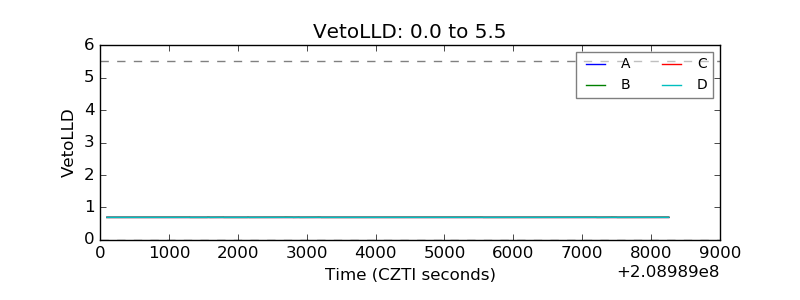 |
| Alpha Counter | 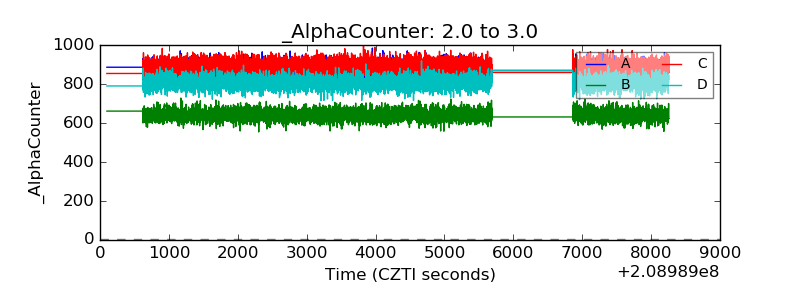 |
| _CPM_Rate | 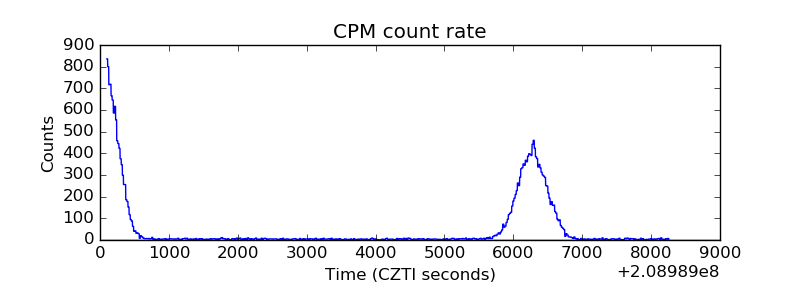 |
| CZT Counter | 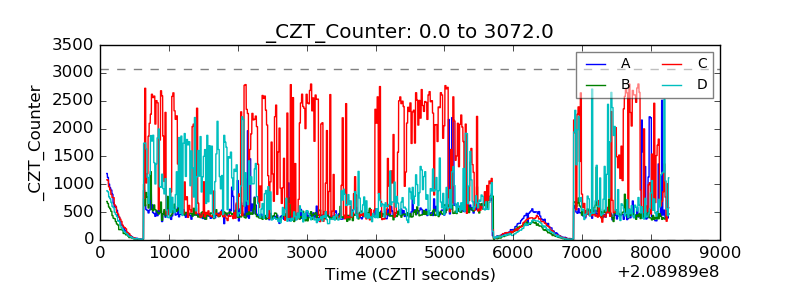 |
| +2.5 Volts monitor |  |
| +5 Volts monitor |  |
| _ROLL_ROT | 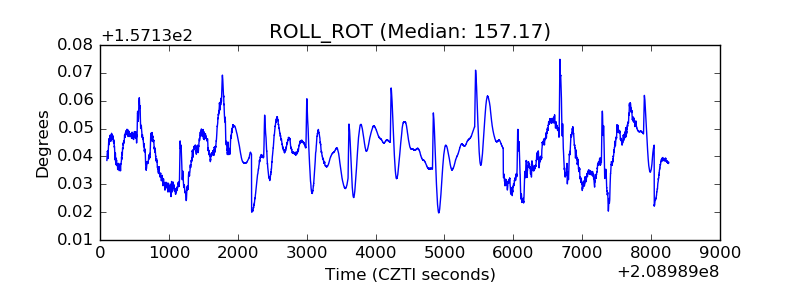 |
| _Roll_DEC | 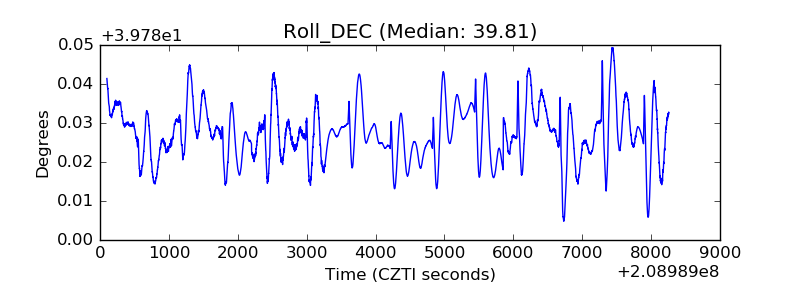 |
| _Roll_RA | 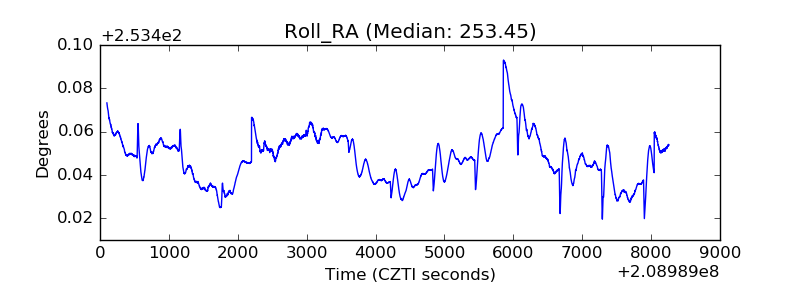 |
| Veto Counter | 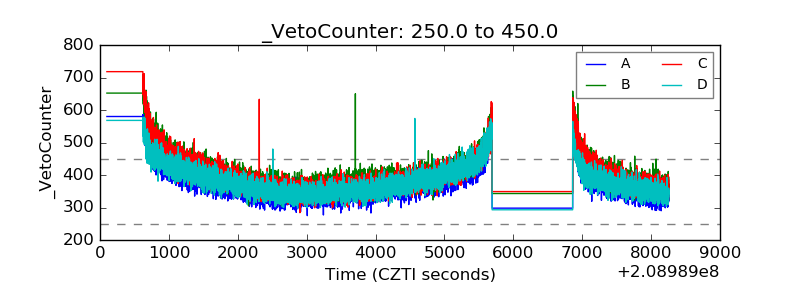 |