| Param | Original file | Final file |
|---|---|---|
| Filename | modeM0/AS1G05_218T05_9000000602_04779cztM0_level2.evt | modeM0/AS1G05_218T05_9000000602_04779cztM0_level2_quad_clean.evt |
| Size (bytes) | 659,776,320 | 73,869,120 |
| Size | 629.2 MB | 70.4 MB |
| Events in quadrant A | 3,353,585 | 464,058 |
| Events in quadrant B | 3,123,682 | 469,503 |
| Events in quadrant C | 6,434,991 | 430,455 |
| Events in quadrant D | 6,615,836 | 405,113 |
| Mode M9 | |||
|---|---|---|---|
| Quadrant | BADHDUFLAG | Total packets | Discarded packets |
| A | 0 | 18 | 0 |
| B | 0 | 18 | 0 |
| C | 0 | 18 | 0 |
| D | 0 | 19 | 0 |
| Mode SS | |||
|---|---|---|---|
| Quadrant | BADHDUFLAG | Total packets | Discarded packets |
| A | 0 | 136 | 0 |
| B | 0 | 136 | 0 |
| C | 0 | 136 | 0 |
| D | 0 | 136 | 0 |
| Mode M0 | |||
|---|---|---|---|
| Quadrant | BADHDUFLAG | Total packets | Discarded packets |
| A | 0 | 14711 | 3 |
| B | 0 | 13941 | 2 |
| C | 0 | 23817 | 15 |
| D | 0 | 24431 | 6 |
| Quadrant | Total seconds | Saturated seconds | Saturation percentage |
|---|---|---|---|
| A | 6696 | 273 | 4.077061% |
| B | 6696 | 18 | 0.268817% |
| C | 6693 | 970 | 14.492754% |
| D | 6695 | 1047 | 15.638536% |
Noise dominated data is calculated using 1-second bins in cleaned event files. If a bin has >2000 counts, and if more than 50% of those come from <1% of pixels, then it is considered to be noise-dominated and hence unusable.
| Quadrant | # 1 sec bins | Bins with >0 counts | Bins with >2000 counts | High rate bins dominated by noise | Noise dominated (total time) | Noise dominated (detector-on time) | Marked lightcurve |
|---|---|---|---|---|---|---|---|
| A | 7526 | 6697 | 45 | 45 | 0.60% | 0.67% | 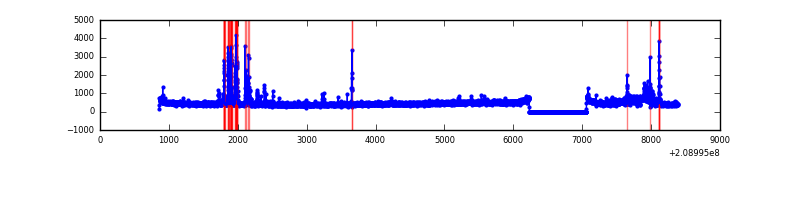 |
| B | 7526 | 6697 | 0 | 0 | 0.00% | 0.00% | 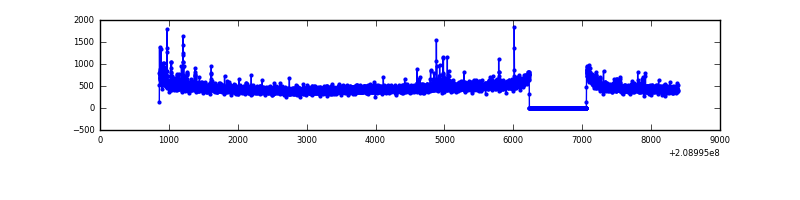 |
| C | 7526 | 6697 | 764 | 764 | 10.15% | 11.41% | 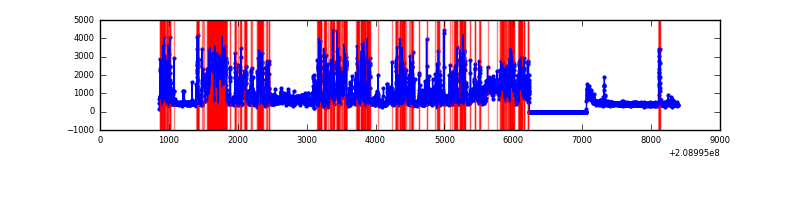 |
| D | 7526 | 6697 | 785 | 785 | 10.43% | 11.72% | 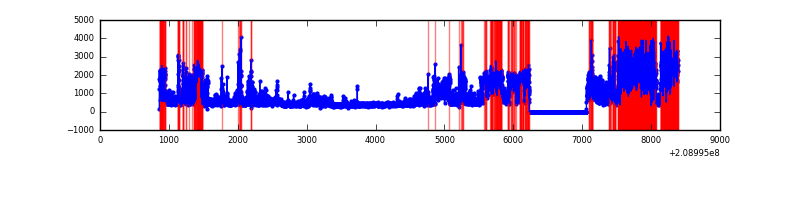 |
Top three noisy pixels from each quadrant. If the there are fewer than three noisy pixels in the level2.evt file, extra rows are filled as -1
| Pixel properties | Quadrant properties | ||||||
|---|---|---|---|---|---|---|---|
| Quadrant | DetID | PixID | Counts | Sigma | Mean | Median | Sigma |
| A | 0 | 50 | 282932 | 1849.91 | 747 | 729 | 152.5 |
| A | 14 | 111 | 133819 | 872.44 | 747 | 729 | 152.5 |
| A | 8 | 15 | 34790 | 223.28 | 747 | 729 | 152.5 |
| B | 14 | 167 | 52696 | 355.95 | 766 | 747 | 145.9 |
| B | 4 | 80 | 51528 | 347.95 | 766 | 747 | 145.9 |
| B | 15 | 204 | 23047 | 152.8 | 766 | 747 | 145.9 |
| C | 14 | 48 | 3675653 | 22619.93 | 696 | 699 | 162.5 |
| C | 9 | 237 | 23758 | 141.93 | 696 | 699 | 162.5 |
| C | 1 | 16 | 13896 | 81.23 | 696 | 699 | 162.5 |
| D | 11 | 132 | 1985576 | 11786.11 | 690 | 669 | 168.4 |
| D | 13 | 235 | 1510297 | 8963.97 | 690 | 669 | 168.4 |
| D | 2 | 136 | 199029 | 1177.83 | 690 | 669 | 168.4 |
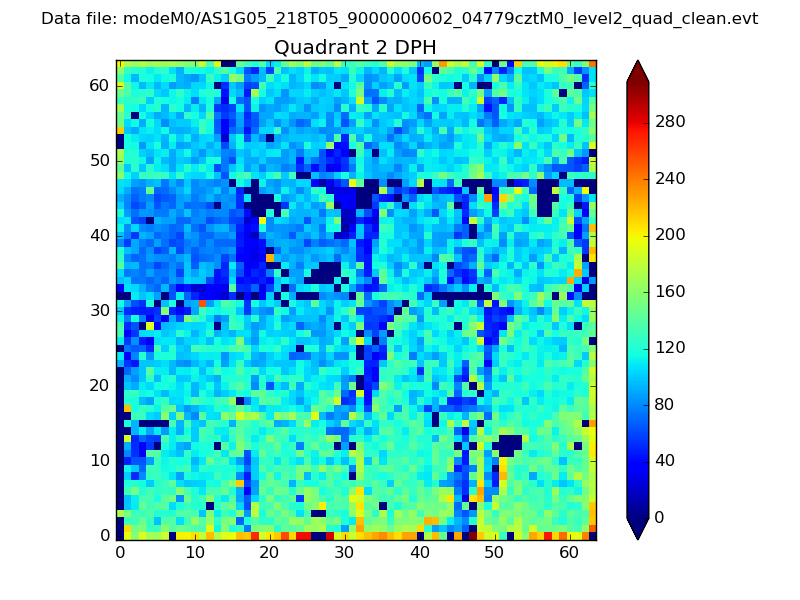
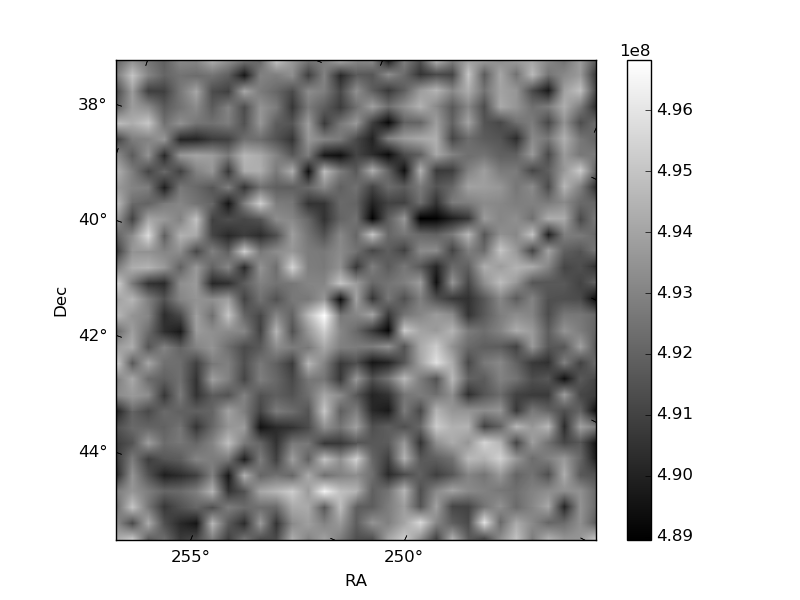
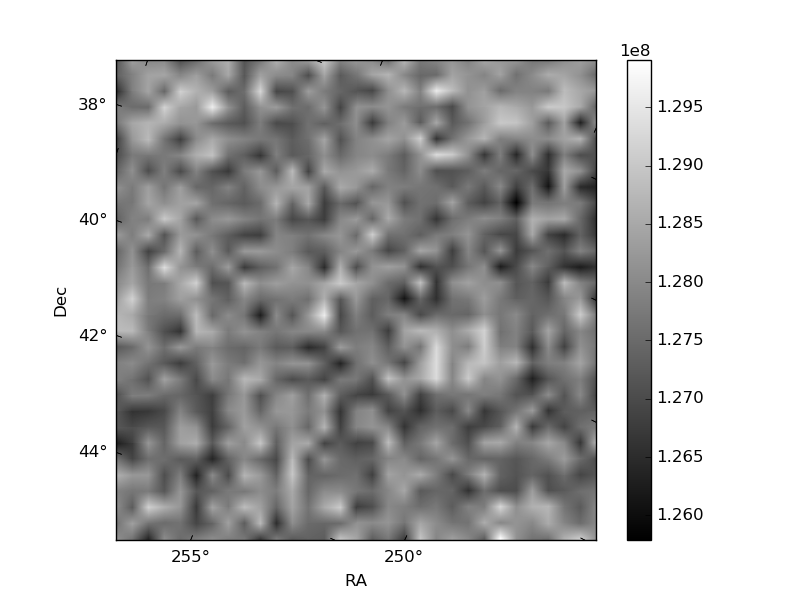
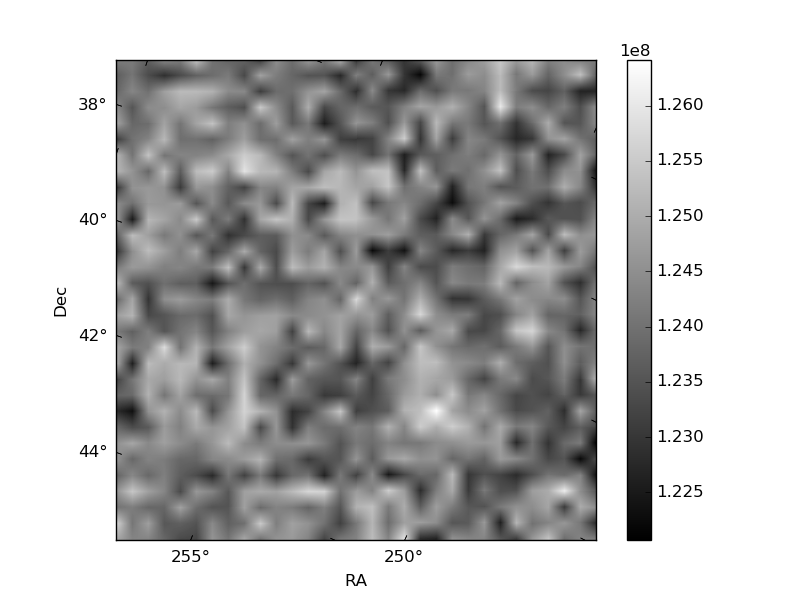
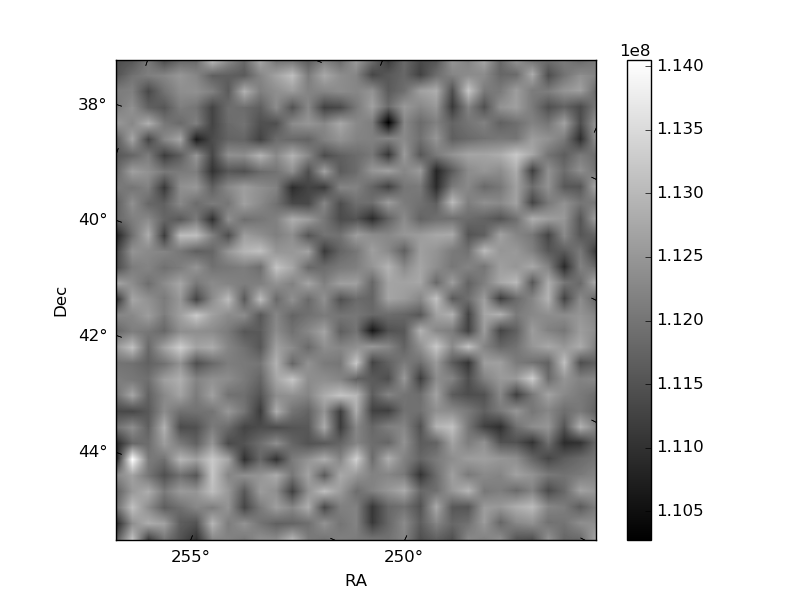
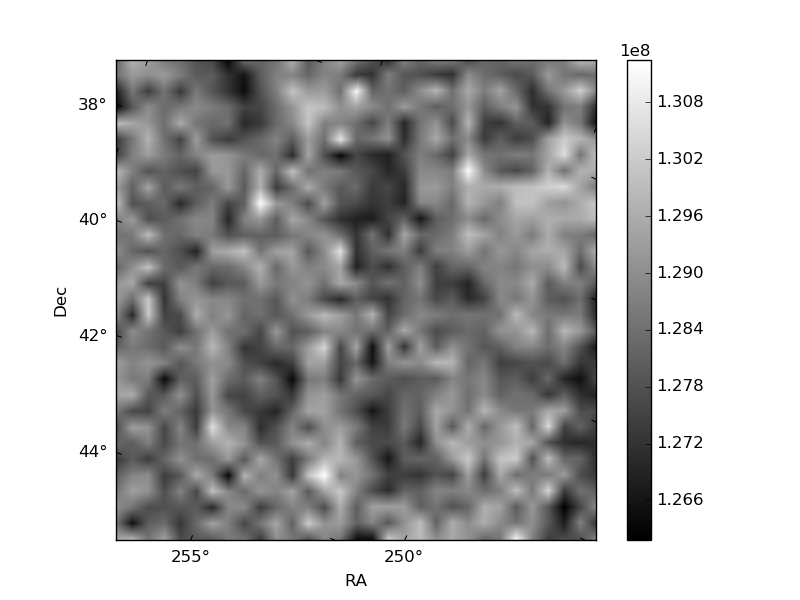
Histogram calculated using DETX and DETY for each event in the final _common_clean file
| Quadrant A | 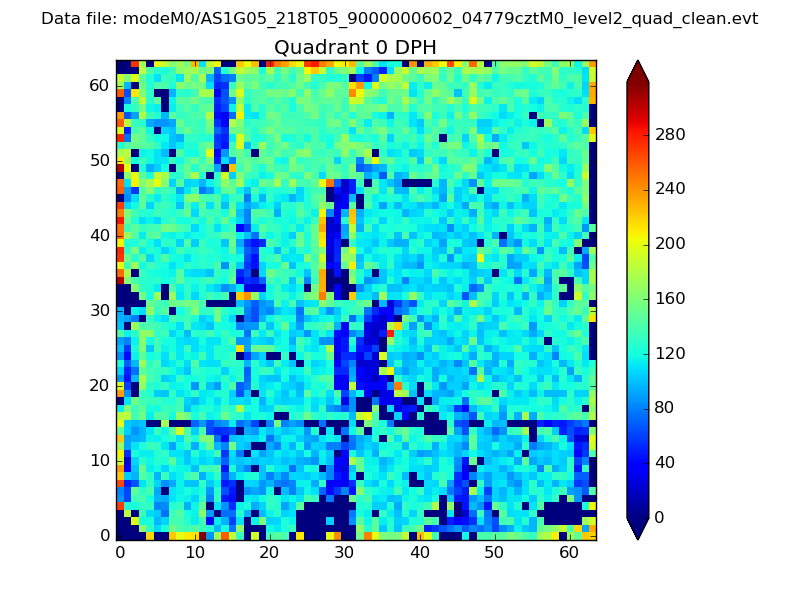 |
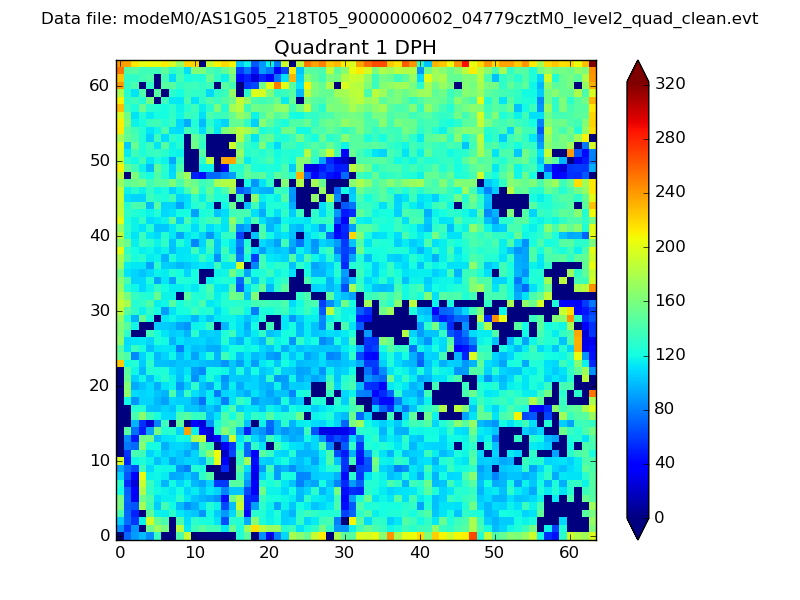 |
Quadrant B |
|---|---|---|---|
| Quadrant D | 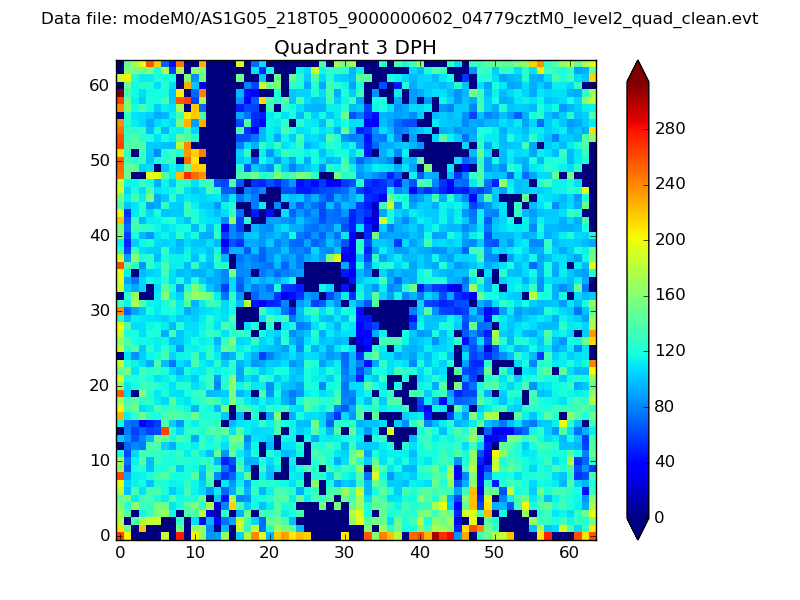 |
 |
Quadrant C |
| Plot type | Count rate plots | Images |
|---|---|---|
| Comparison with Poisson distribution Blue bars denote a histogram of data divided into 1 sec bins. Red curve is a Poisson curve with rate = median count rate of data. |
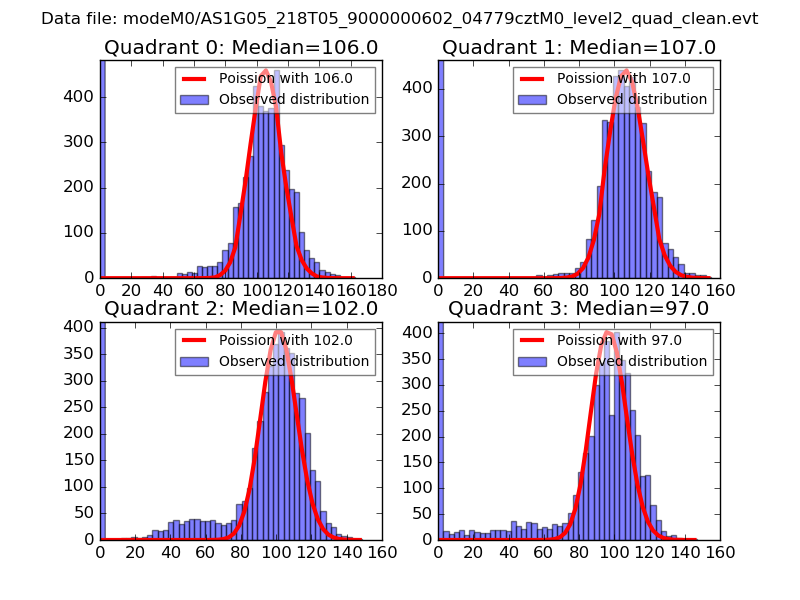 |
 |
| Quadrant-wise count rates Data is divided into 100 sec bins |
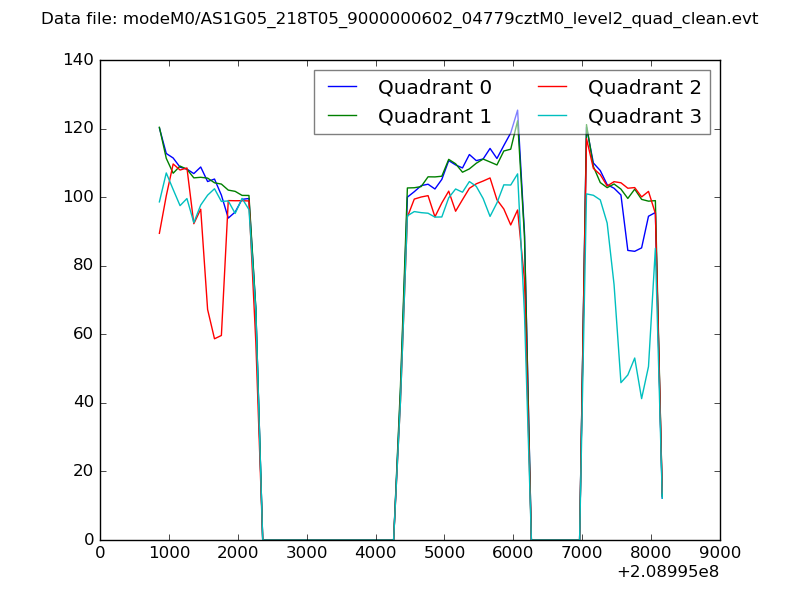 |
|
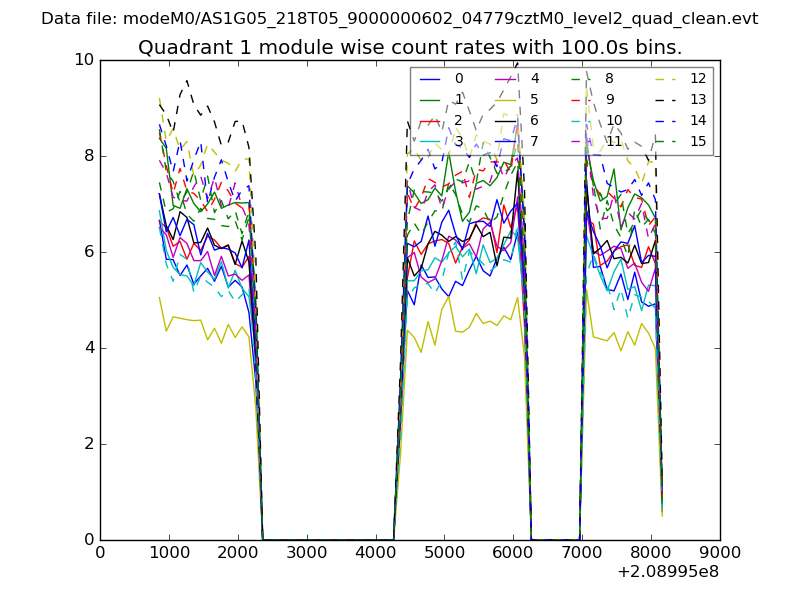
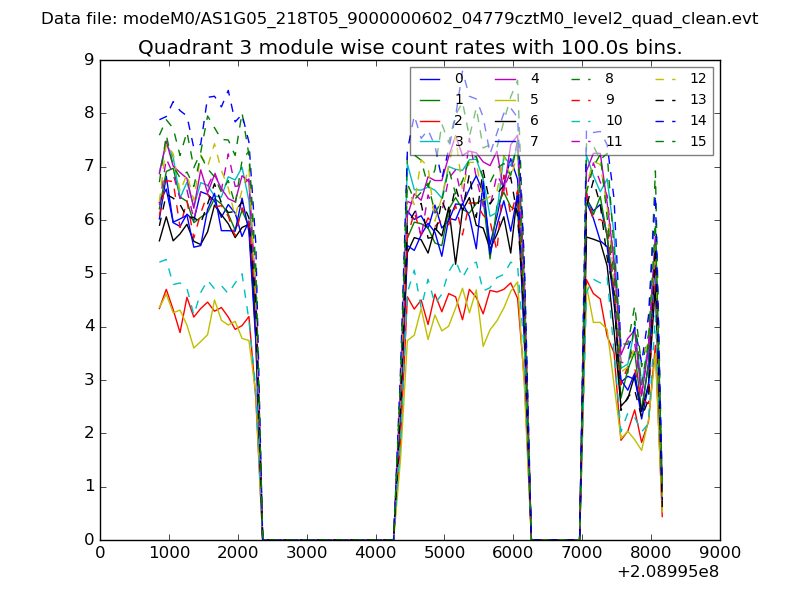
| Module-wise count rates for Quadrant A Data is divided into 100 sec bins |
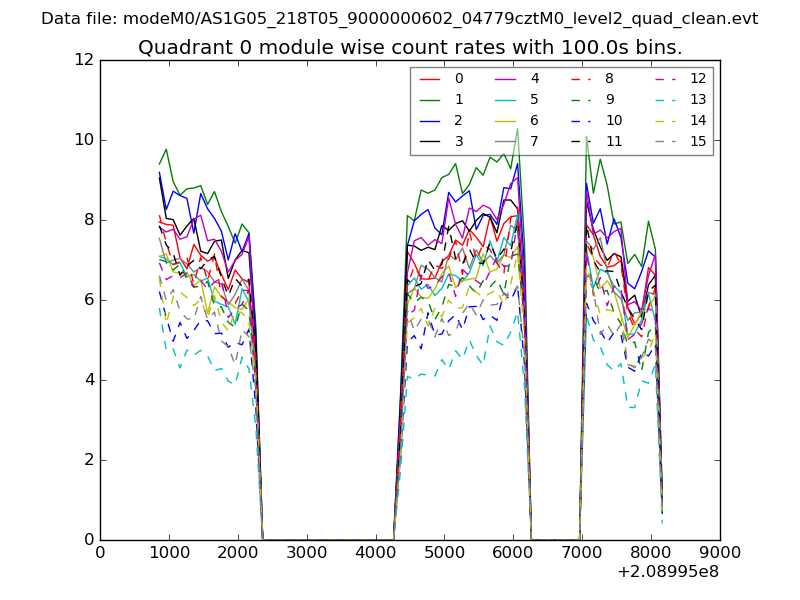 |
 |
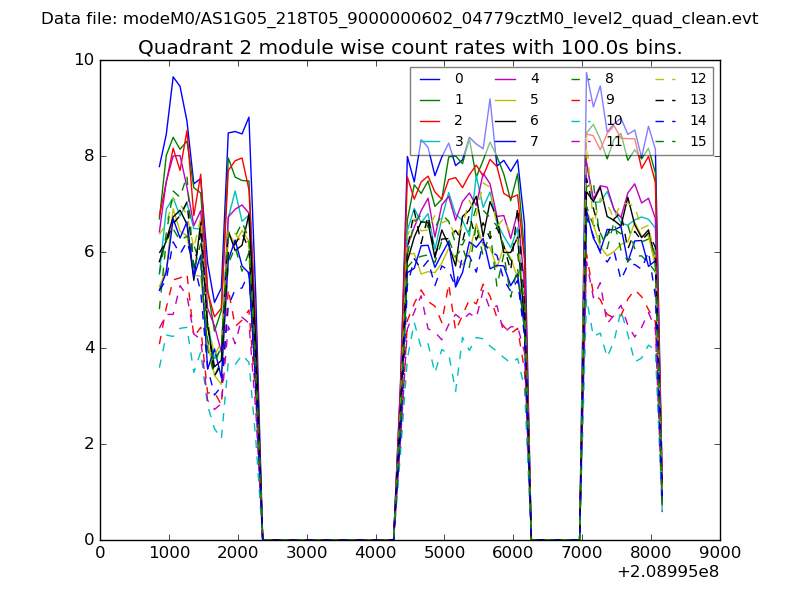
| Module-wise count rates for Quadrant B Data is divided into 100 sec bins |
 |
 |
| Module-wise count rates for Quadrant C Data is divided into 100 sec bins |
 |
 |
| Module-wise count rates for Quadrant D Data is divided into 100 sec bins |
 |
 |
| Parameter | Plot |
|---|---|
| CZT HV Monitor | 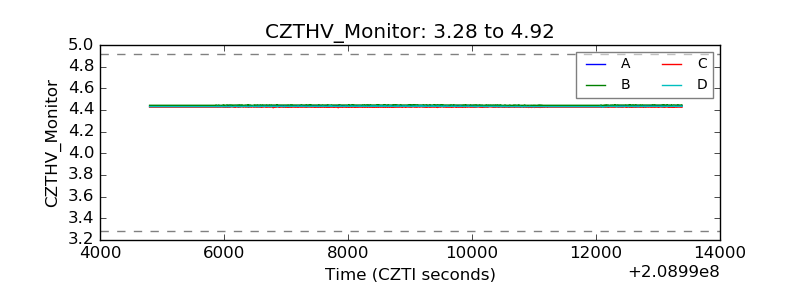 |
| D_VDD |  |
| Temperature 1 | 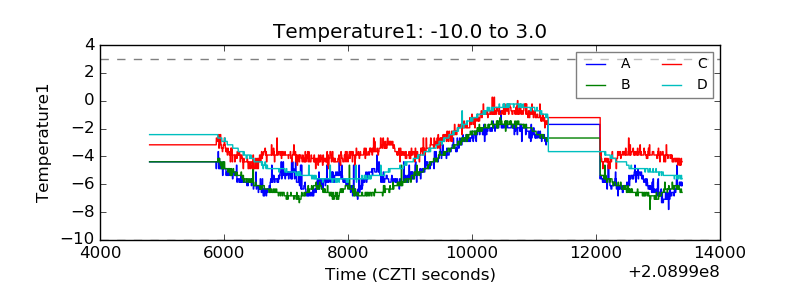 |
| Veto HV Monitor | 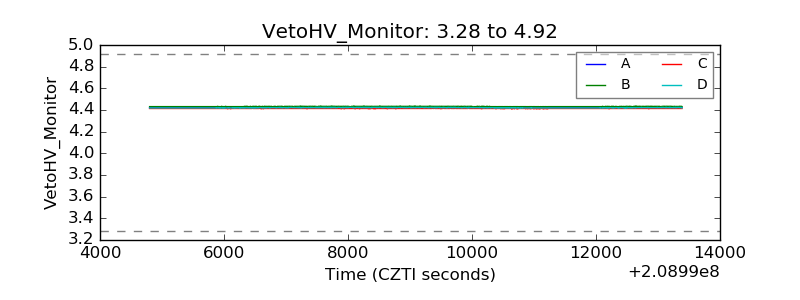 |
| Veto LLD | 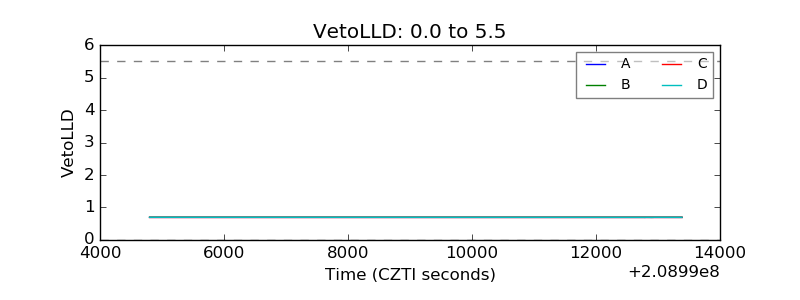 |
| Alpha Counter | 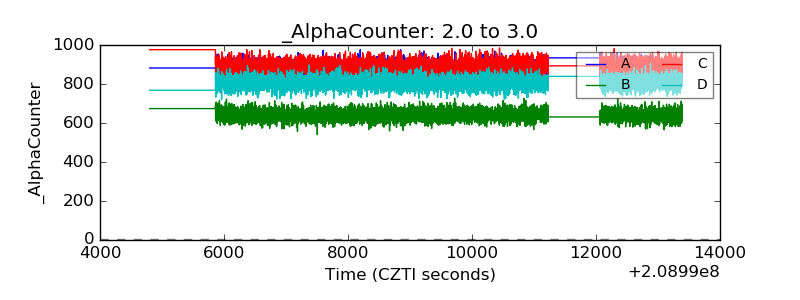 |
| _CPM_Rate | 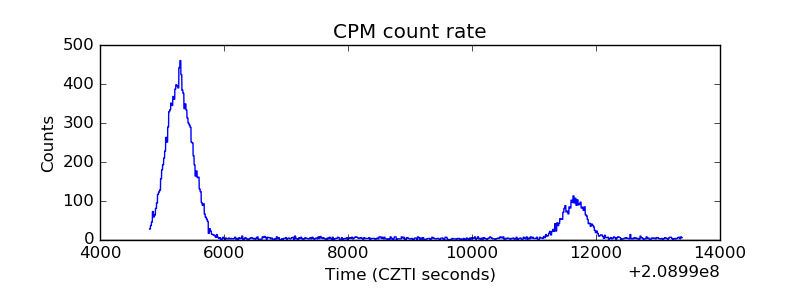 |
| CZT Counter | 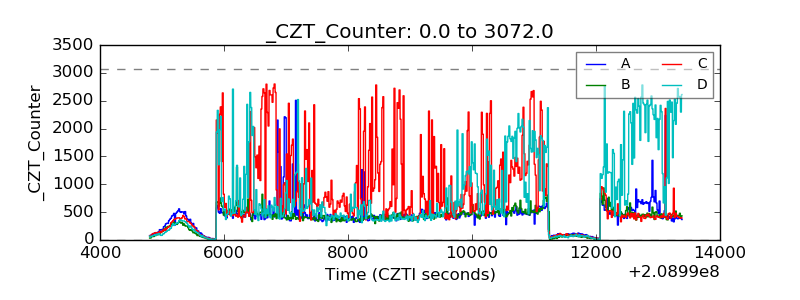 |
| +2.5 Volts monitor |  |
| +5 Volts monitor |  |
| _ROLL_ROT | 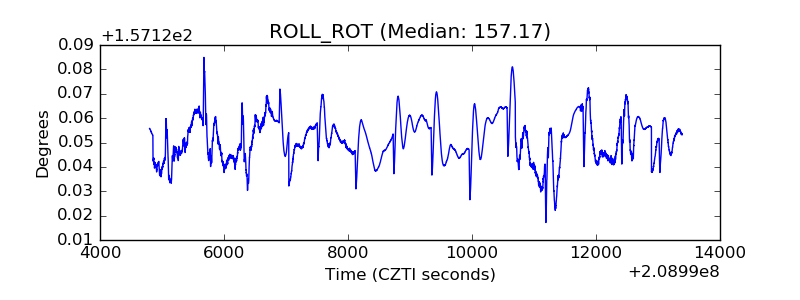 |
| _Roll_DEC | 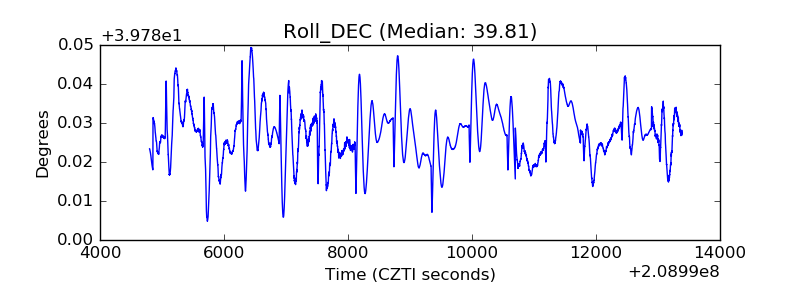 |
| _Roll_RA | 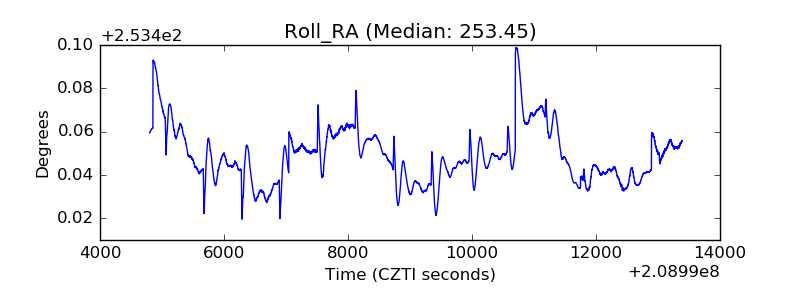 |
| Veto Counter | 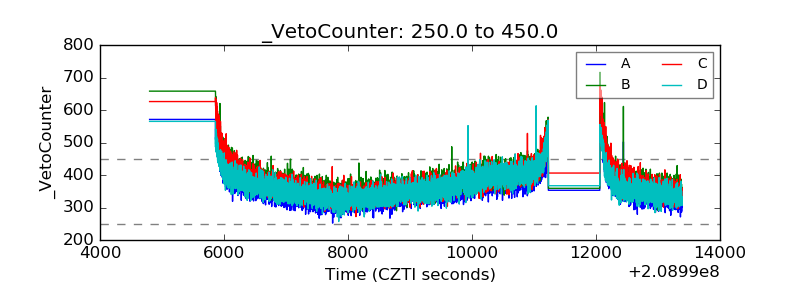 |