| Param | Original file | Final file |
|---|---|---|
| Filename | modeM0/AS1G05_218T05_9000000602_04780cztM0_level2.evt | modeM0/AS1G05_218T05_9000000602_04780cztM0_level2_quad_clean.evt |
| Size (bytes) | 744,281,280 | 84,363,840 |
| Size | 709.8 MB | 80.5 MB |
| Events in quadrant A | 4,191,842 | 498,917 |
| Events in quadrant B | 3,745,772 | 527,899 |
| Events in quadrant C | 5,309,987 | 512,139 |
| Events in quadrant D | 8,757,384 | 464,735 |
| Mode M9 | |||
|---|---|---|---|
| Quadrant | BADHDUFLAG | Total packets | Discarded packets |
| A | 0 | 11 | 0 |
| B | 0 | 11 | 0 |
| C | 0 | 11 | 0 |
| D | 0 | 11 | 0 |
| Mode SS | |||
|---|---|---|---|
| Quadrant | BADHDUFLAG | Total packets | Discarded packets |
| A | 0 | 164 | 0 |
| B | 0 | 164 | 0 |
| C | 0 | 164 | 0 |
| D | 0 | 164 | 0 |
| Mode M0 | |||
|---|---|---|---|
| Quadrant | BADHDUFLAG | Total packets | Discarded packets |
| A | 0 | 18115 | 4 |
| B | 0 | 16528 | 3 |
| C | 0 | 21400 | 3 |
| D | 0 | 31676 | 3 |
| Quadrant | Total seconds | Saturated seconds | Saturation percentage |
|---|---|---|---|
| A | 7901 | 1226 | 15.517023% |
| B | 7901 | 86 | 1.088470% |
| C | 7901 | 489 | 6.189090% |
| D | 7901 | 1210 | 15.314517% |
Noise dominated data is calculated using 1-second bins in cleaned event files. If a bin has >2000 counts, and if more than 50% of those come from <1% of pixels, then it is considered to be noise-dominated and hence unusable.
| Quadrant | # 1 sec bins | Bins with >0 counts | Bins with >2000 counts | High rate bins dominated by noise | Noise dominated (total time) | Noise dominated (detector-on time) | Marked lightcurve |
|---|---|---|---|---|---|---|---|
| A | 9116 | 7904 | 18 | 18 | 0.20% | 0.23% | 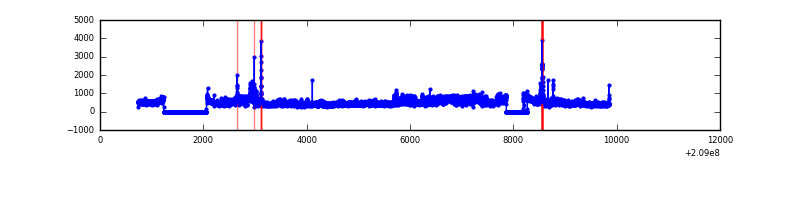 |
| B | 9116 | 7904 | 1 | 1 | 0.01% | 0.01% | 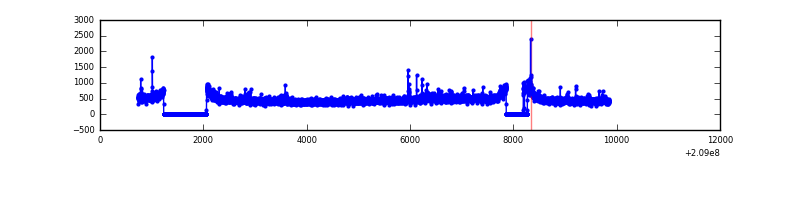 |
| C | 9116 | 7904 | 260 | 260 | 2.85% | 3.29% | 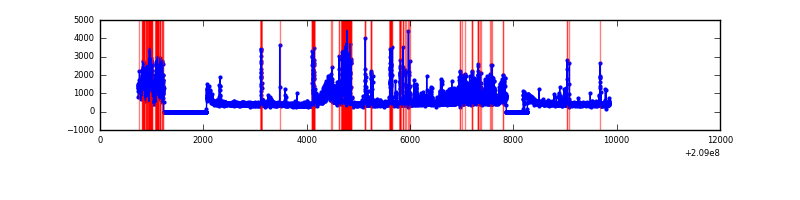 |
| D | 9116 | 7904 | 946 | 946 | 10.38% | 11.97% | 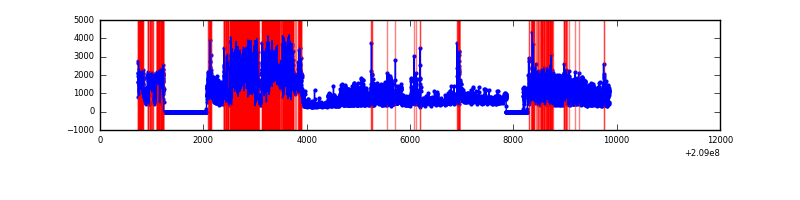 |
Top three noisy pixels from each quadrant. If the there are fewer than three noisy pixels in the level2.evt file, extra rows are filled as -1
| Pixel properties | Quadrant properties | ||||||
|---|---|---|---|---|---|---|---|
| Quadrant | DetID | PixID | Counts | Sigma | Mean | Median | Sigma |
| A | 14 | 111 | 602690 | 3365.42 | 877 | 857 | 178.8 |
| A | 0 | 50 | 145090 | 806.54 | 877 | 857 | 178.8 |
| A | 8 | 15 | 56736 | 312.47 | 877 | 857 | 178.8 |
| B | 14 | 167 | 53696 | 295.29 | 924 | 899 | 178.8 |
| B | 4 | 80 | 52867 | 290.66 | 924 | 899 | 178.8 |
| B | 15 | 204 | 24929 | 134.4 | 924 | 899 | 178.8 |
| C | 14 | 48 | 1862110 | 9056.39 | 878 | 881 | 205.5 |
| C | 1 | 16 | 10717 | 47.86 | 878 | 881 | 205.5 |
| C | 13 | 61 | 7205 | 30.77 | 878 | 881 | 205.5 |
| D | 11 | 132 | 2837383 | 13958.89 | 839 | 812 | 203.2 |
| D | 13 | 235 | 2365157 | 11635.04 | 839 | 812 | 203.2 |
| D | 2 | 136 | 183732 | 900.15 | 839 | 812 | 203.2 |
Histogram calculated using DETX and DETY for each event in the final _common_clean file
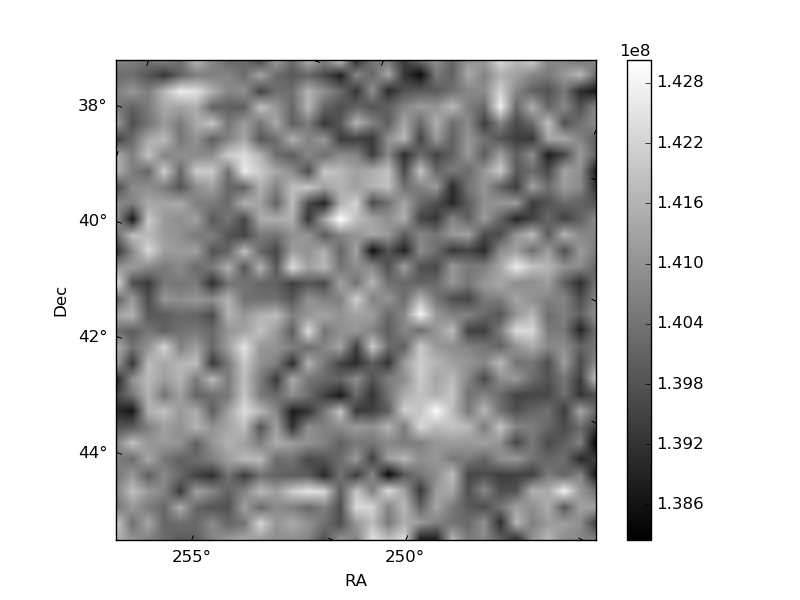
| Quadrant A | 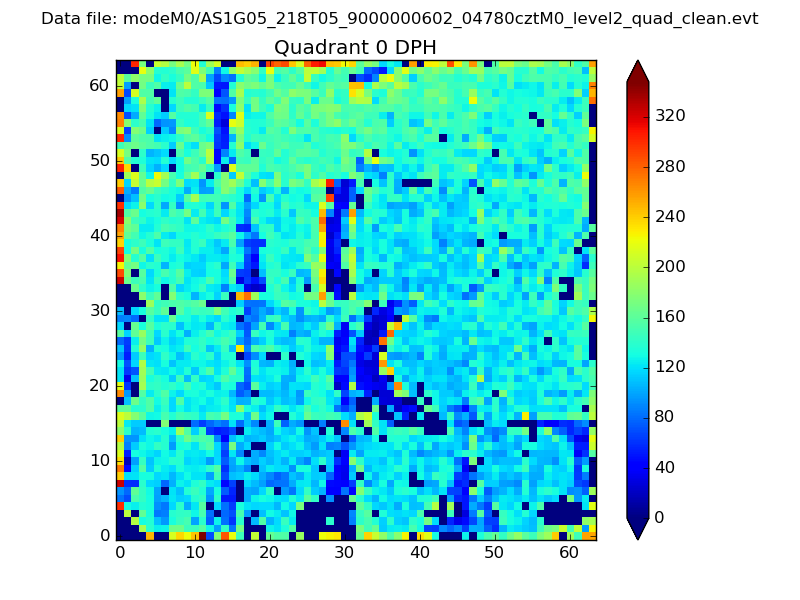 |
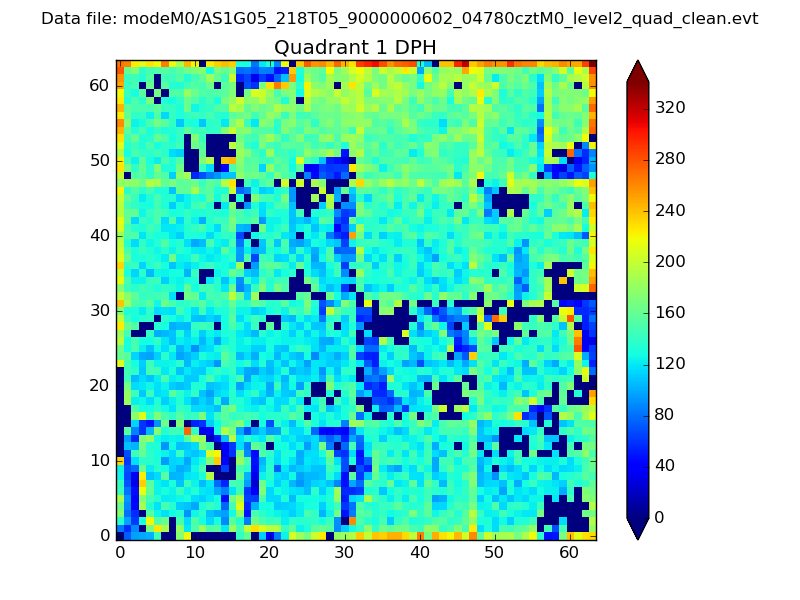 |
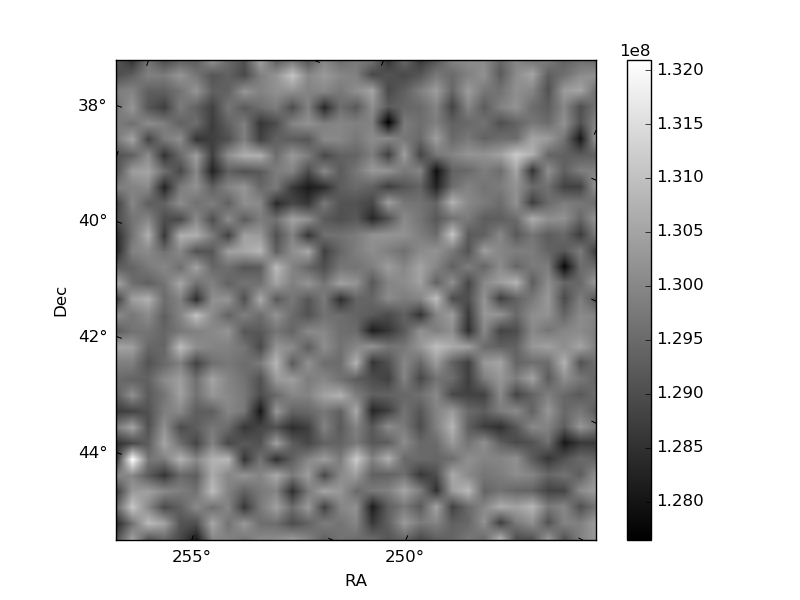
Quadrant B |
|---|---|---|---|
| Quadrant D | 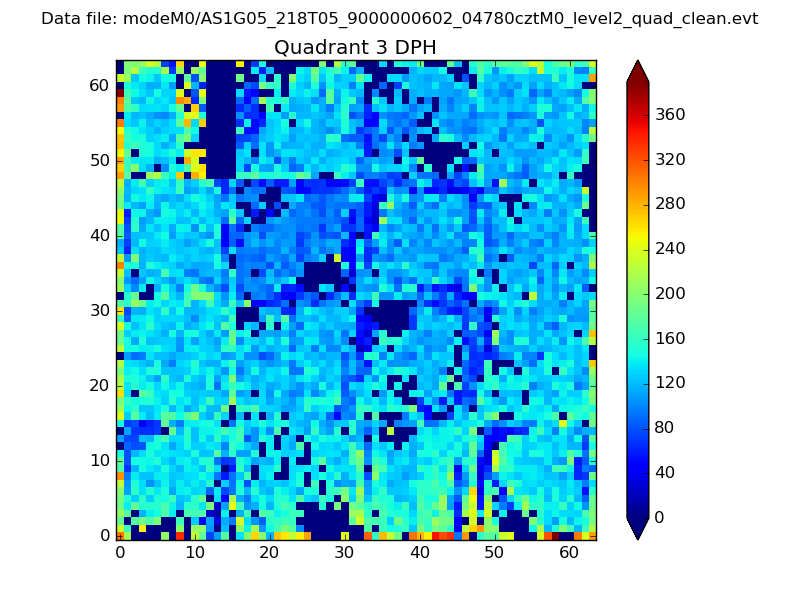 |
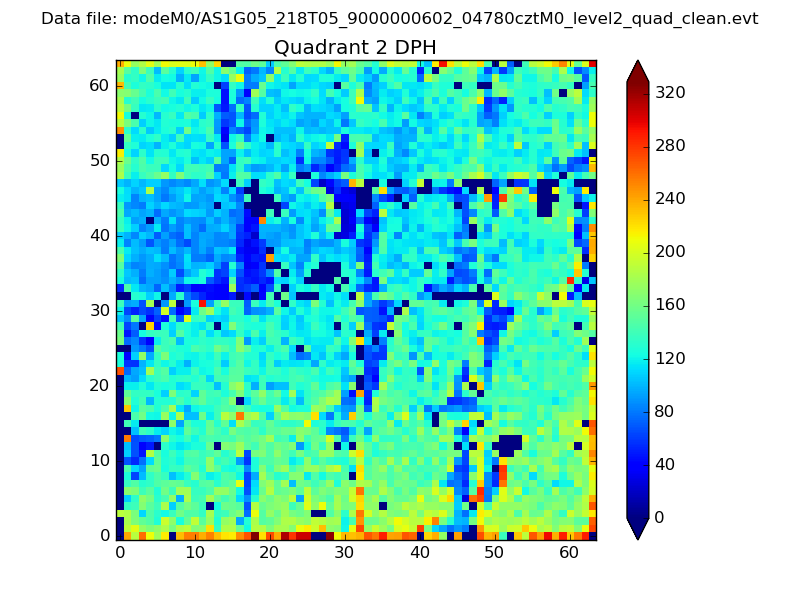 |
Quadrant C |
| Plot type | Count rate plots | Images |
|---|---|---|
| Comparison with Poisson distribution Blue bars denote a histogram of data divided into 1 sec bins. Red curve is a Poisson curve with rate = median count rate of data. |
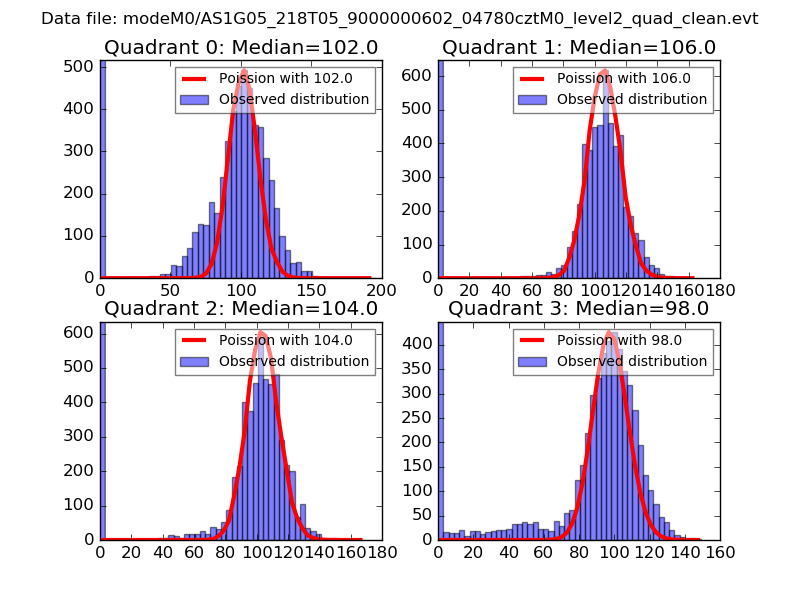 |
 |
| Quadrant-wise count rates Data is divided into 100 sec bins |
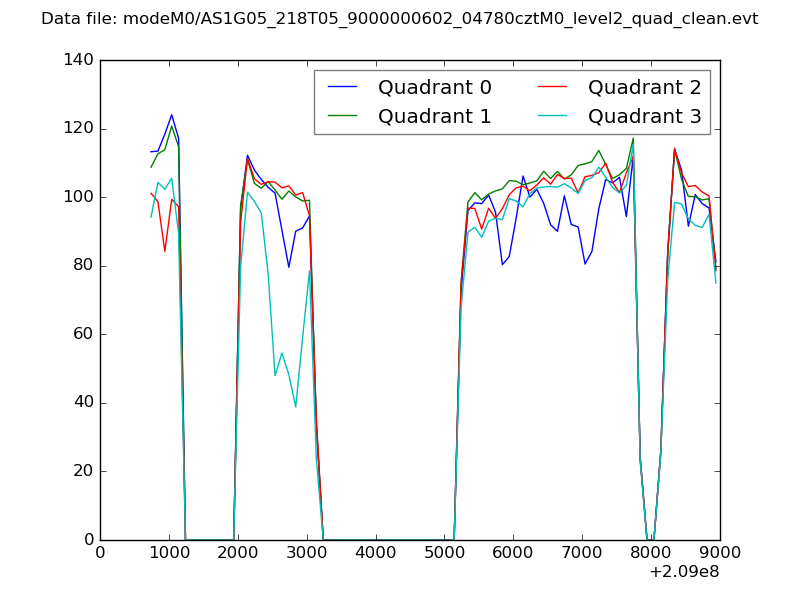 |
|
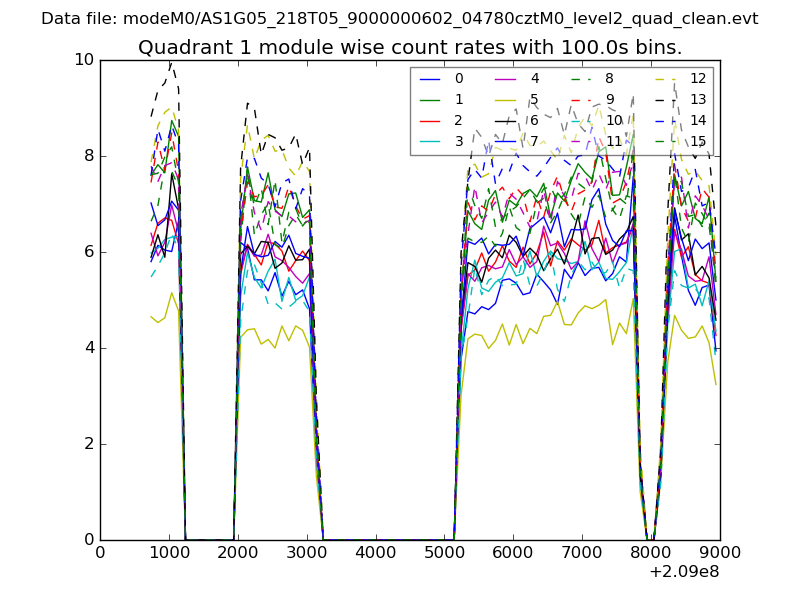
| Module-wise count rates for Quadrant A Data is divided into 100 sec bins |
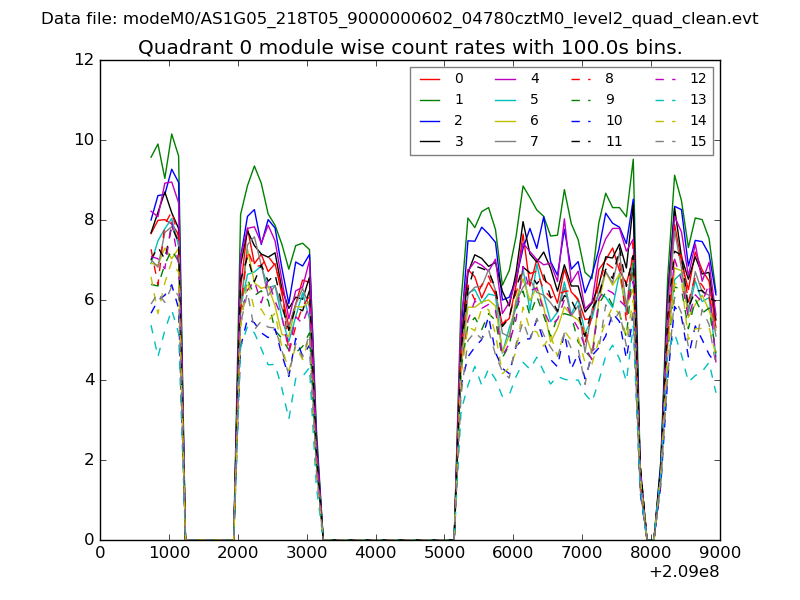 |
 |
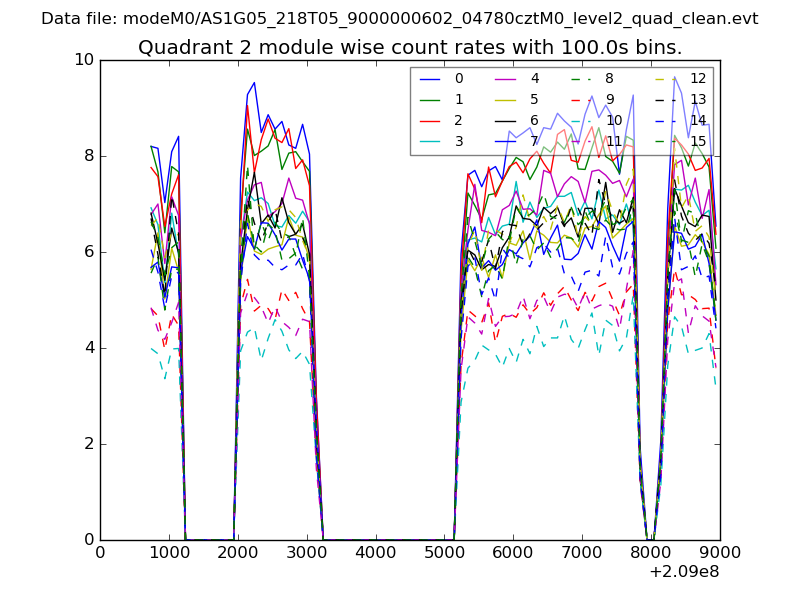
| Module-wise count rates for Quadrant B Data is divided into 100 sec bins |
 |
 |
| Module-wise count rates for Quadrant C Data is divided into 100 sec bins |
 |
 |
| Module-wise count rates for Quadrant D Data is divided into 100 sec bins |
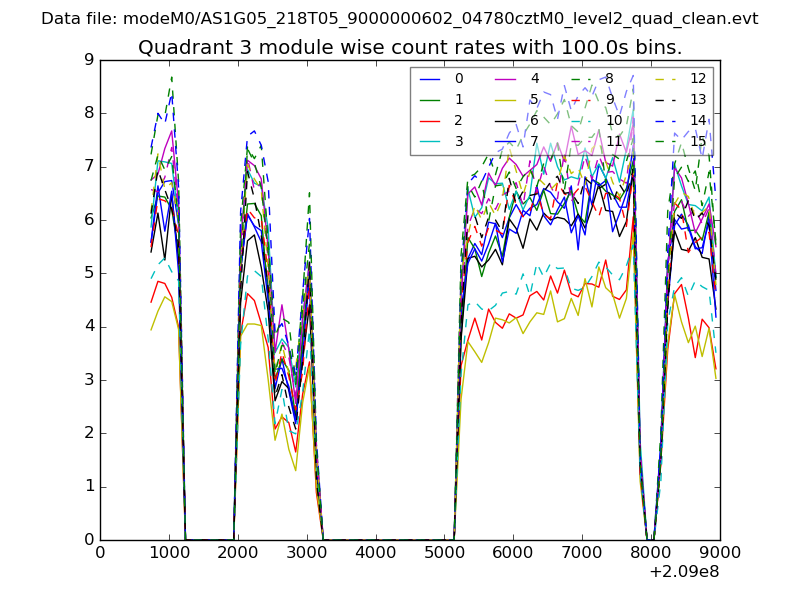 |
 |
| Parameter | Plot |
|---|---|
| CZT HV Monitor | 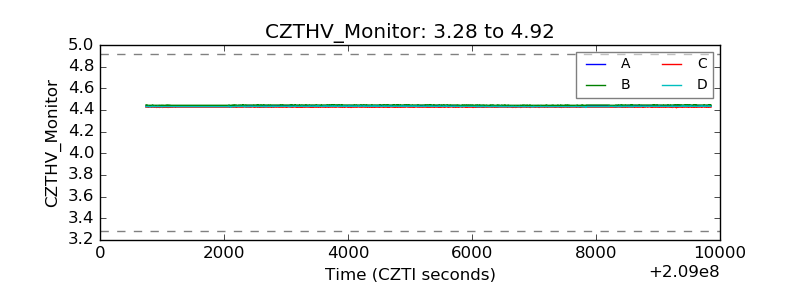 |
| D_VDD | 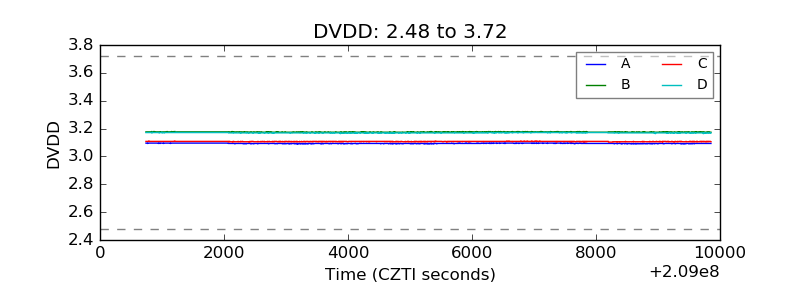 |
| Temperature 1 | 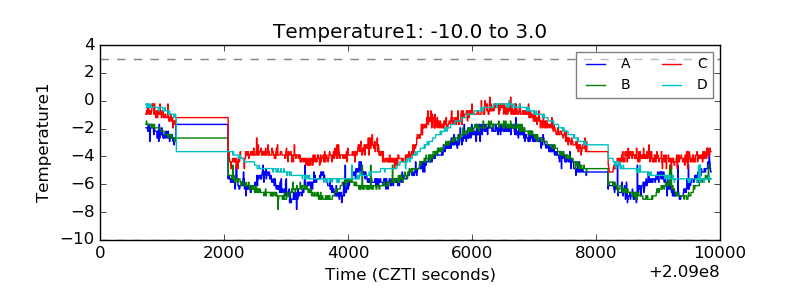 |
| Veto HV Monitor | 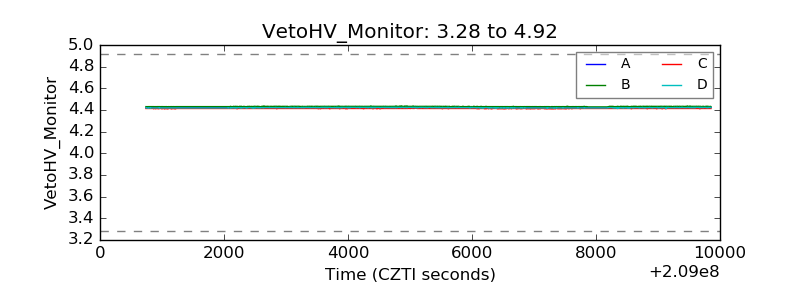 |
| Veto LLD | 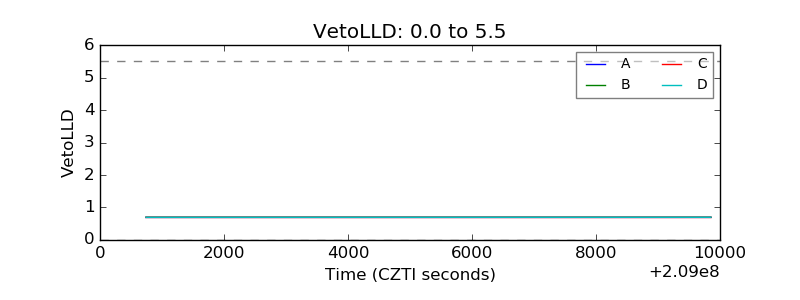 |
| Alpha Counter | 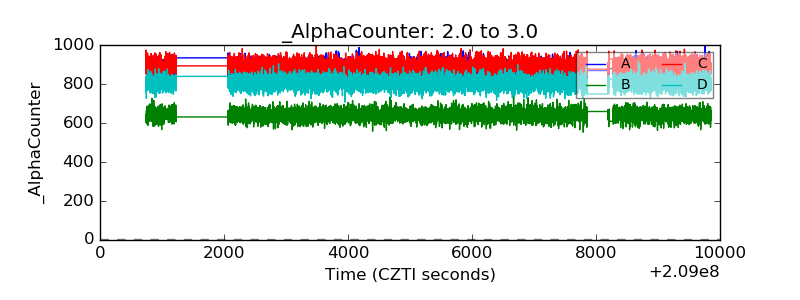 |
| _CPM_Rate | 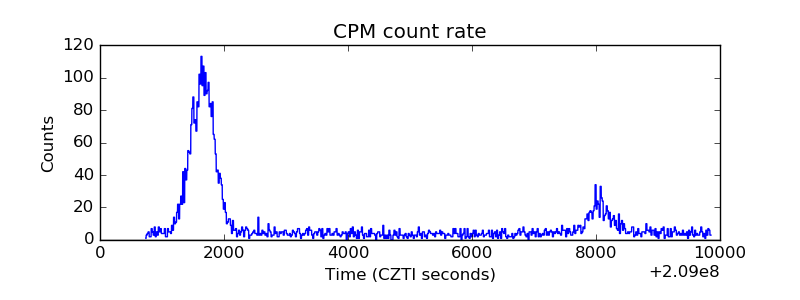 |
| CZT Counter | 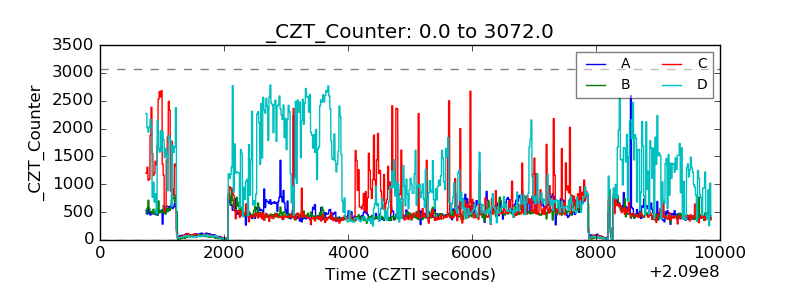 |
| +2.5 Volts monitor |  |
| +5 Volts monitor |  |
| _ROLL_ROT | 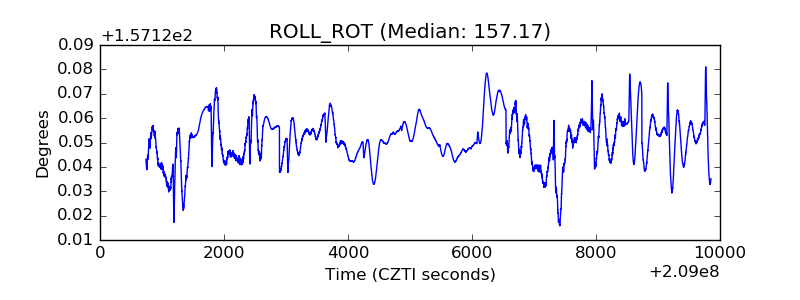 |
| _Roll_DEC | 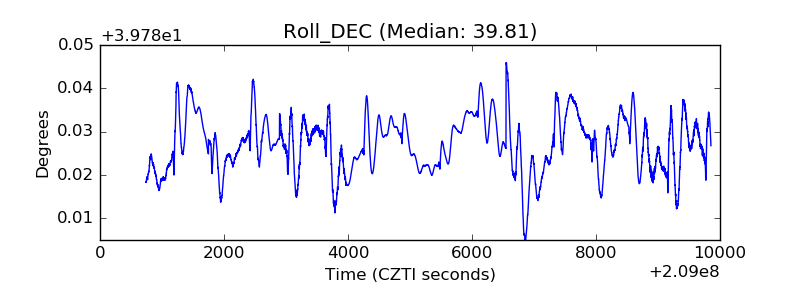 |
| _Roll_RA |  |
| Veto Counter | 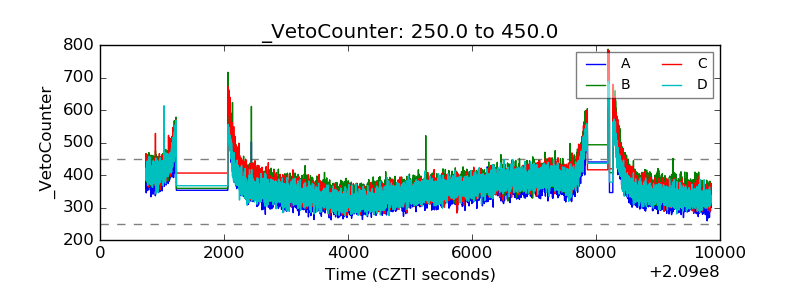 |