| Param | Original file | Final file |
|---|---|---|
| Filename | modeM0/AS1G05_218T05_9000000602_04781cztM0_level2.evt | modeM0/AS1G05_218T05_9000000602_04781cztM0_level2_quad_clean.evt |
| Size (bytes) | 369,694,080 | 42,347,520 |
| Size | 352.6 MB | 40.4 MB |
| Events in quadrant A | 2,179,997 | 248,032 |
| Events in quadrant B | 2,150,290 | 248,490 |
| Events in quadrant C | 2,557,158 | 236,666 |
| Events in quadrant D | 4,000,328 | 229,748 |
| Mode SS | |||
|---|---|---|---|
| Quadrant | BADHDUFLAG | Total packets | Discarded packets |
| A | 0 | 92 | 0 |
| B | 0 | 92 | 0 |
| C | 0 | 92 | 0 |
| D | 0 | 92 | 0 |
| Mode M0 | |||
|---|---|---|---|
| Quadrant | BADHDUFLAG | Total packets | Discarded packets |
| A | 0 | 9602 | 2 |
| B | 0 | 9503 | 2 |
| C | 0 | 10952 | 2 |
| D | 0 | 15074 | 8 |
| Quadrant | Total seconds | Saturated seconds | Saturation percentage |
|---|---|---|---|
| A | 4526 | 79 | 1.745471% |
| B | 4526 | 51 | 1.126823% |
| C | 4526 | 233 | 5.148034% |
| D | 4526 | 176 | 3.888643% |
Noise dominated data is calculated using 1-second bins in cleaned event files. If a bin has >2000 counts, and if more than 50% of those come from <1% of pixels, then it is considered to be noise-dominated and hence unusable.
| Quadrant | # 1 sec bins | Bins with >0 counts | Bins with >2000 counts | High rate bins dominated by noise | Noise dominated (total time) | Noise dominated (detector-on time) | Marked lightcurve |
|---|---|---|---|---|---|---|---|
| A | 4581 | 4527 | 12 | 12 | 0.26% | 0.27% | 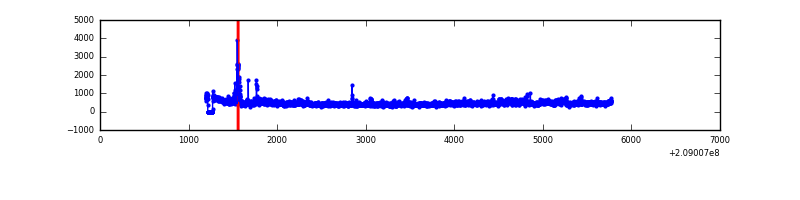 |
| B | 4581 | 4527 | 1 | 1 | 0.02% | 0.02% | 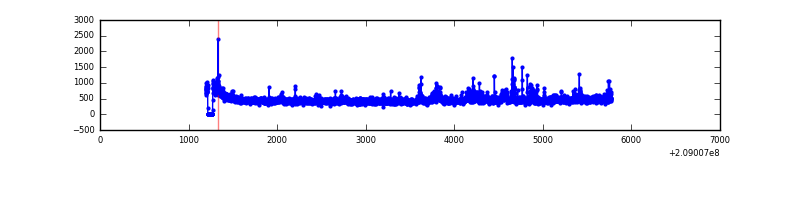 |
| C | 4581 | 4527 | 143 | 143 | 3.12% | 3.16% | 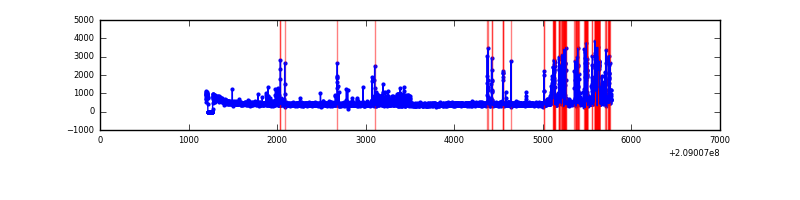 |
| D | 4582 | 4528 | 176 | 176 | 3.84% | 3.89% | 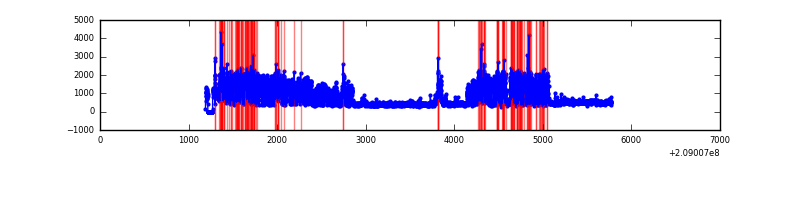 |
Top three noisy pixels from each quadrant. If the there are fewer than three noisy pixels in the level2.evt file, extra rows are filled as -1
| Pixel properties | Quadrant properties | ||||||
|---|---|---|---|---|---|---|---|
| Quadrant | DetID | PixID | Counts | Sigma | Mean | Median | Sigma |
| A | 14 | 111 | 149446 | 1429.99 | 501 | 490 | 104.2 |
| A | 0 | 50 | 75640 | 721.44 | 501 | 490 | 104.2 |
| A | 8 | 15 | 14883 | 138.17 | 501 | 490 | 104.2 |
| B | 14 | 167 | 93084 | 935.99 | 508 | 496 | 98.9 |
| B | 4 | 80 | 54636 | 547.31 | 508 | 496 | 98.9 |
| B | 15 | 204 | 21122 | 208.51 | 508 | 496 | 98.9 |
| C | 14 | 48 | 684338 | 6057.35 | 478 | 480 | 112.9 |
| C | 13 | 61 | 3932 | 30.58 | 478 | 480 | 112.9 |
| C | 7 | 247 | 3239 | 24.44 | 478 | 480 | 112.9 |
| D | 11 | 132 | 1851075 | 15694.57 | 480 | 465 | 117.9 |
| D | 2 | 136 | 138577 | 1171.29 | 480 | 465 | 117.9 |
| D | 2 | 234 | 111712 | 943.46 | 480 | 465 | 117.9 |
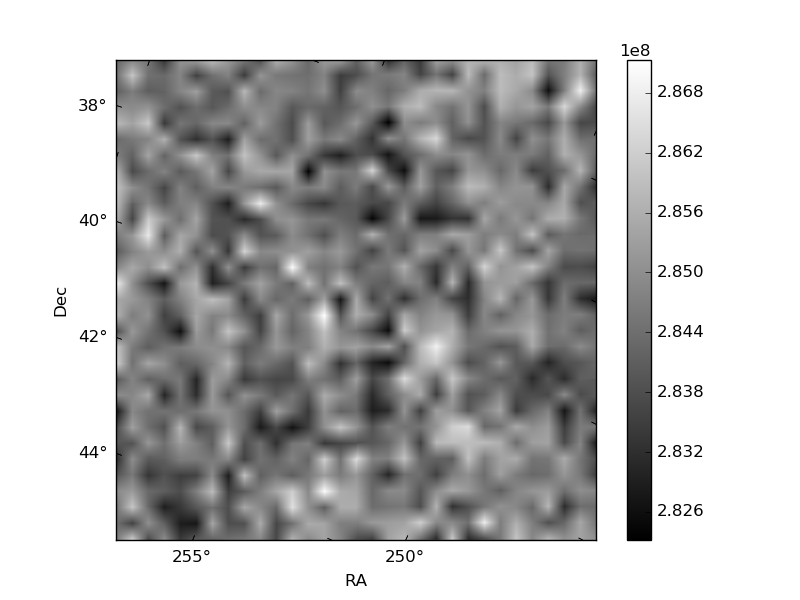
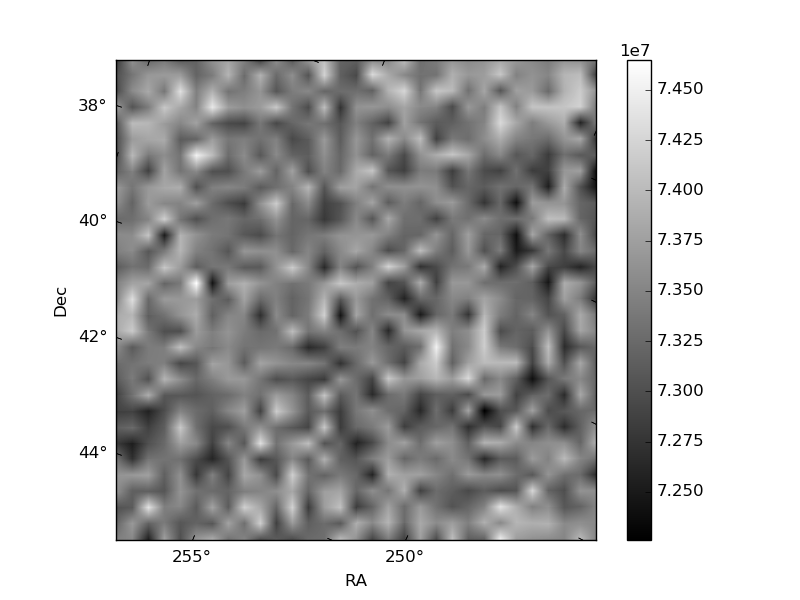
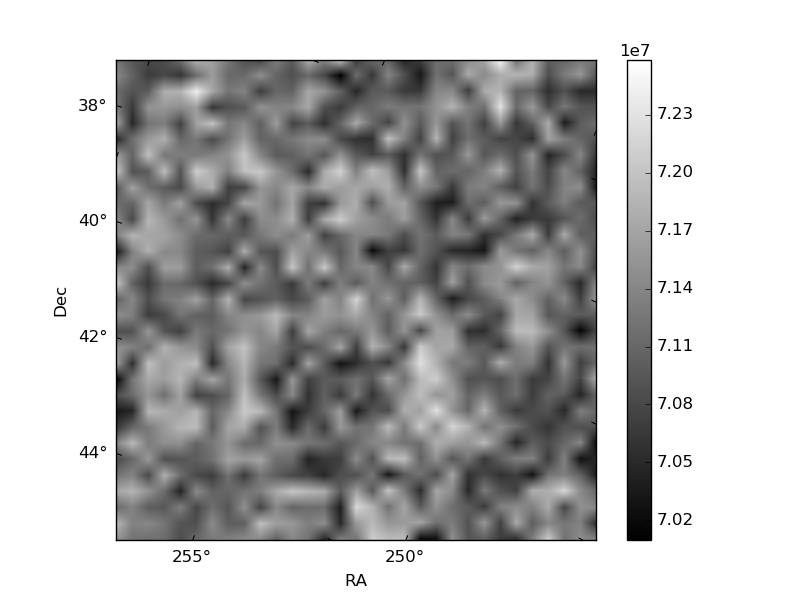
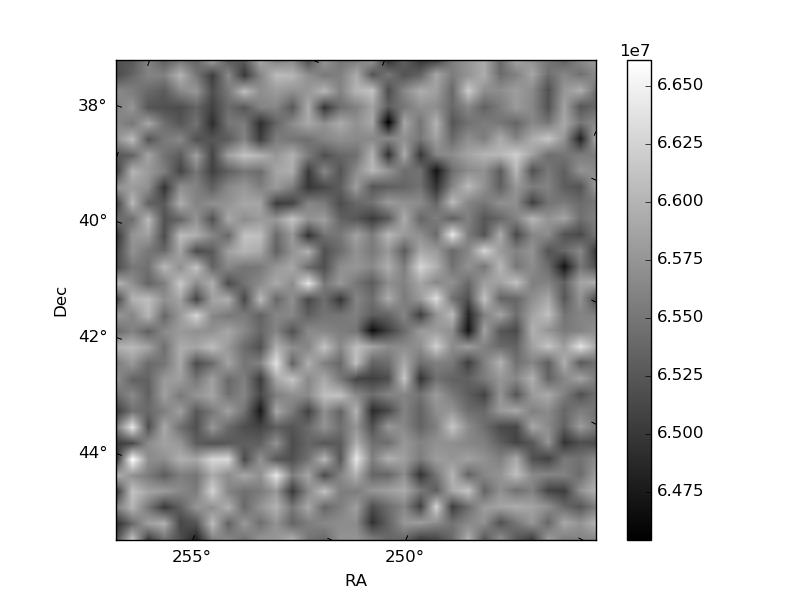
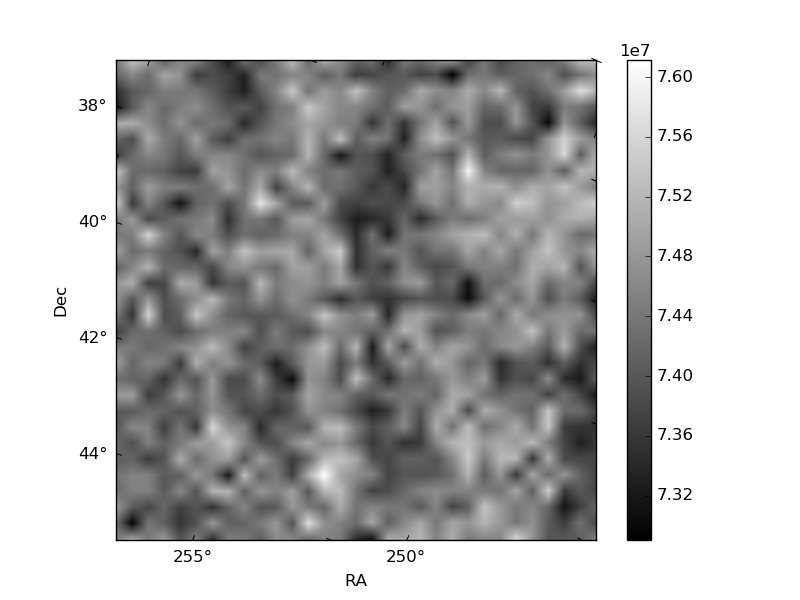
Histogram calculated using DETX and DETY for each event in the final _common_clean file
| Quadrant A | 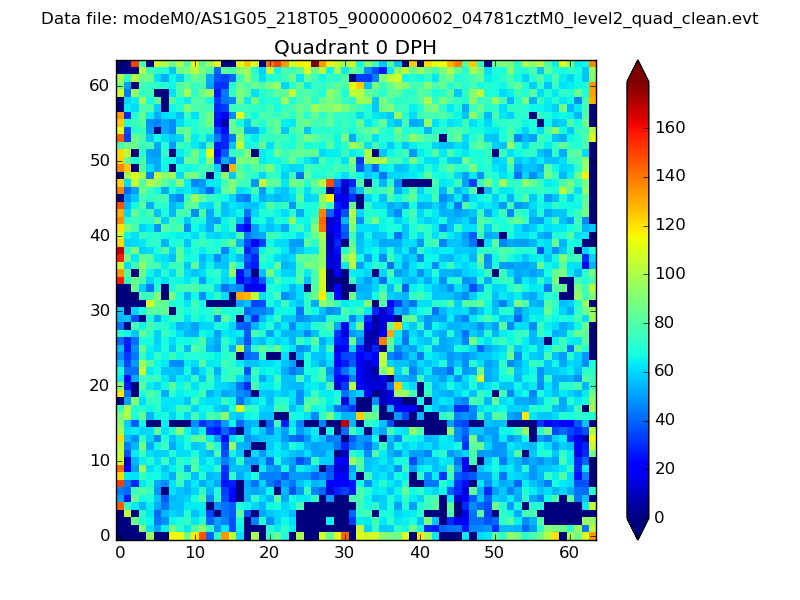 |
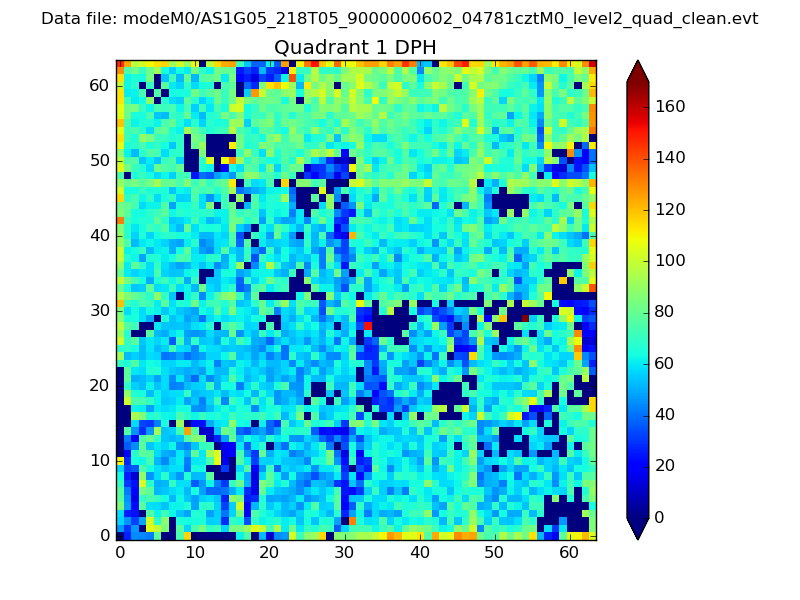 |
Quadrant B |
|---|---|---|---|
| Quadrant D | 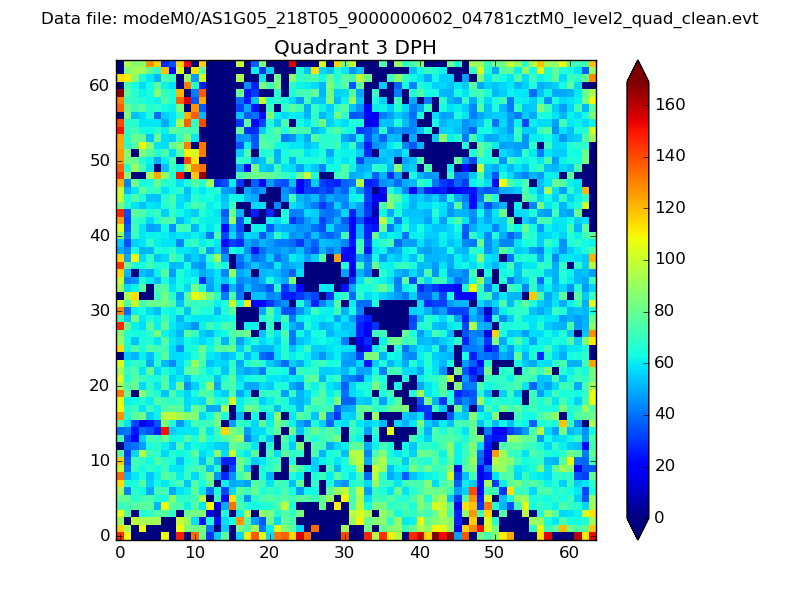 |
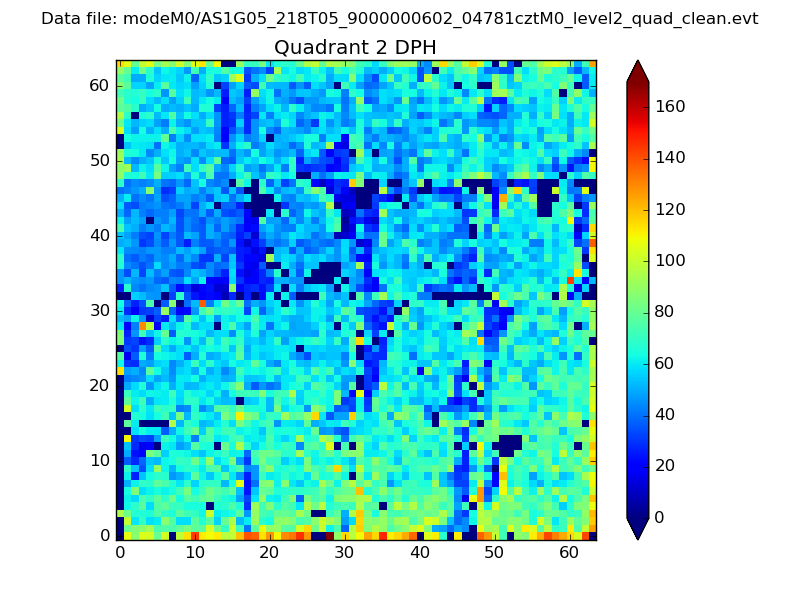 |
Quadrant C |
| Plot type | Count rate plots | Images |
|---|---|---|
| Comparison with Poisson distribution Blue bars denote a histogram of data divided into 1 sec bins. Red curve is a Poisson curve with rate = median count rate of data. |
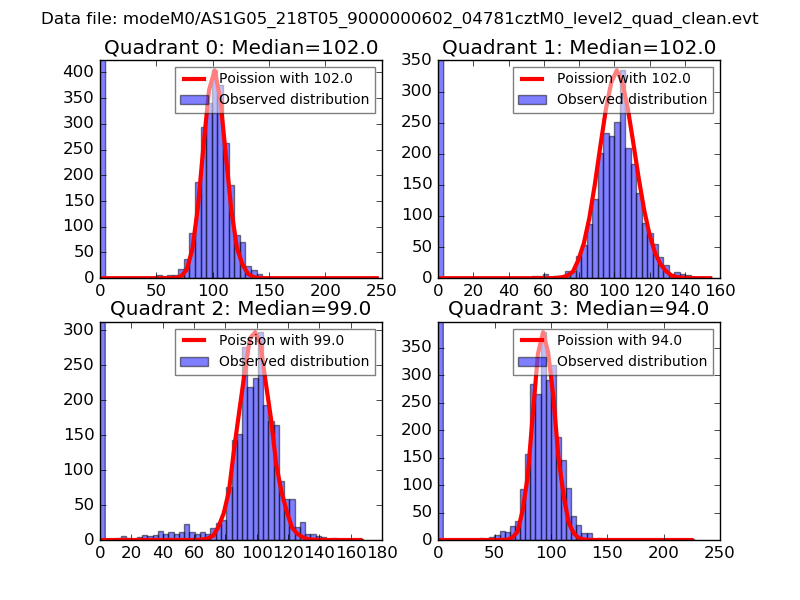 |
 |
| Quadrant-wise count rates Data is divided into 100 sec bins |
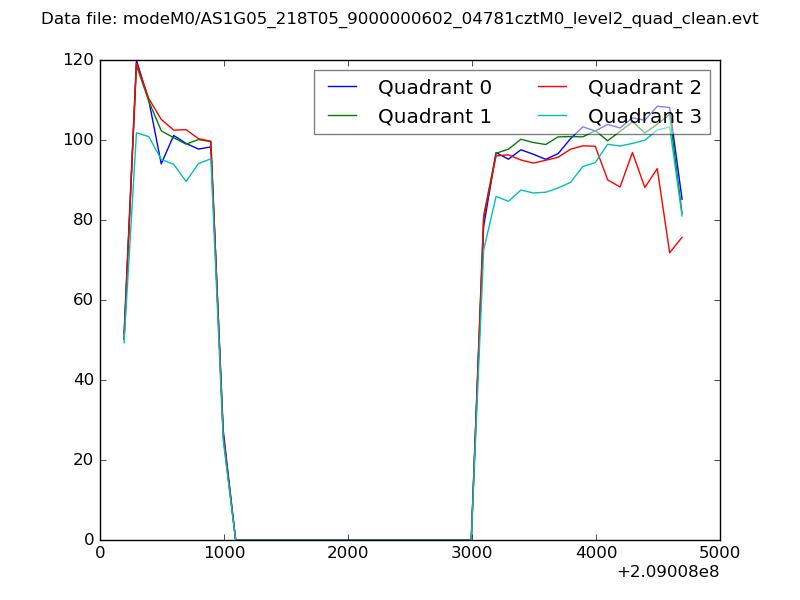 |
|
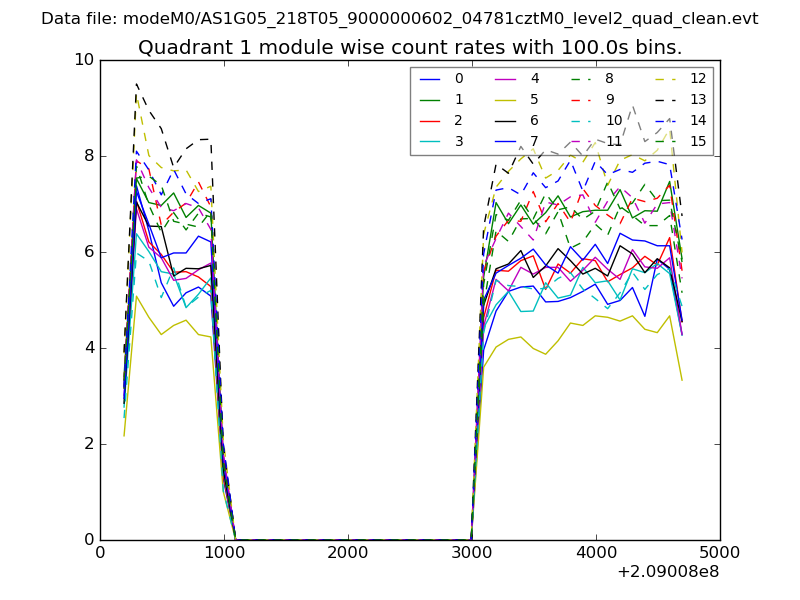
| Module-wise count rates for Quadrant A Data is divided into 100 sec bins |
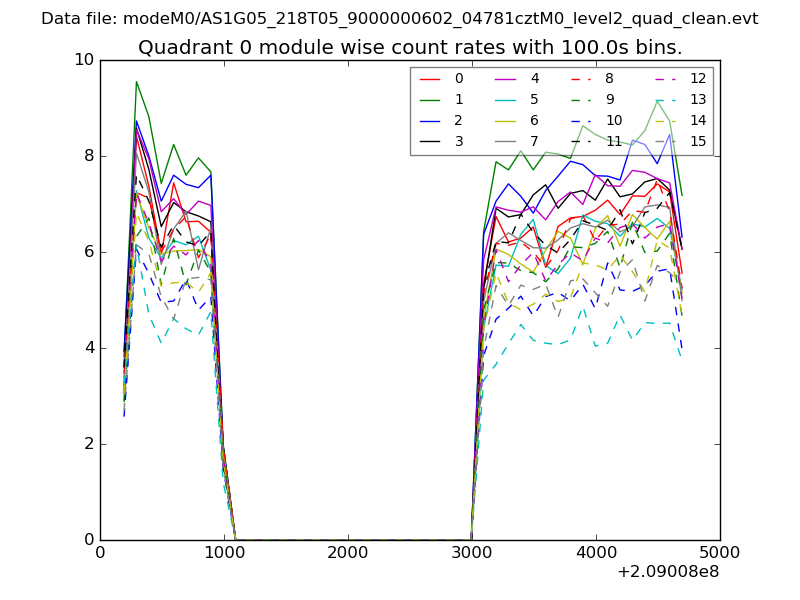 |
 |
| Module-wise count rates for Quadrant B Data is divided into 100 sec bins |
 |
 |
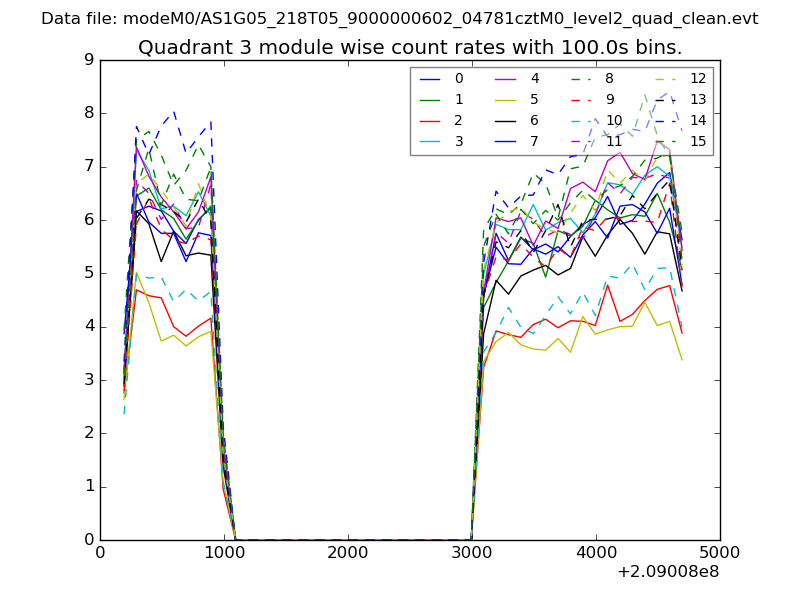
| Module-wise count rates for Quadrant C Data is divided into 100 sec bins |
 |
 |
| Module-wise count rates for Quadrant D Data is divided into 100 sec bins |
 |
 |
| Parameter | Plot |
|---|---|
| CZT HV Monitor | 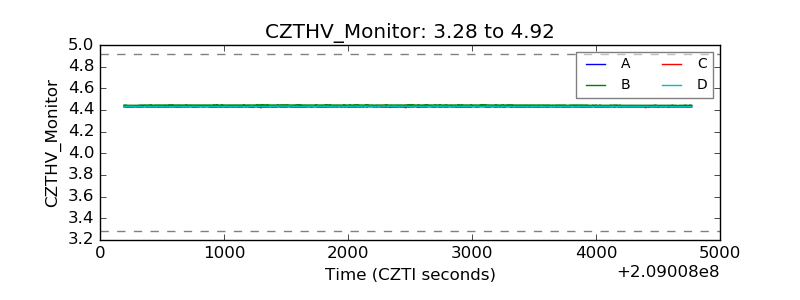 |
| D_VDD | 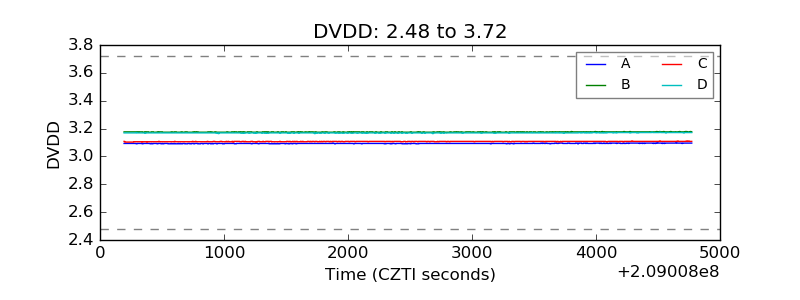 |
| Temperature 1 | 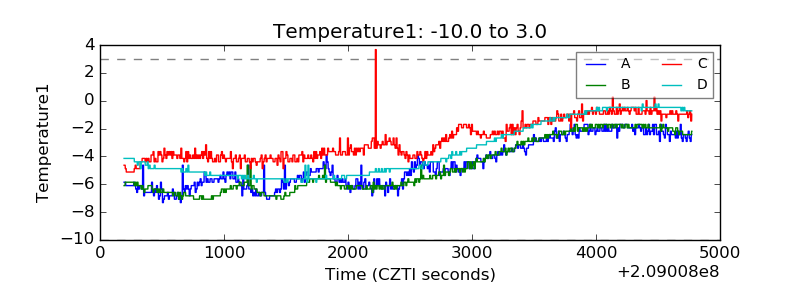 |
| Veto HV Monitor | 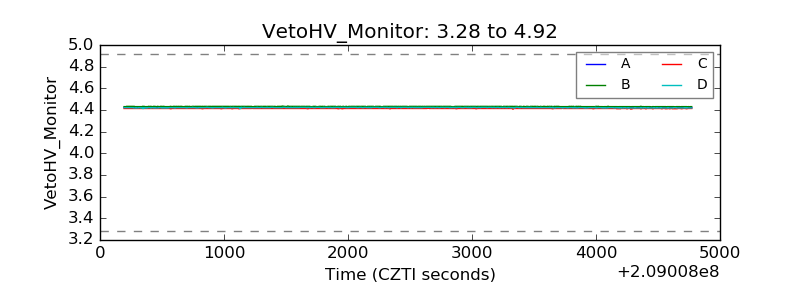 |
| Veto LLD | 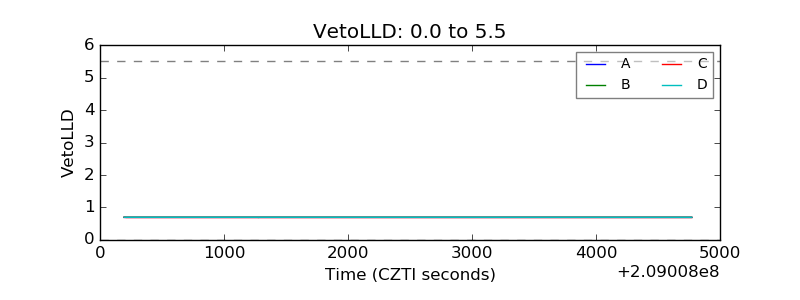 |
| Alpha Counter | 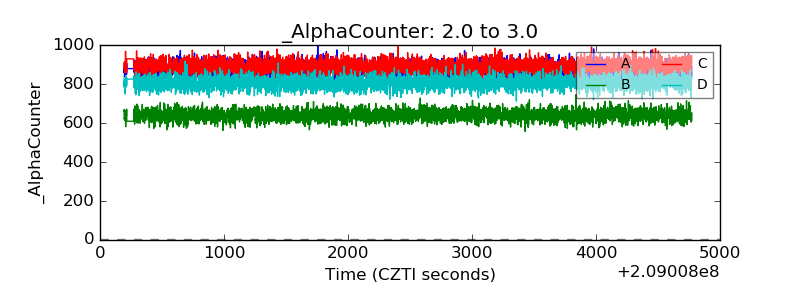 |
| _CPM_Rate | 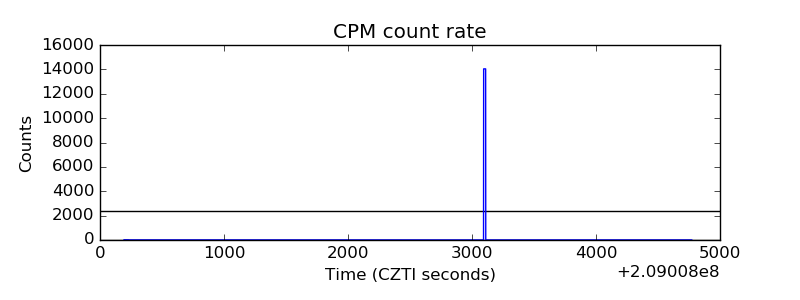 |
| CZT Counter | 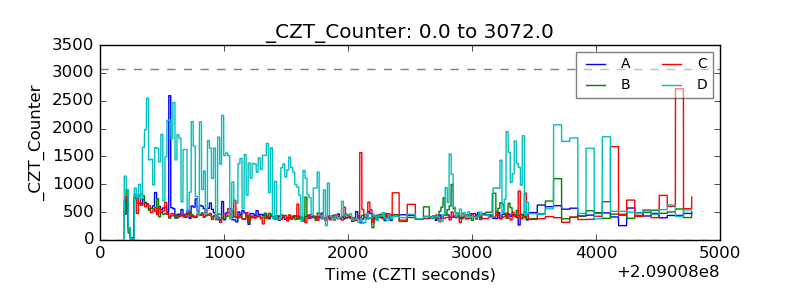 |
| +2.5 Volts monitor | 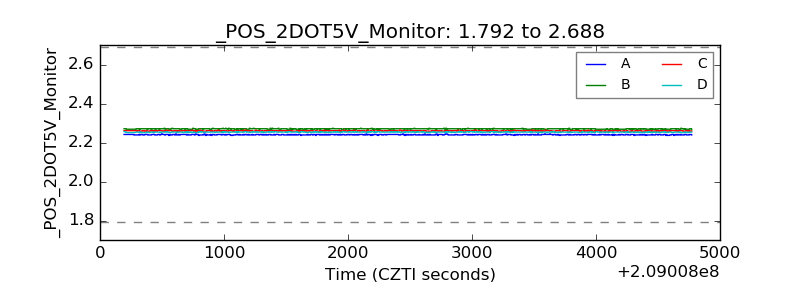 |
| +5 Volts monitor | 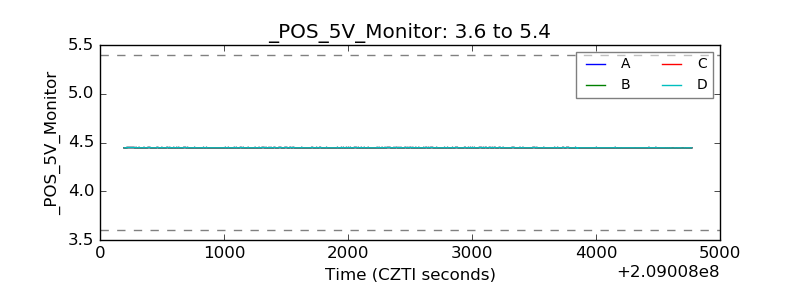 |
| _ROLL_ROT | 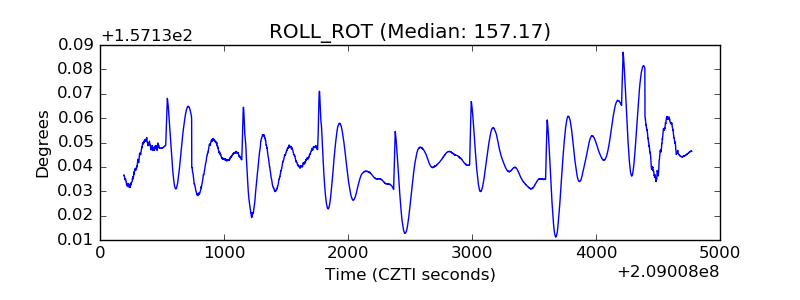 |
| _Roll_DEC | 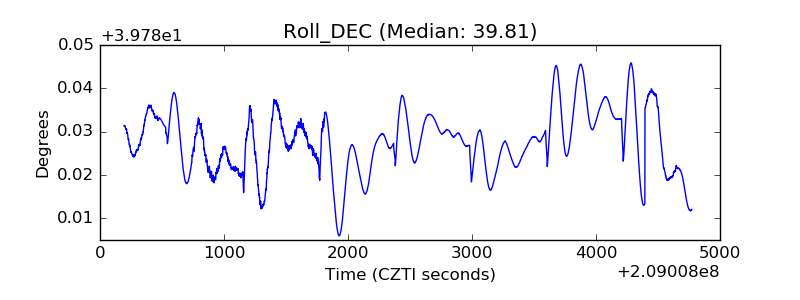 |
| _Roll_RA | 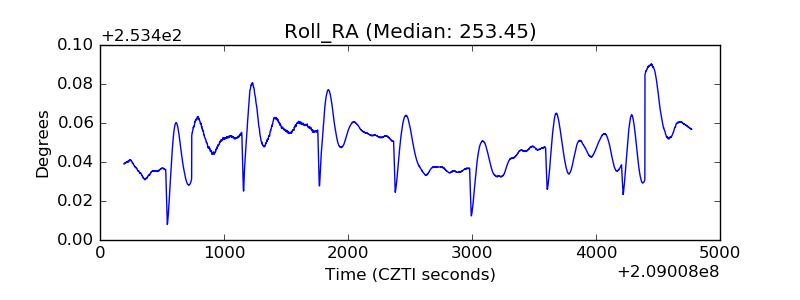 |
| Veto Counter | 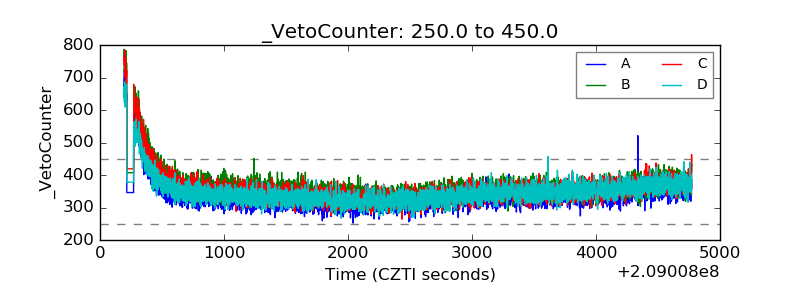 |