| Param | Original file | Final file |
|---|---|---|
| Filename | modeM0/AS1G05_156T09_9000000604_04781cztM0_level2.evt | modeM0/AS1G05_156T09_9000000604_04781cztM0_level2_quad_clean.evt |
| Size (bytes) | 295,113,600 | 23,734,080 |
| Size | 281.4 MB | 22.6 MB |
| Events in quadrant A | 1,416,179 | 138,372 |
| Events in quadrant B | 1,605,269 | 136,119 |
| Events in quadrant C | 2,769,193 | 115,325 |
| Events in quadrant D | 2,951,652 | 124,056 |
| Mode M9 | |||
|---|---|---|---|
| Quadrant | BADHDUFLAG | Total packets | Discarded packets |
| A | 0 | 2 | 0 |
| B | 0 | 2 | 0 |
| C | 0 | 2 | 0 |
| D | 0 | 2 | 0 |
| Mode M0 | |||
|---|---|---|---|
| Quadrant | BADHDUFLAG | Total packets | Discarded packets |
| A | 0 | 6253 | 2 |
| B | 0 | 6621 | 3 |
| C | 0 | 10207 | 3 |
| D | 0 | 10759 | 3 |
| Mode SS | |||
|---|---|---|---|
| Quadrant | BADHDUFLAG | Total packets | Discarded packets |
| A | 0 | 60 | 0 |
| B | 0 | 60 | 0 |
| C | 0 | 60 | 0 |
| D | 0 | 60 | 0 |
| Quadrant | Total seconds | Saturated seconds | Saturation percentage |
|---|---|---|---|
| A | 2851 | 112 | 3.928446% |
| B | 2850 | 114 | 4.000000% |
| C | 2850 | 575 | 20.175439% |
| D | 2850 | 371 | 13.017544% |
Noise dominated data is calculated using 1-second bins in cleaned event files. If a bin has >2000 counts, and if more than 50% of those come from <1% of pixels, then it is considered to be noise-dominated and hence unusable.
| Quadrant | # 1 sec bins | Bins with >0 counts | Bins with >2000 counts | High rate bins dominated by noise | Noise dominated (total time) | Noise dominated (detector-on time) | Marked lightcurve |
|---|---|---|---|---|---|---|---|
| A | 3091 | 2851 | 1 | 1 | 0.03% | 0.04% | 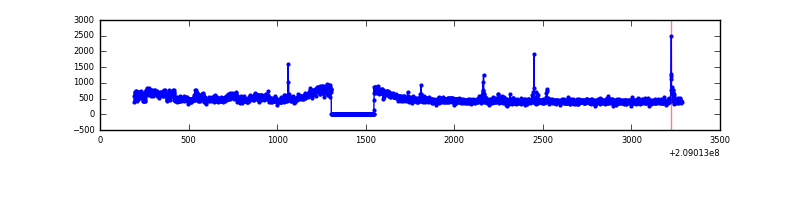 |
| B | 3091 | 2852 | 2 | 2 | 0.06% | 0.07% | 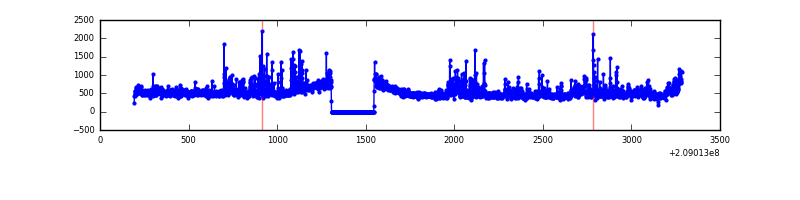 |
| C | 3091 | 2851 | 400 | 400 | 12.94% | 14.03% | 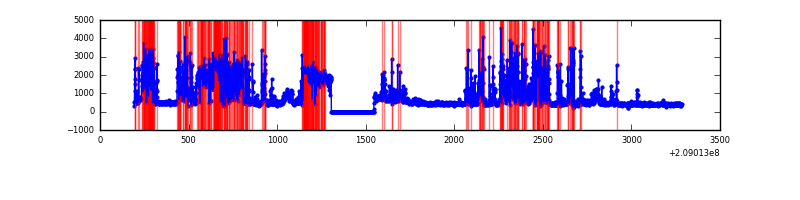 |
| D | 3091 | 2852 | 276 | 276 | 8.93% | 9.68% | 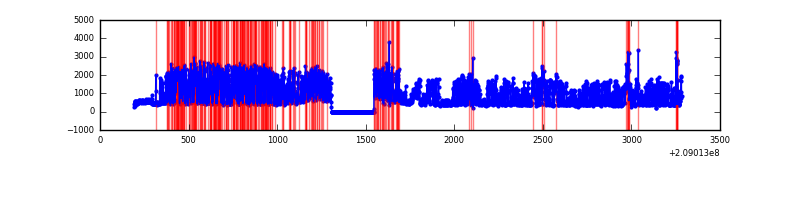 |
Top three noisy pixels from each quadrant. If the there are fewer than three noisy pixels in the level2.evt file, extra rows are filled as -1
| Pixel properties | Quadrant properties | ||||||
|---|---|---|---|---|---|---|---|
| Quadrant | DetID | PixID | Counts | Sigma | Mean | Median | Sigma |
| A | 14 | 111 | 61151 | 858.35 | 338 | 329 | 70.9 |
| A | 0 | 50 | 22211 | 308.81 | 338 | 329 | 70.9 |
| A | 15 | 14 | 20020 | 277.89 | 338 | 329 | 70.9 |
| B | 4 | 80 | 180260 | 2617.63 | 346 | 336 | 68.7 |
| B | 10 | 16 | 38350 | 553.05 | 346 | 336 | 68.7 |
| B | 14 | 167 | 36077 | 519.98 | 346 | 336 | 68.7 |
| C | 14 | 48 | 1545608 | 21152.9 | 306 | 307 | 73.1 |
| C | 7 | 247 | 12987 | 173.57 | 306 | 307 | 73.1 |
| C | 8 | 128 | 6208 | 80.78 | 306 | 307 | 73.1 |
| D | 11 | 132 | 1539585 | 19443.39 | 320 | 310 | 79.2 |
| D | 2 | 136 | 92526 | 1164.83 | 320 | 310 | 79.2 |
| D | 13 | 235 | 53868 | 676.52 | 320 | 310 | 79.2 |
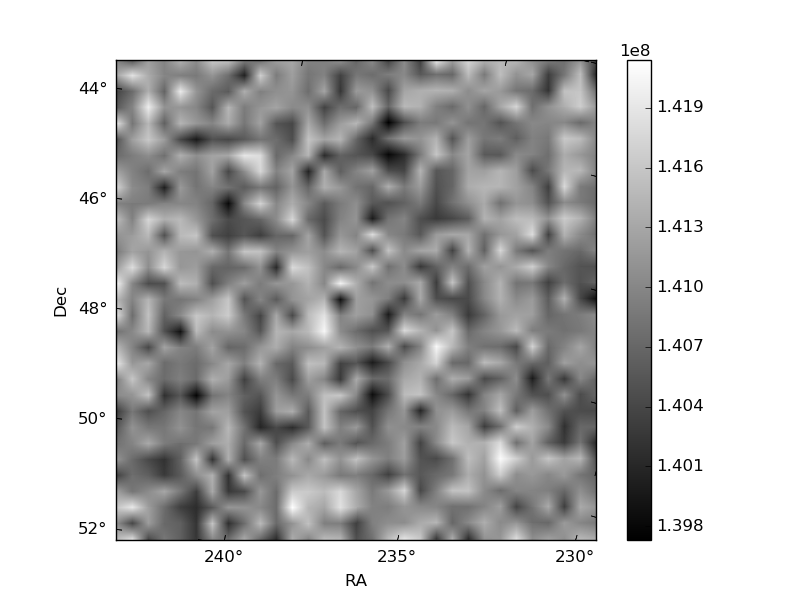
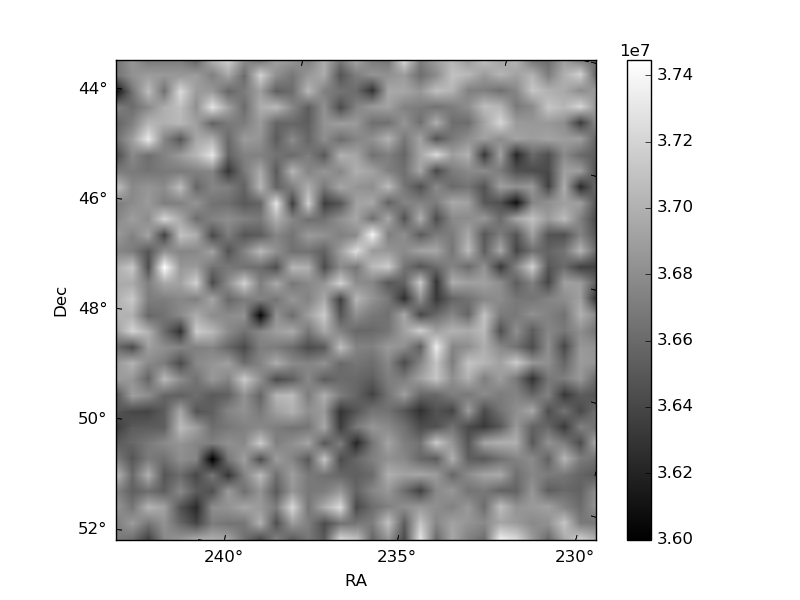
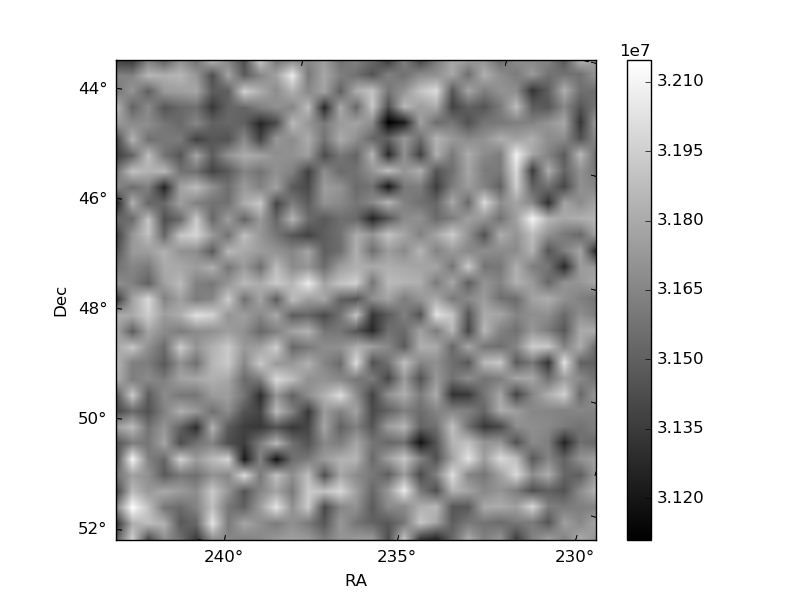
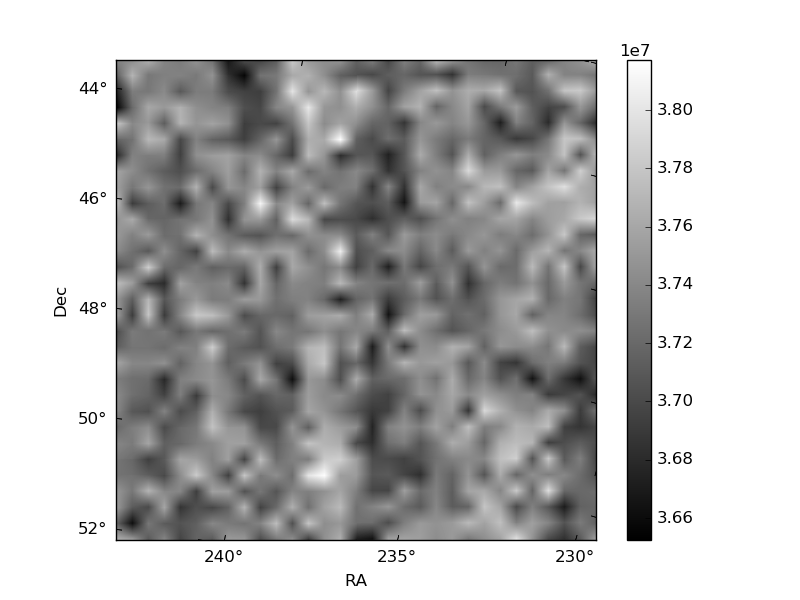
Histogram calculated using DETX and DETY for each event in the final _common_clean file
| Quadrant A | 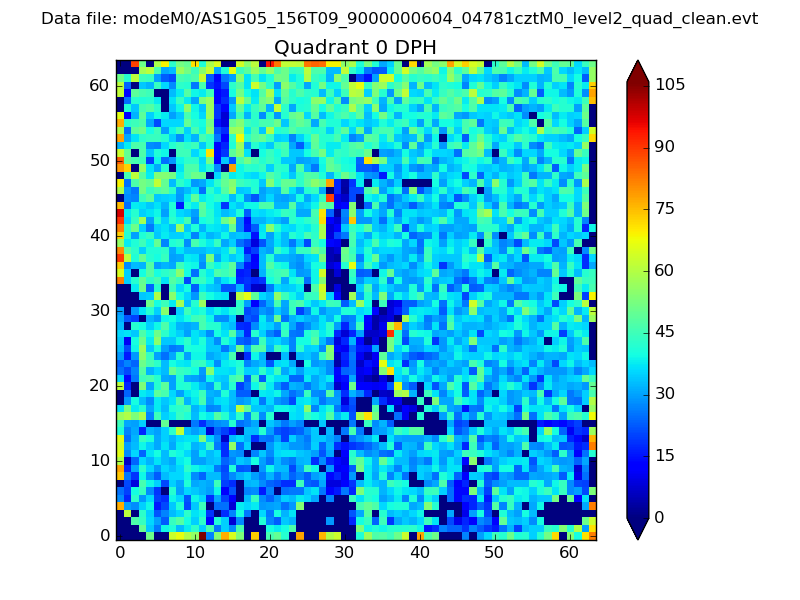 |
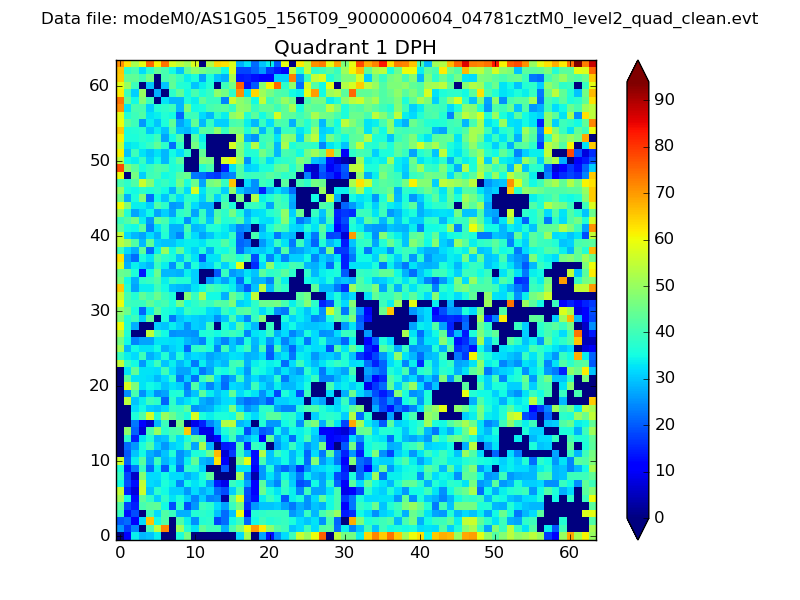 |
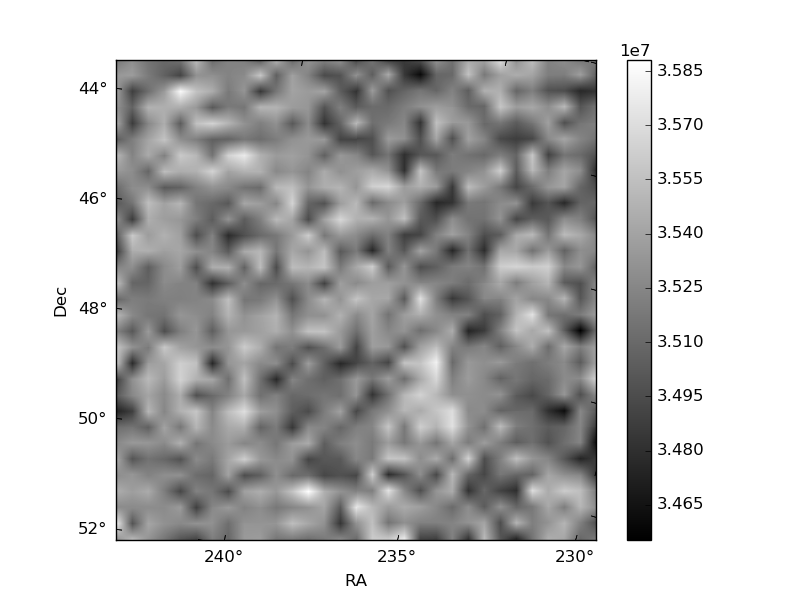
Quadrant B |
|---|---|---|---|
| Quadrant D | 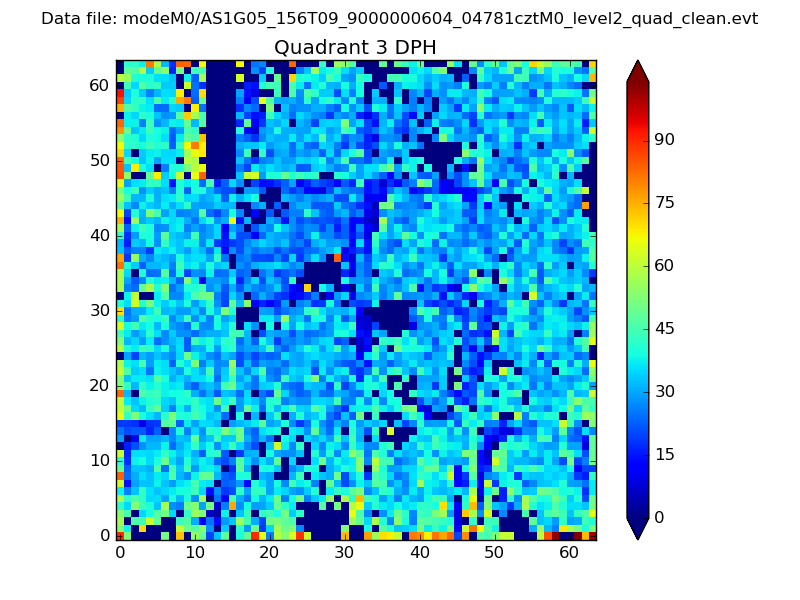 |
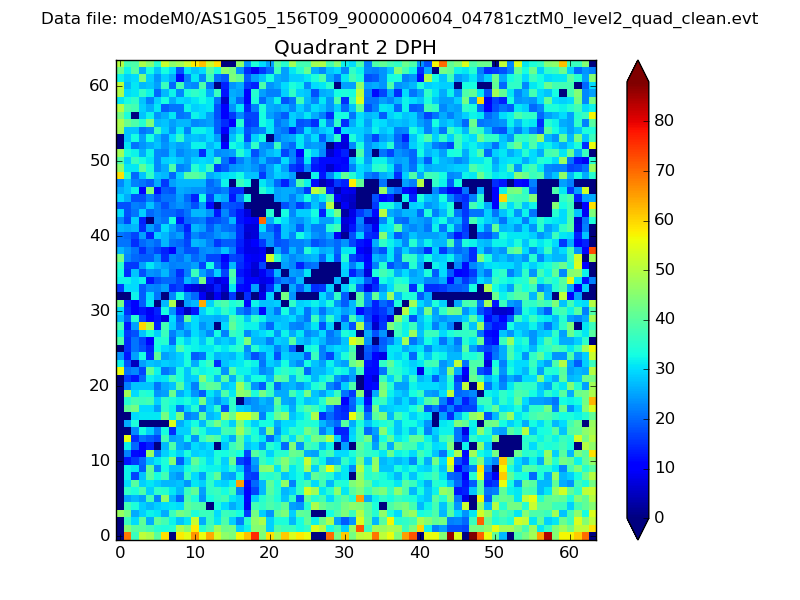 |
Quadrant C |
| Plot type | Count rate plots | Images |
|---|---|---|
| Comparison with Poisson distribution Blue bars denote a histogram of data divided into 1 sec bins. Red curve is a Poisson curve with rate = median count rate of data. |
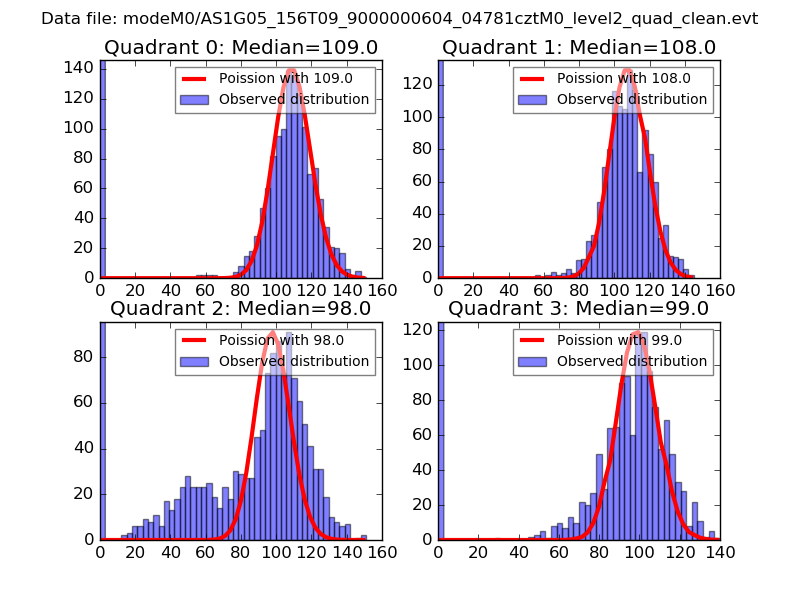 |
 |
| Quadrant-wise count rates Data is divided into 100 sec bins |
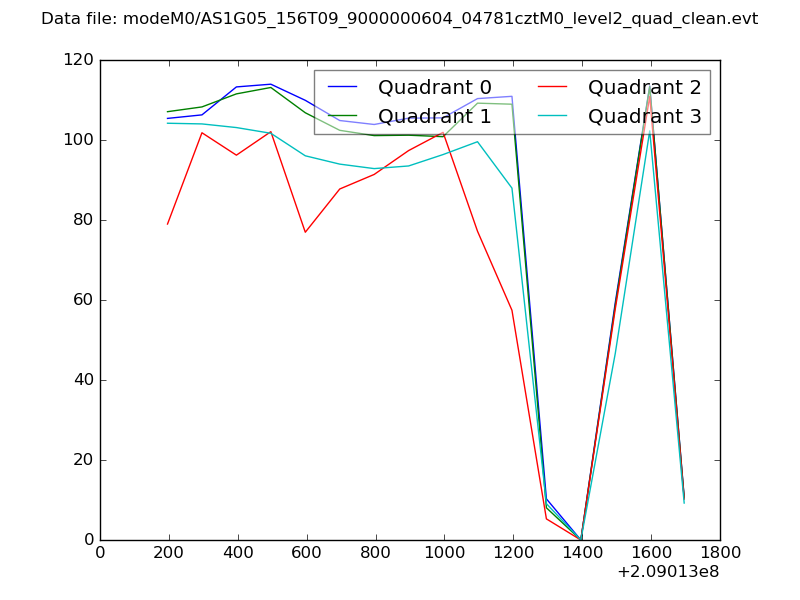 |
|
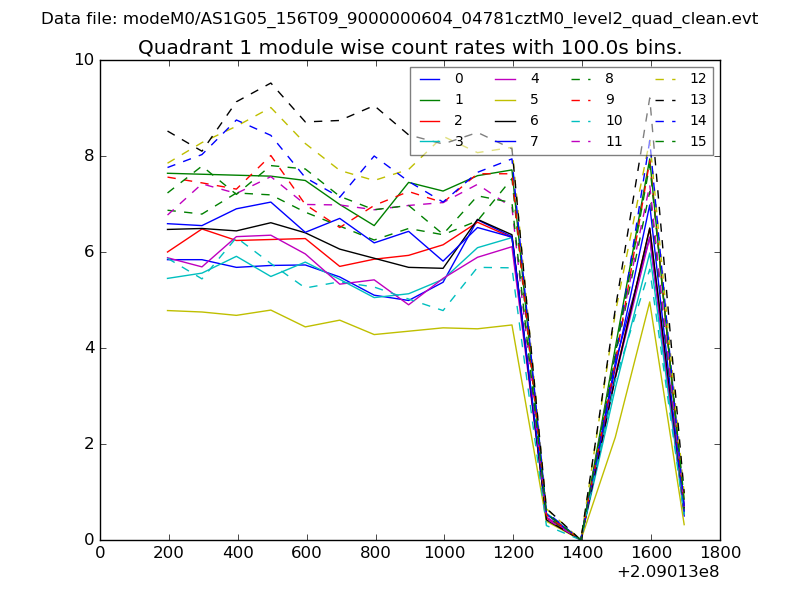
| Module-wise count rates for Quadrant A Data is divided into 100 sec bins |
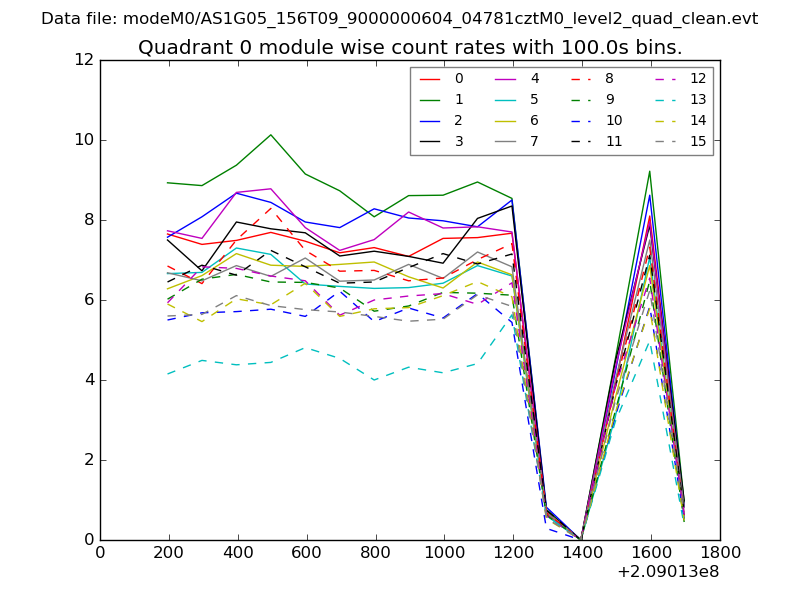 |
 |
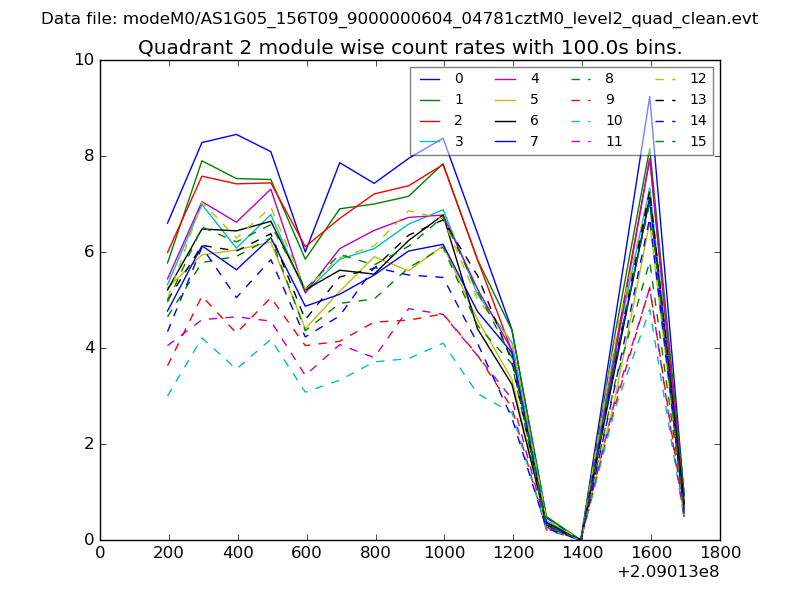
| Module-wise count rates for Quadrant B Data is divided into 100 sec bins |
 |
 |
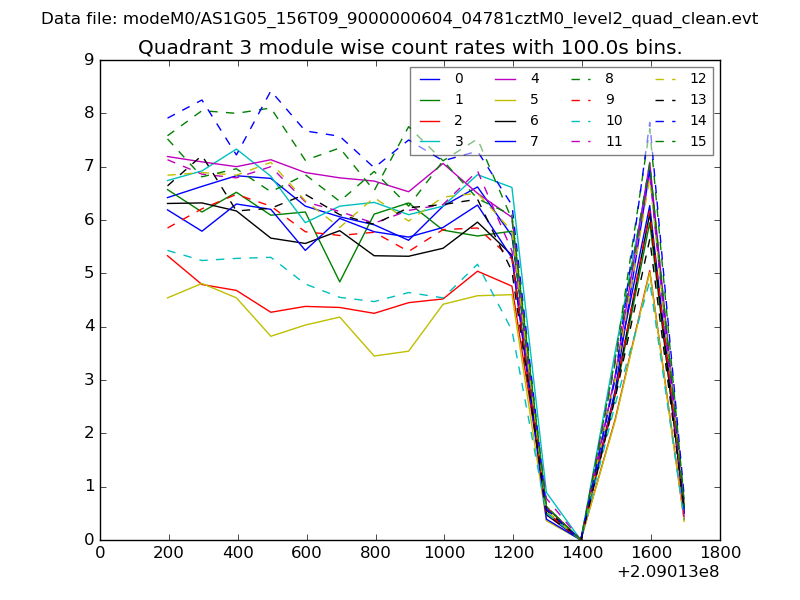
| Module-wise count rates for Quadrant C Data is divided into 100 sec bins |
 |
 |
| Module-wise count rates for Quadrant D Data is divided into 100 sec bins |
 |
 |
| Parameter | Plot |
|---|---|
| CZT HV Monitor | 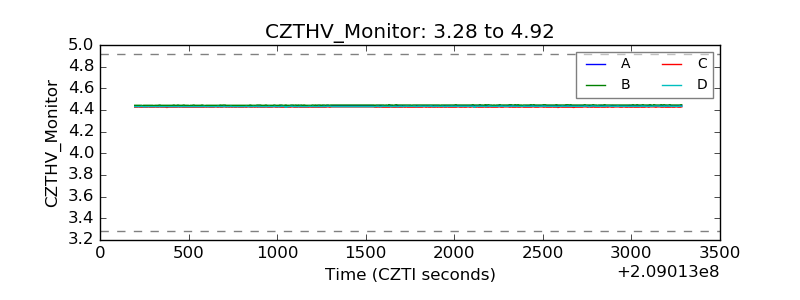 |
| D_VDD | 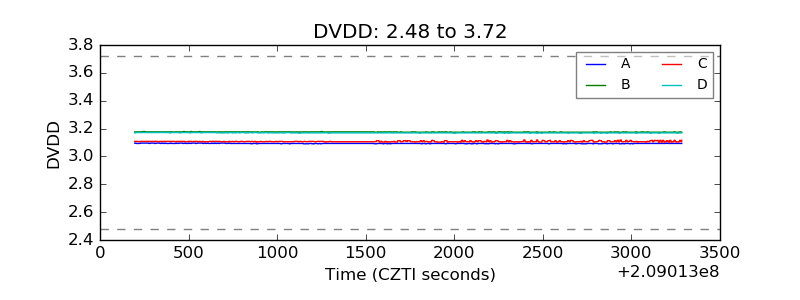 |
| Temperature 1 | 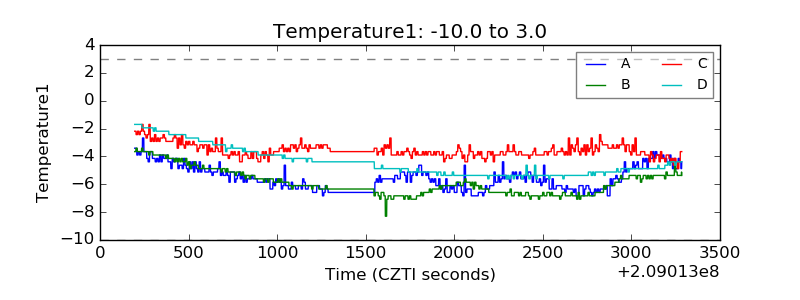 |
| Veto HV Monitor | 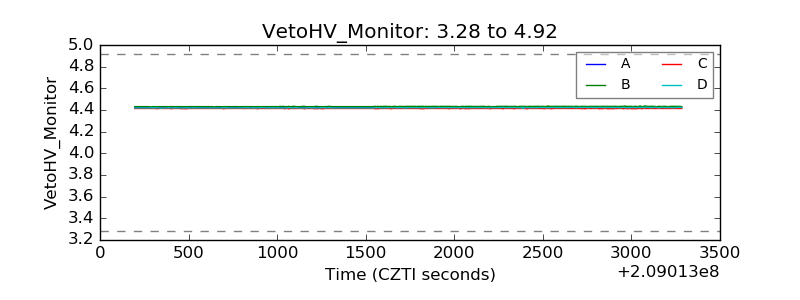 |
| Veto LLD | 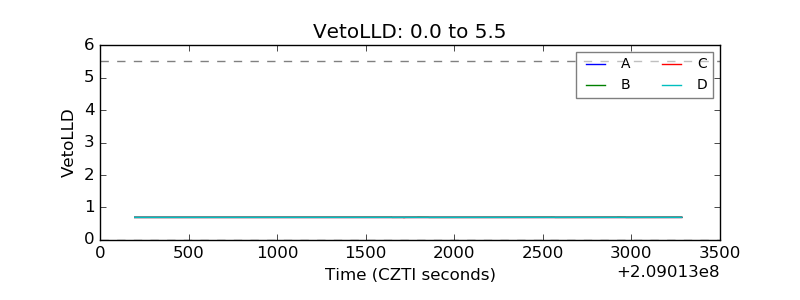 |
| Alpha Counter | 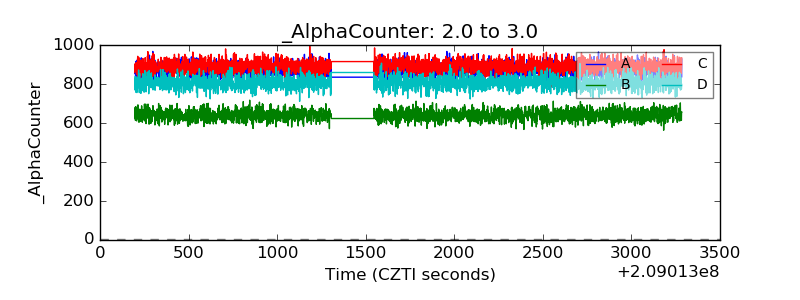 |
| _CPM_Rate | 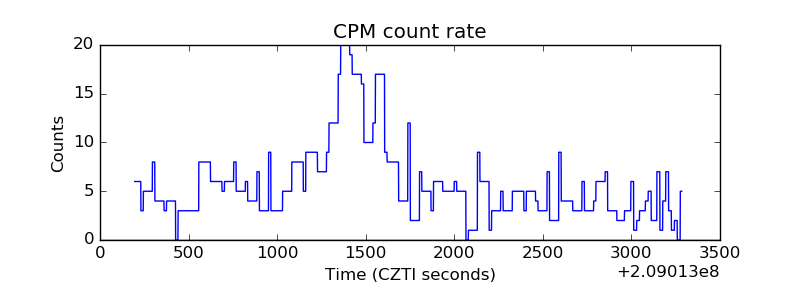 |
| CZT Counter | 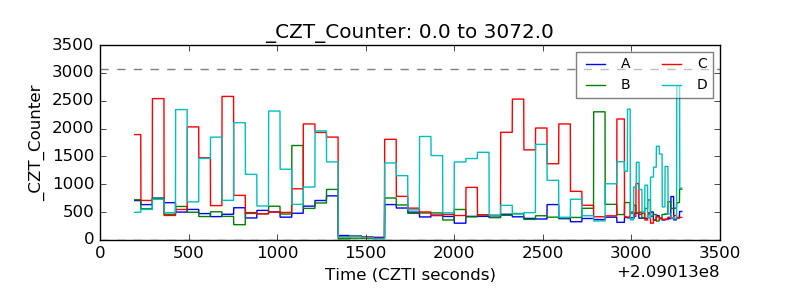 |
| +2.5 Volts monitor | 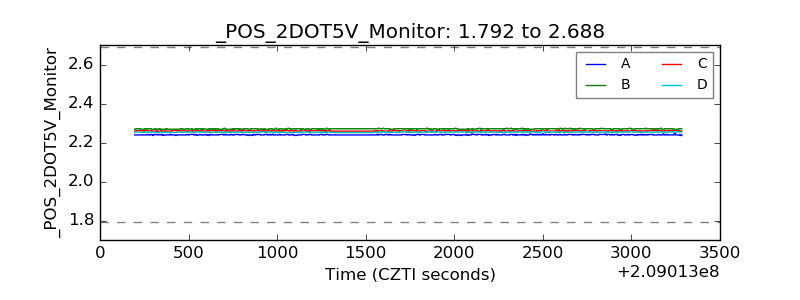 |
| +5 Volts monitor | 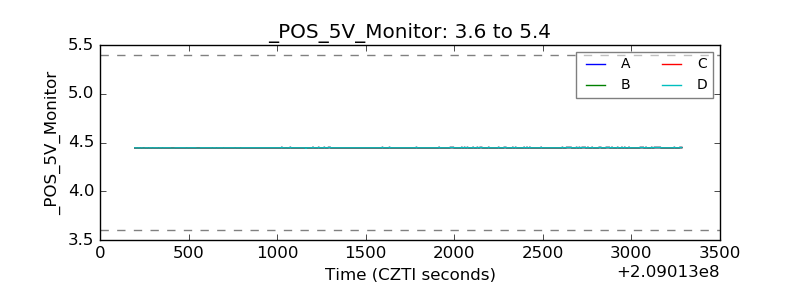 |
| _ROLL_ROT | 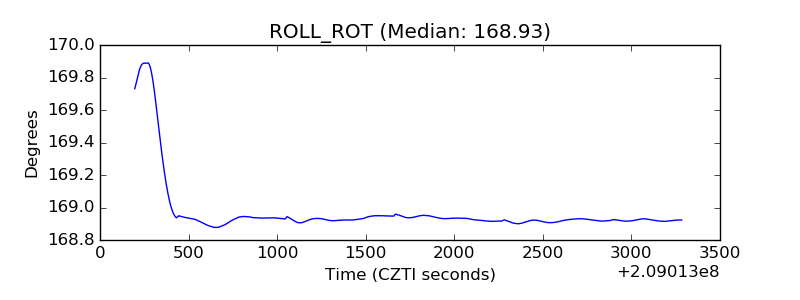 |
| _Roll_DEC | 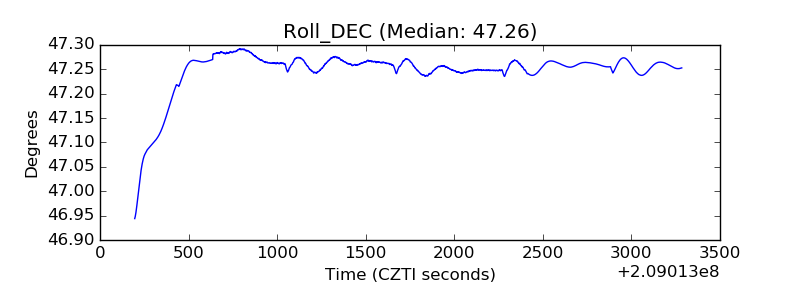 |
| _Roll_RA | 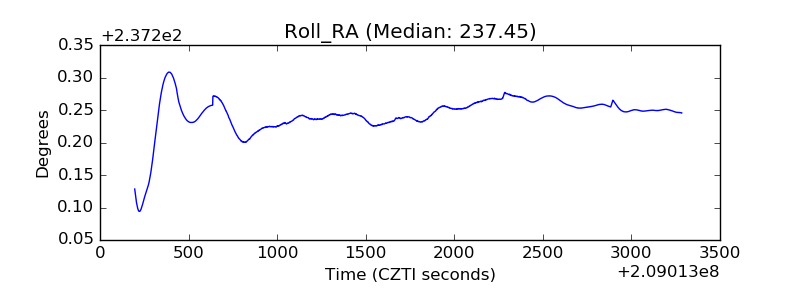 |
| Veto Counter | 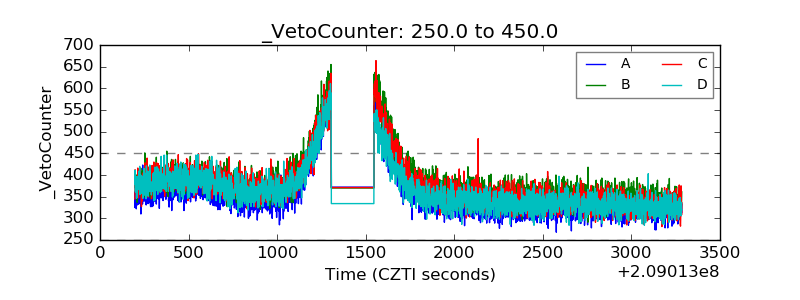 |