| Param | Original file | Final file |
|---|---|---|
| Filename | modeM0/AS1G05_156T09_9000000604_04782cztM0_level2.evt | modeM0/AS1G05_156T09_9000000604_04782cztM0_level2_quad_clean.evt |
| Size (bytes) | 226,895,040 | 23,955,840 |
| Size | 216.4 MB | 22.8 MB |
| Events in quadrant A | 1,337,635 | 163,868 |
| Events in quadrant B | 1,480,060 | 158,485 |
| Events in quadrant C | 1,879,172 | 87,338 |
| Events in quadrant D | 1,987,635 | 120,780 |
| Mode M9 | |||
|---|---|---|---|
| Quadrant | BADHDUFLAG | Total packets | Discarded packets |
| A | 0 | 4 | 4 |
| B | 0 | 6 | 4 |
| C | 0 | 5 | 3 |
| D | 0 | 4 | 3 |
| Mode M0 | |||
|---|---|---|---|
| Quadrant | BADHDUFLAG | Total packets | Discarded packets |
| A | 0 | 13521 | 7458 |
| B | 0 | 14406 | 8082 |
| C | 0 | 26711 | 19461 |
| D | 0 | 22596 | 14929 |
| Mode SS | |||
|---|---|---|---|
| Quadrant | BADHDUFLAG | Total packets | Discarded packets |
| A | 0 | 133 | 68 |
| B | 0 | 134 | 74 |
| C | 0 | 135 | 69 |
| D | 0 | 136 | 78 |
| Quadrant | Total seconds | Saturated seconds | Saturation percentage |
|---|---|---|---|
| A | 2967 | 12 | 0.404449% |
| B | 2922 | 14 | 0.479124% |
| C | 2330 | 340 | 14.592275% |
| D | 2485 | 85 | 3.420523% |
Noise dominated data is calculated using 1-second bins in cleaned event files. If a bin has >2000 counts, and if more than 50% of those come from <1% of pixels, then it is considered to be noise-dominated and hence unusable.
| Quadrant | # 1 sec bins | Bins with >0 counts | Bins with >2000 counts | High rate bins dominated by noise | Noise dominated (total time) | Noise dominated (detector-on time) | Marked lightcurve |
|---|---|---|---|---|---|---|---|
| A | 7167 | 3919 | 1 | 1 | 0.01% | 0.03% | 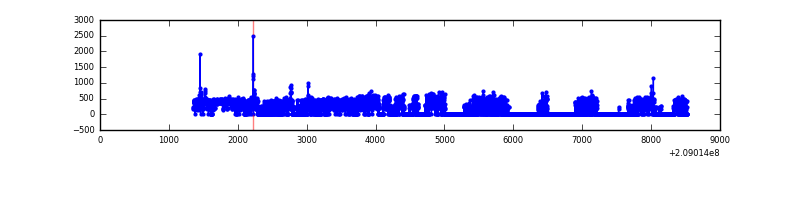 |
| B | 7166 | 3807 | 1 | 1 | 0.01% | 0.03% | 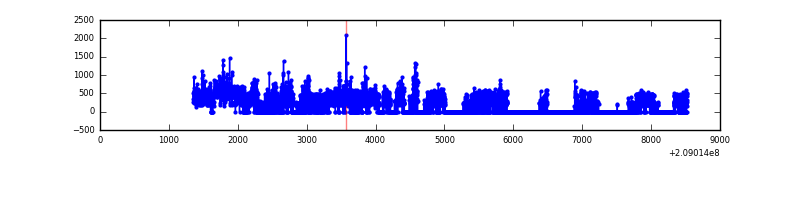 |
| C | 7168 | 3097 | 228 | 228 | 3.18% | 7.36% | 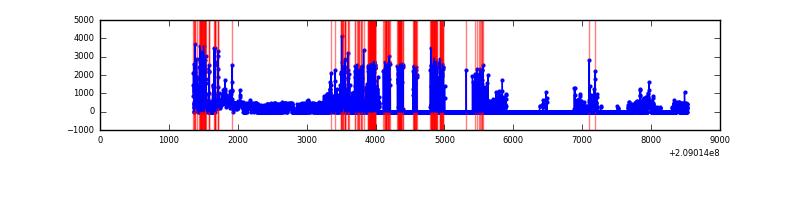 |
| D | 7159 | 3308 | 66 | 66 | 0.92% | 2.00% | 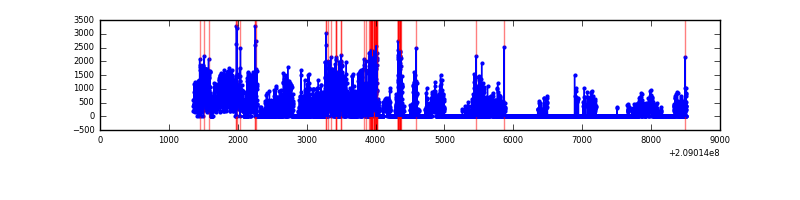 |
Top three noisy pixels from each quadrant. If the there are fewer than three noisy pixels in the level2.evt file, extra rows are filled as -1
| Pixel properties | Quadrant properties | ||||||
|---|---|---|---|---|---|---|---|
| Quadrant | DetID | PixID | Counts | Sigma | Mean | Median | Sigma |
| A | 8 | 15 | 47718 | 697.86 | 326 | 318 | 67.9 |
| A | 0 | 50 | 20436 | 296.19 | 326 | 318 | 67.9 |
| A | 15 | 249 | 5088 | 70.23 | 326 | 318 | 67.9 |
| B | 4 | 80 | 110350 | 1718.29 | 324 | 316 | 64.0 |
| B | 14 | 167 | 50333 | 781.06 | 324 | 316 | 64.0 |
| B | 10 | 16 | 32207 | 498.01 | 324 | 316 | 64.0 |
| C | 14 | 48 | 993541 | 18533.6 | 223 | 224 | 53.6 |
| C | 8 | 128 | 5638 | 101.02 | 223 | 224 | 53.6 |
| C | 8 | 112 | 2425 | 41.07 | 223 | 224 | 53.6 |
| D | 11 | 132 | 872616 | 13583.6 | 260 | 252 | 64.2 |
| D | 2 | 136 | 57801 | 896.1 | 260 | 252 | 64.2 |
| D | 13 | 235 | 41562 | 643.24 | 260 | 252 | 64.2 |
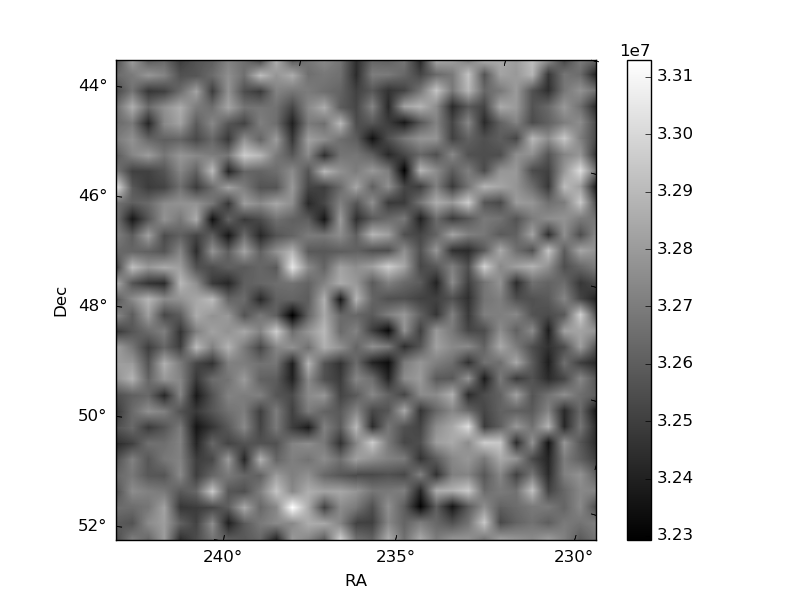
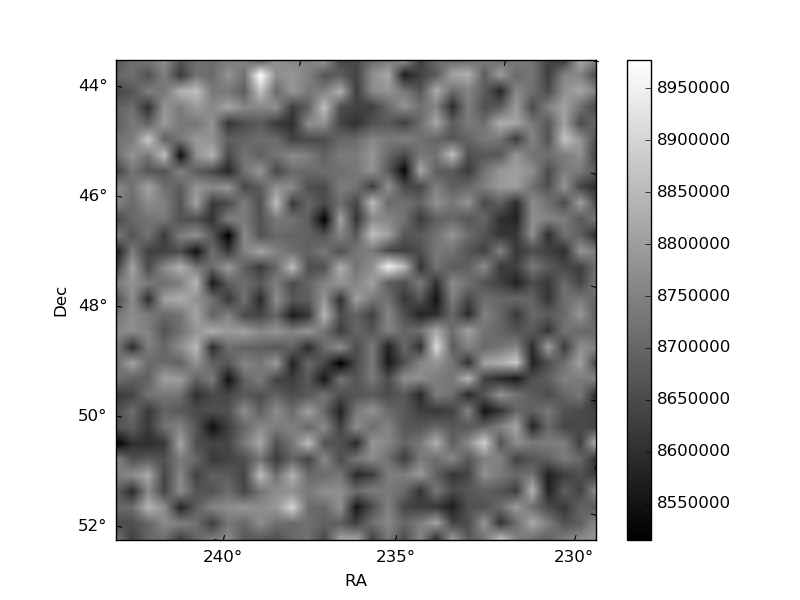
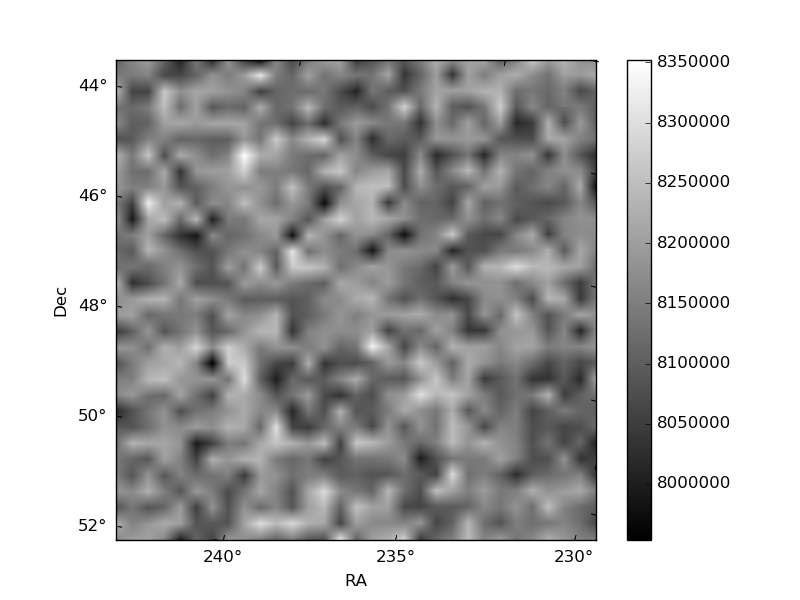
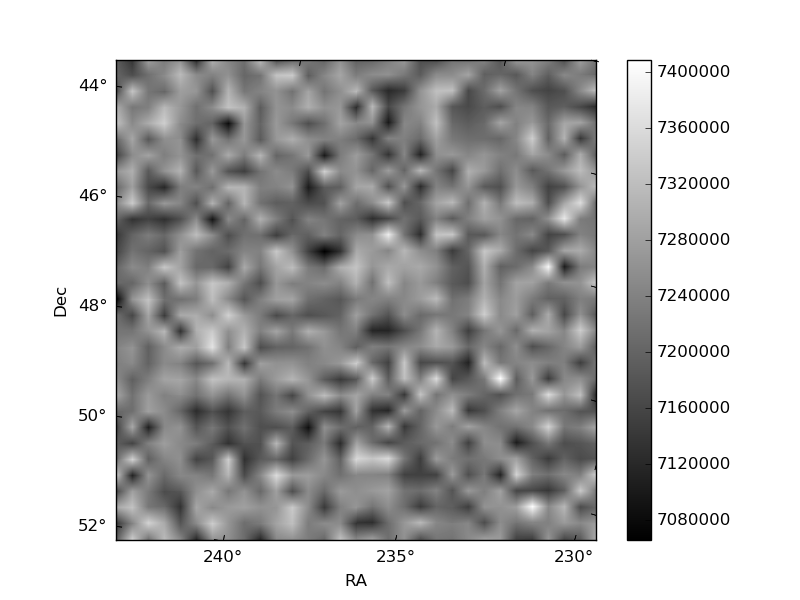
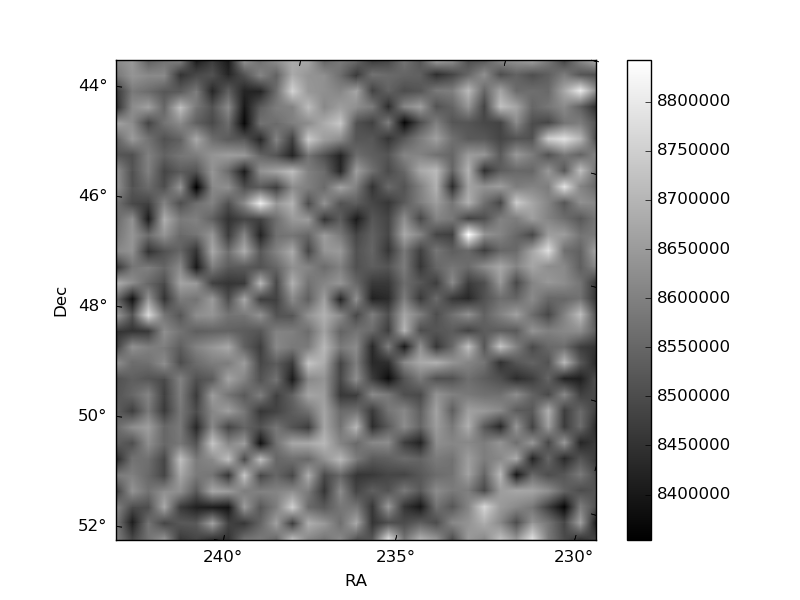
Histogram calculated using DETX and DETY for each event in the final _common_clean file
| Quadrant A | 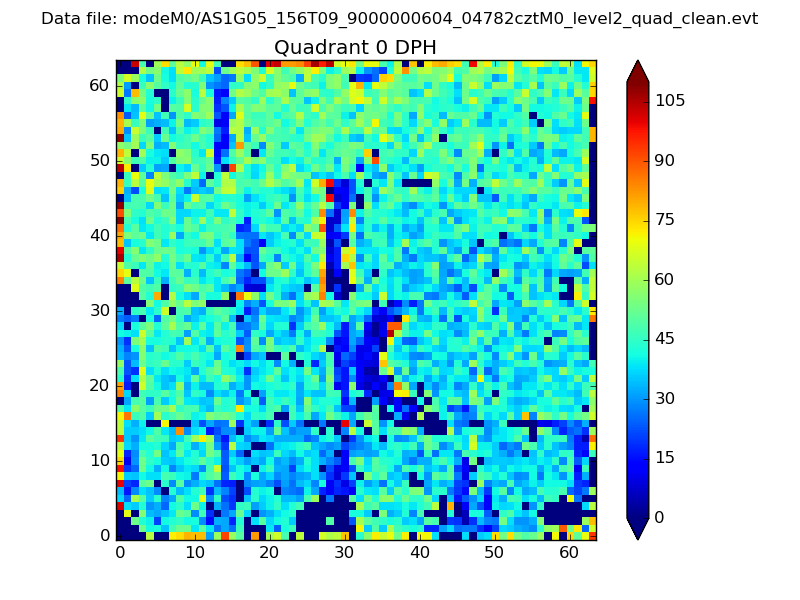 |
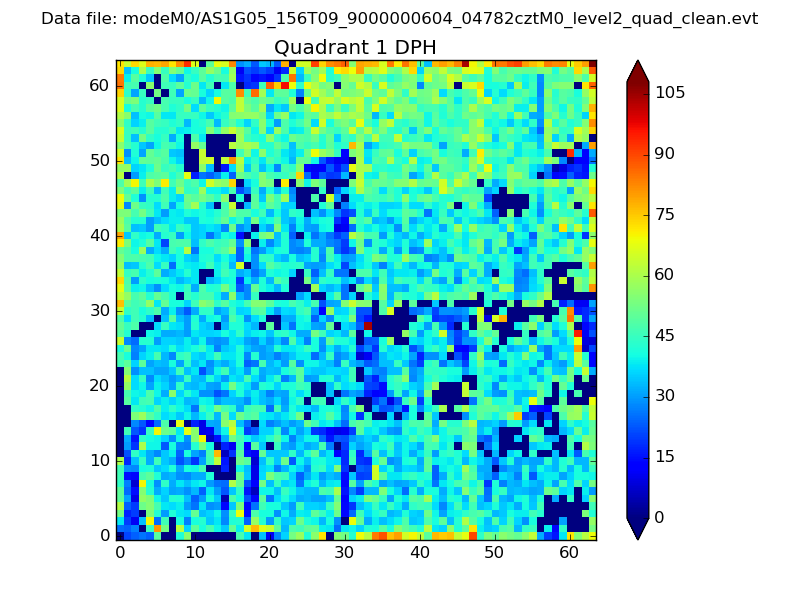 |
Quadrant B |
|---|---|---|---|
| Quadrant D | 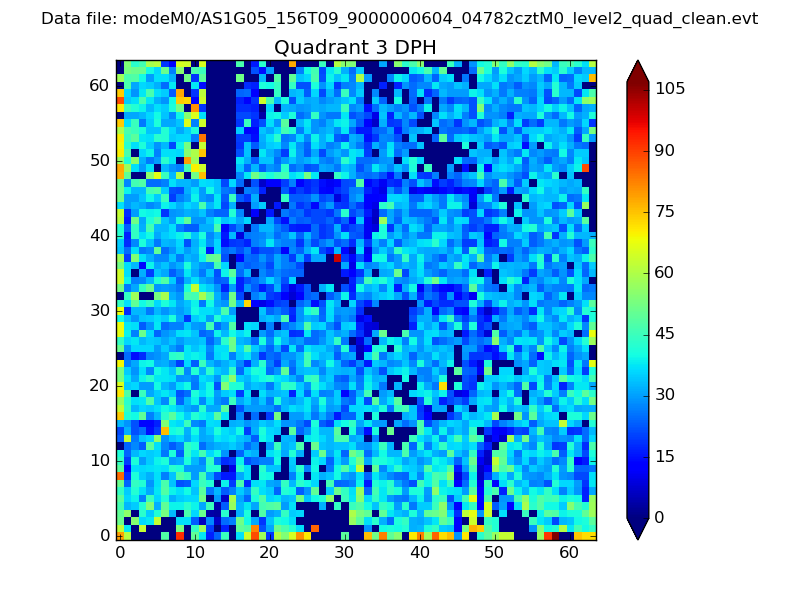 |
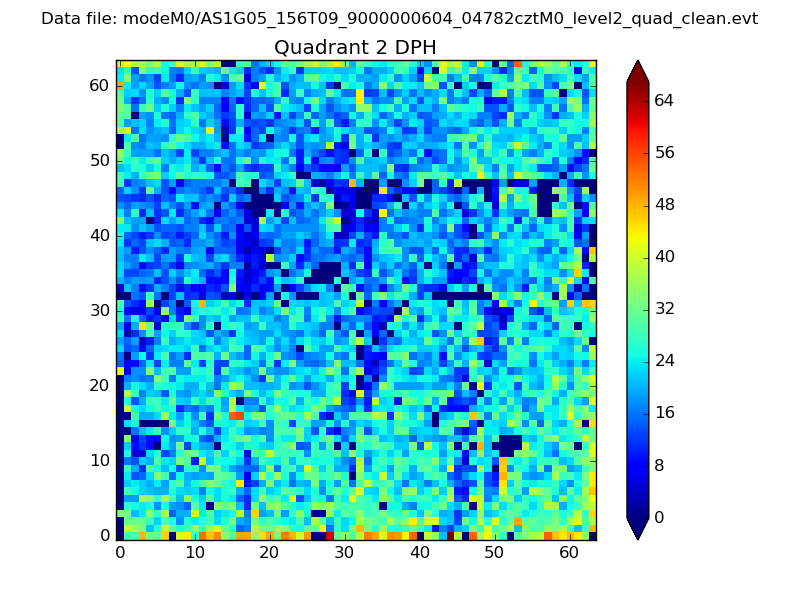 |
Quadrant C |
| Plot type | Count rate plots | Images |
|---|---|---|
| Comparison with Poisson distribution Blue bars denote a histogram of data divided into 1 sec bins. Red curve is a Poisson curve with rate = median count rate of data. |
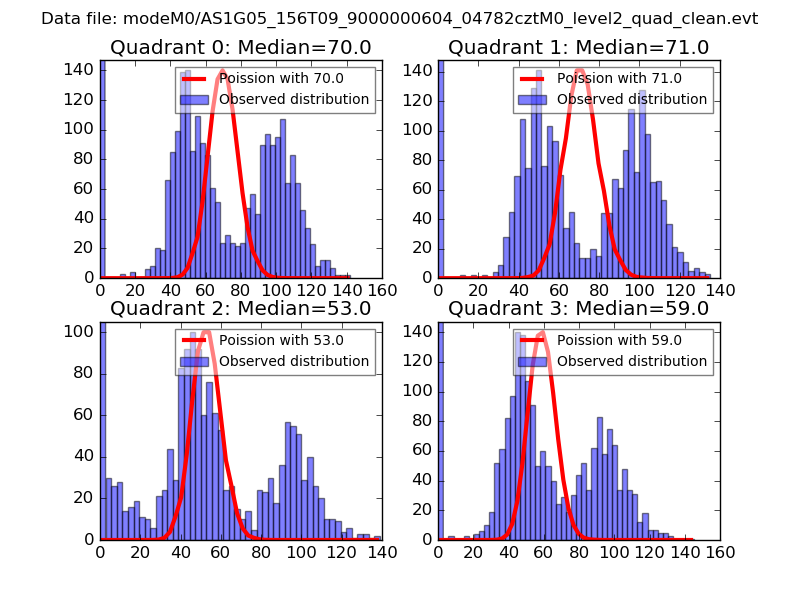 |
 |
| Quadrant-wise count rates Data is divided into 100 sec bins |
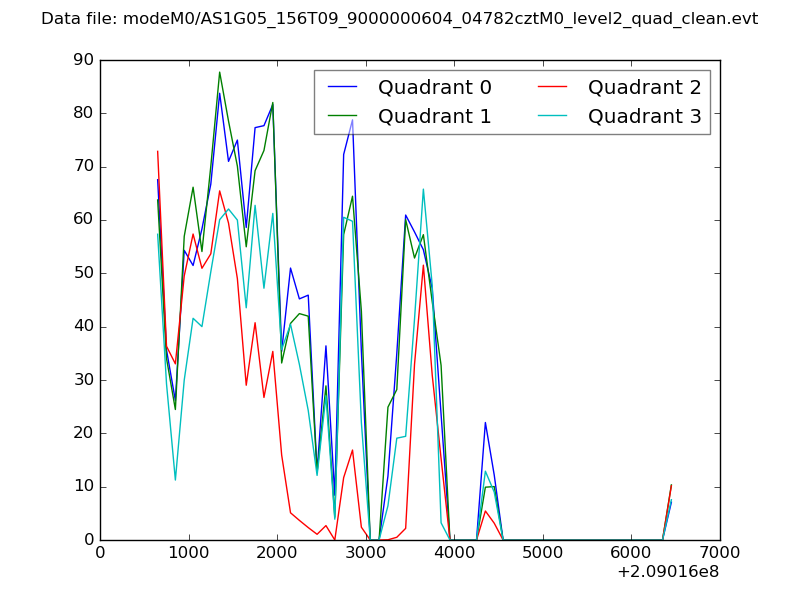 |
|
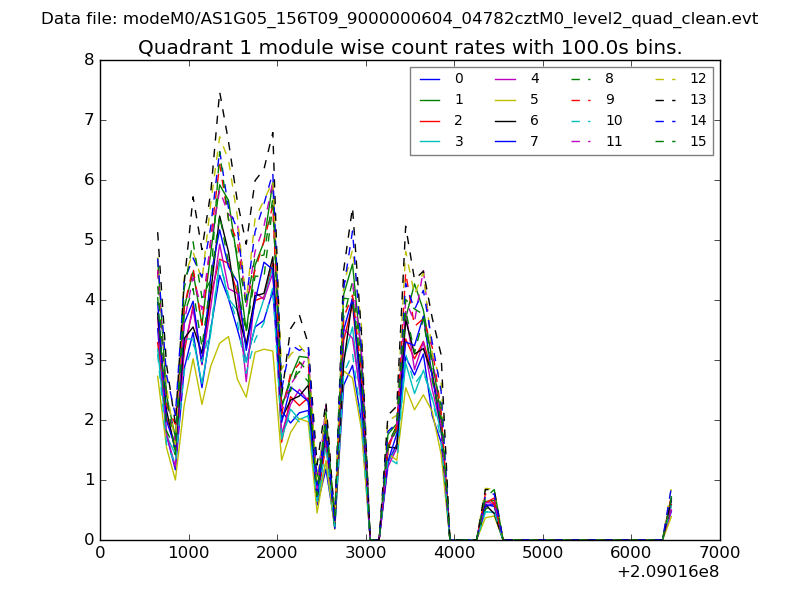
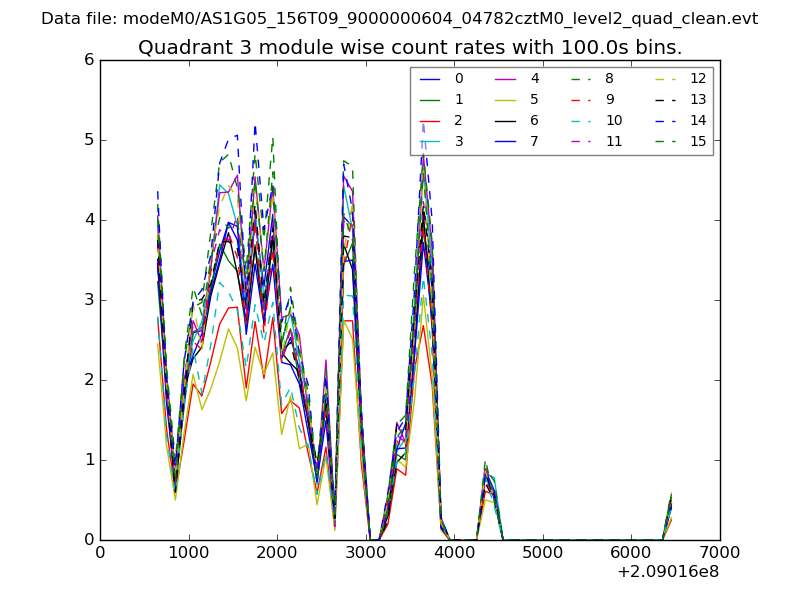
| Module-wise count rates for Quadrant A Data is divided into 100 sec bins |
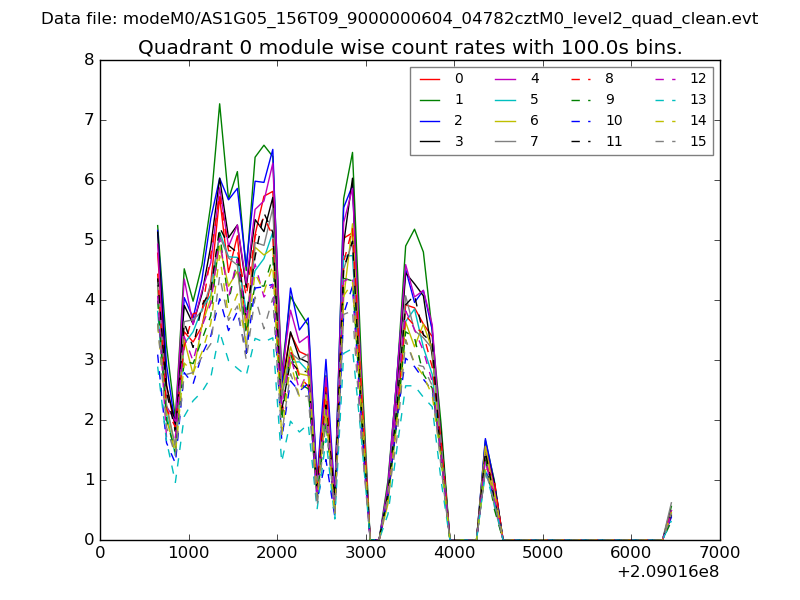 |
 |
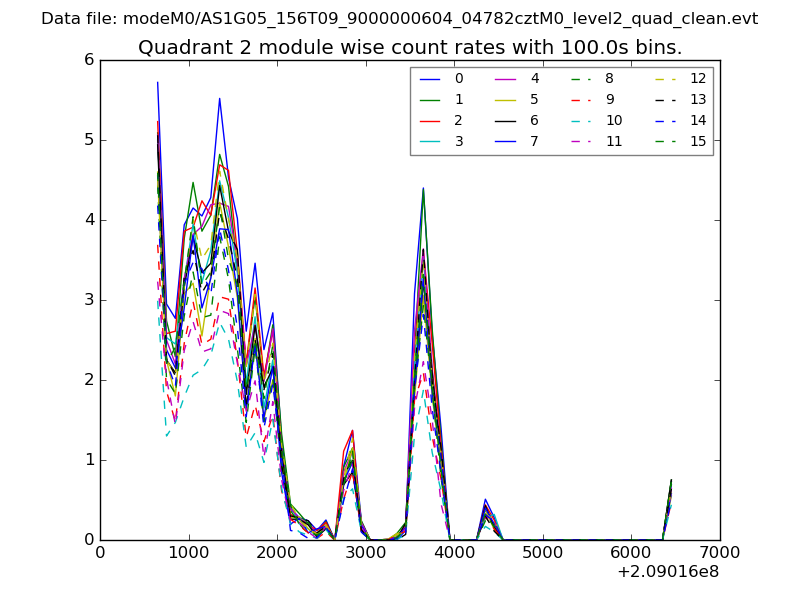
| Module-wise count rates for Quadrant B Data is divided into 100 sec bins |
 |
 |
| Module-wise count rates for Quadrant C Data is divided into 100 sec bins |
 |
 |
| Module-wise count rates for Quadrant D Data is divided into 100 sec bins |
 |
 |
| Parameter | Plot |
|---|---|
| CZT HV Monitor | 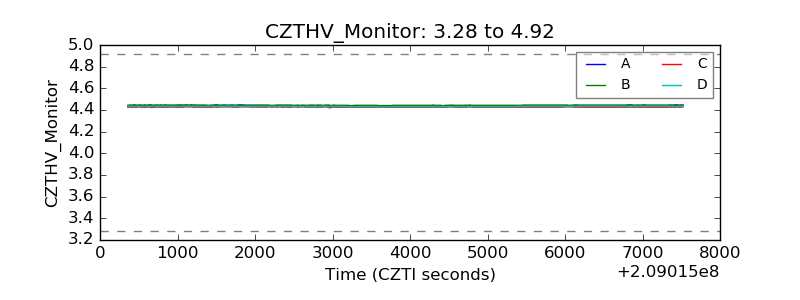 |
| D_VDD |  |
| Temperature 1 | 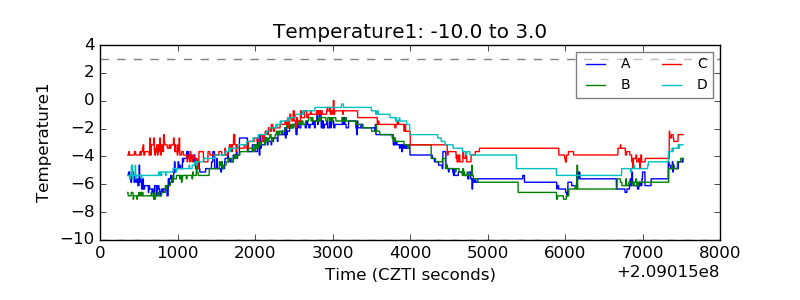 |
| Veto HV Monitor | 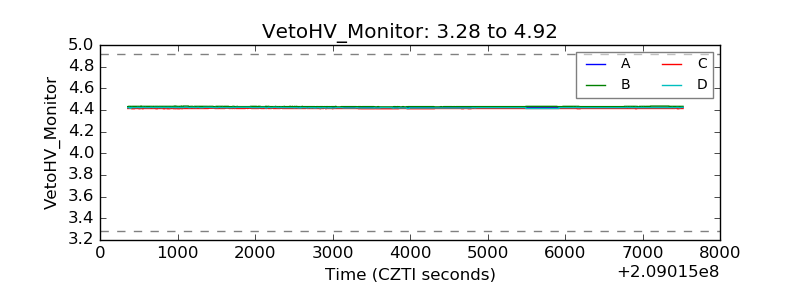 |
| Veto LLD | 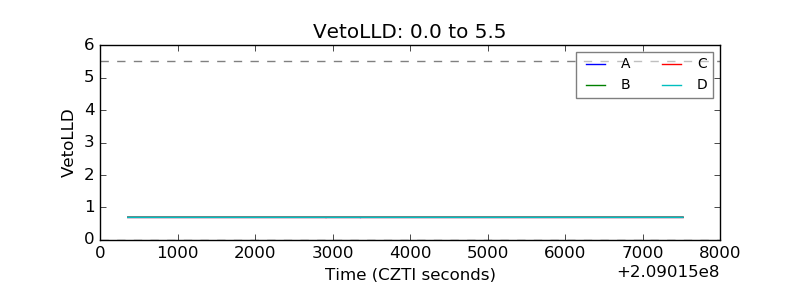 |
| Alpha Counter | 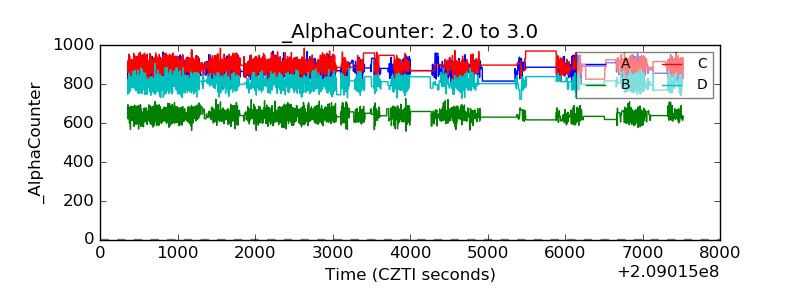 |
| _CPM_Rate | 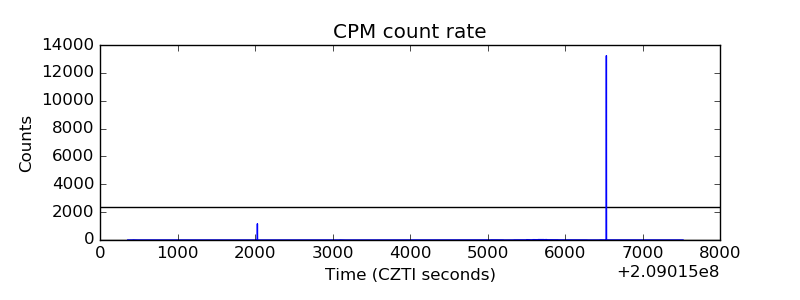 |
| CZT Counter | 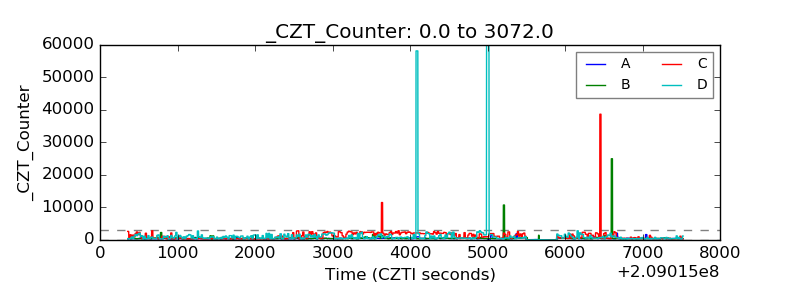 |
| +2.5 Volts monitor |  |
| +5 Volts monitor |  |
| _ROLL_ROT | 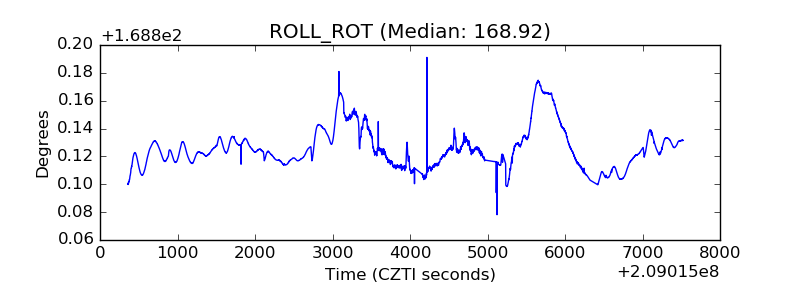 |
| _Roll_DEC | 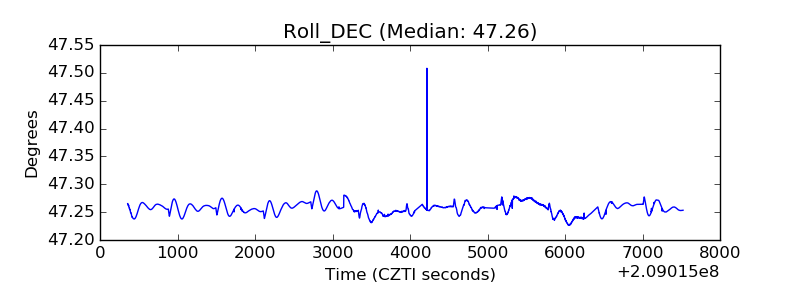 |
| _Roll_RA | 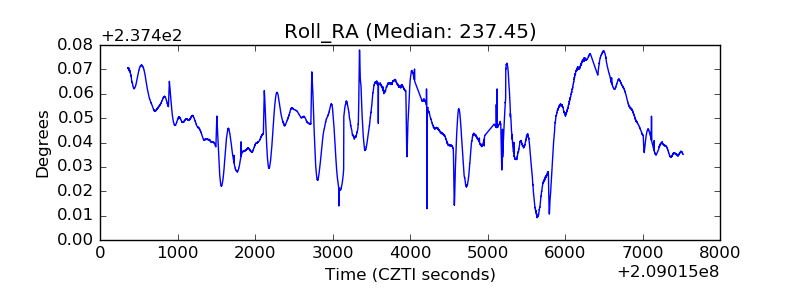 |
| Veto Counter | 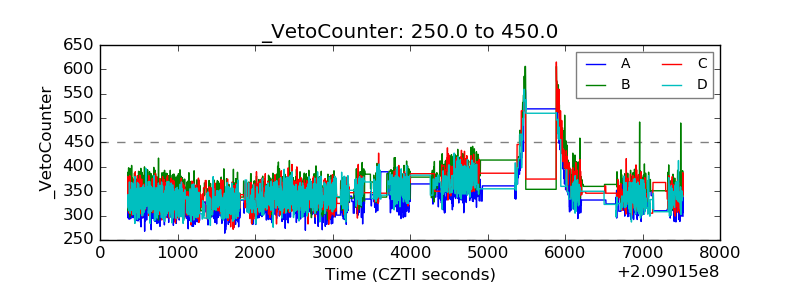 |