| Param | Original file | Final file |
|---|---|---|
| Filename | modeM0/AS1G05_156T09_9000000604_04784cztM0_level2.evt | modeM0/AS1G05_156T09_9000000604_04784cztM0_level2_quad_clean.evt |
| Size (bytes) | 553,809,600 | 65,508,480 |
| Size | 528.2 MB | 62.5 MB |
| Events in quadrant A | 2,718,703 | 419,016 |
| Events in quadrant B | 3,000,600 | 409,375 |
| Events in quadrant C | 5,211,525 | 380,427 |
| Events in quadrant D | 5,448,004 | 368,833 |
| Mode M9 | |||
|---|---|---|---|
| Quadrant | BADHDUFLAG | Total packets | Discarded packets |
| A | 0 | 5 | 0 |
| B | 0 | 5 | 0 |
| C | 0 | 5 | 0 |
| D | 0 | 5 | 0 |
| Mode M0 | |||
|---|---|---|---|
| Quadrant | BADHDUFLAG | Total packets | Discarded packets |
| A | 0 | 14555 | 2430 |
| B | 0 | 15559 | 2758 |
| C | 0 | 24410 | 5063 |
| D | 0 | 25066 | 4845 |
| Mode SS | |||
|---|---|---|---|
| Quadrant | BADHDUFLAG | Total packets | Discarded packets |
| A | 0 | 144 | 24 |
| B | 0 | 143 | 31 |
| C | 0 | 142 | 18 |
| D | 0 | 140 | 22 |
| Quadrant | Total seconds | Saturated seconds | Saturation percentage |
|---|---|---|---|
| A | 5916 | 83 | 1.402975% |
| B | 5851 | 141 | 2.409844% |
| C | 5675 | 831 | 14.643172% |
| D | 5732 | 446 | 7.780879% |
Noise dominated data is calculated using 1-second bins in cleaned event files. If a bin has >2000 counts, and if more than 50% of those come from <1% of pixels, then it is considered to be noise-dominated and hence unusable.
| Quadrant | # 1 sec bins | Bins with >0 counts | Bins with >2000 counts | High rate bins dominated by noise | Noise dominated (total time) | Noise dominated (detector-on time) | Marked lightcurve |
|---|---|---|---|---|---|---|---|
| A | 7781 | 6219 | 0 | 0 | 0.00% | 0.00% | 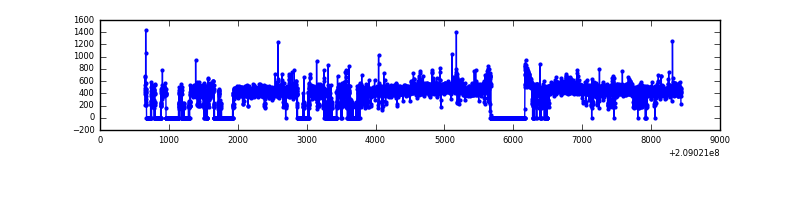 |
| B | 7781 | 6175 | 56 | 56 | 0.72% | 0.91% | 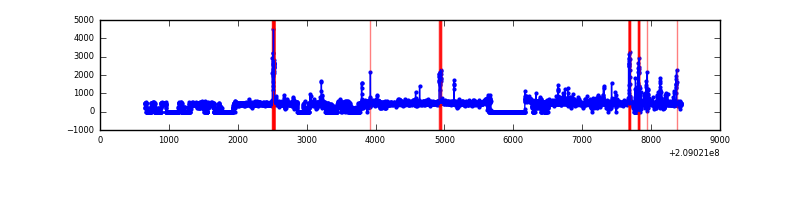 |
| C | 7781 | 6010 | 670 | 670 | 8.61% | 11.15% | 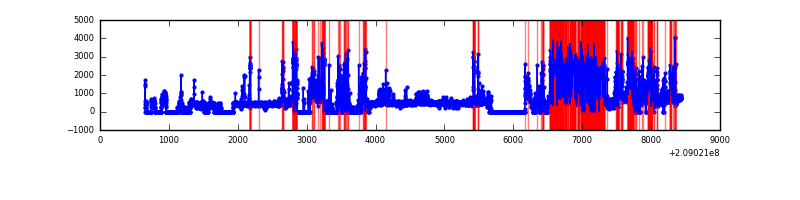 |
| D | 7781 | 6054 | 515 | 515 | 6.62% | 8.51% | 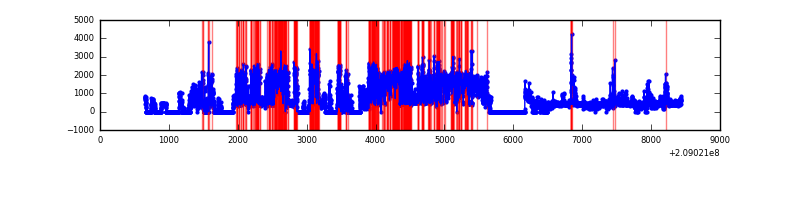 |
Top three noisy pixels from each quadrant. If the there are fewer than three noisy pixels in the level2.evt file, extra rows are filled as -1
| Pixel properties | Quadrant properties | ||||||
|---|---|---|---|---|---|---|---|
| Quadrant | DetID | PixID | Counts | Sigma | Mean | Median | Sigma |
| A | 8 | 15 | 88700 | 630.49 | 672 | 655 | 139.6 |
| A | 4 | 48 | 20161 | 139.68 | 672 | 655 | 139.6 |
| A | 0 | 50 | 12981 | 88.27 | 672 | 655 | 139.6 |
| B | 14 | 167 | 255625 | 1946.94 | 667 | 648 | 131.0 |
| B | 4 | 80 | 101375 | 769.12 | 667 | 648 | 131.0 |
| B | 15 | 54 | 28566 | 213.17 | 667 | 648 | 131.0 |
| C | 14 | 48 | 2905279 | 21144.46 | 586 | 587 | 137.4 |
| C | 1 | 16 | 11816 | 81.74 | 586 | 587 | 137.4 |
| C | 12 | 4 | 8101 | 54.7 | 586 | 587 | 137.4 |
| D | 11 | 132 | 2717485 | 17786.03 | 623 | 602 | 152.8 |
| D | 13 | 235 | 171008 | 1115.56 | 623 | 602 | 152.8 |
| D | 2 | 136 | 75620 | 491.1 | 623 | 602 | 152.8 |
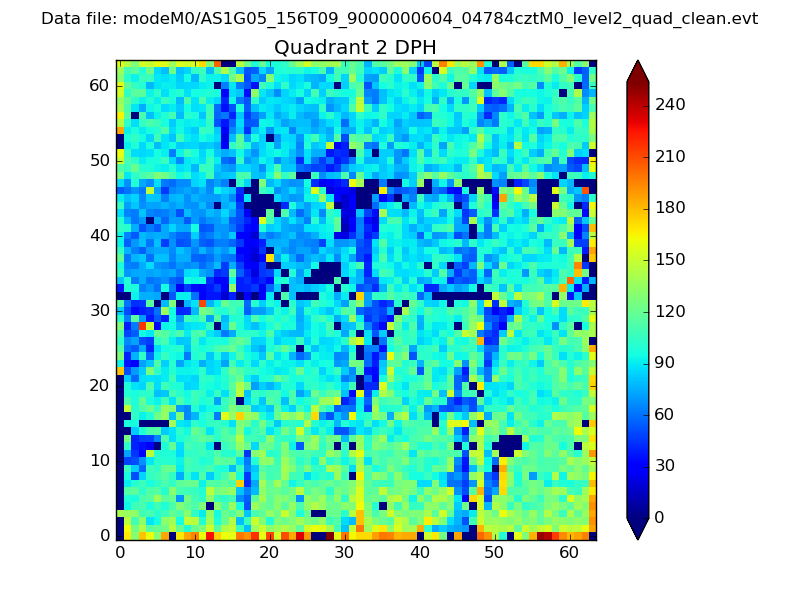
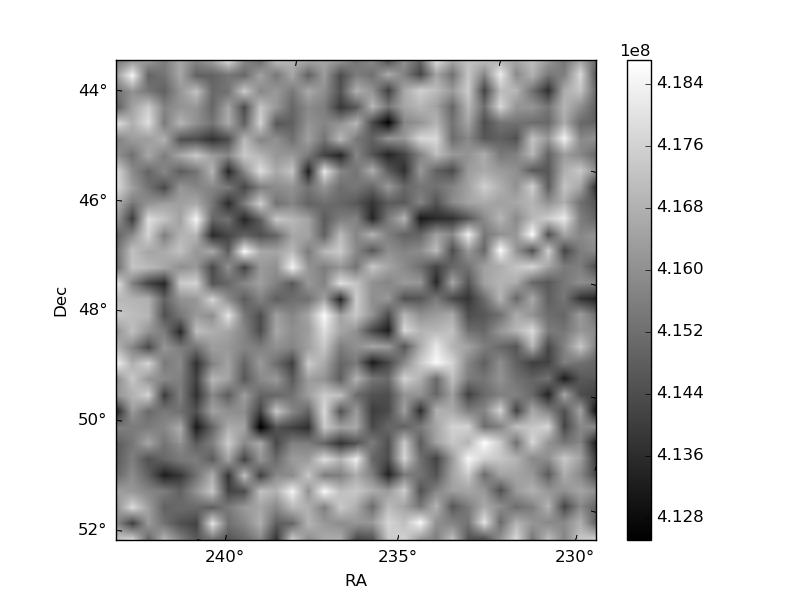
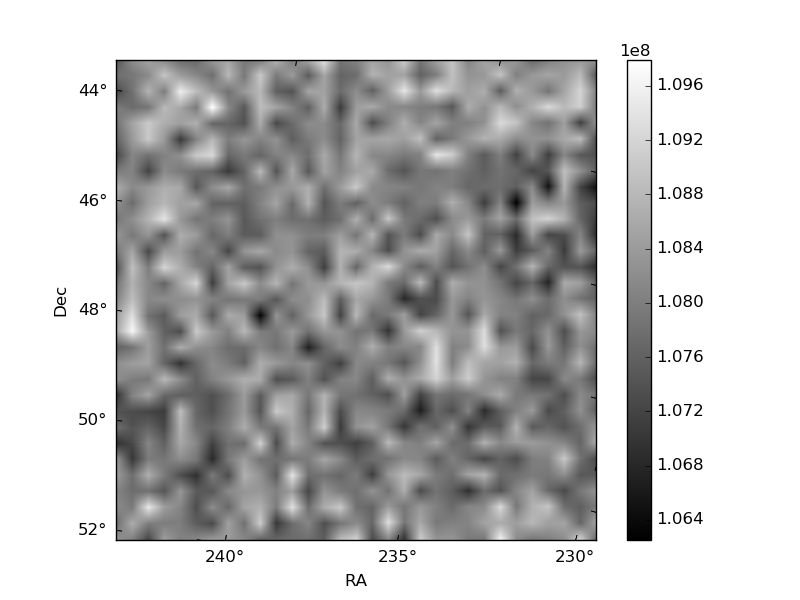
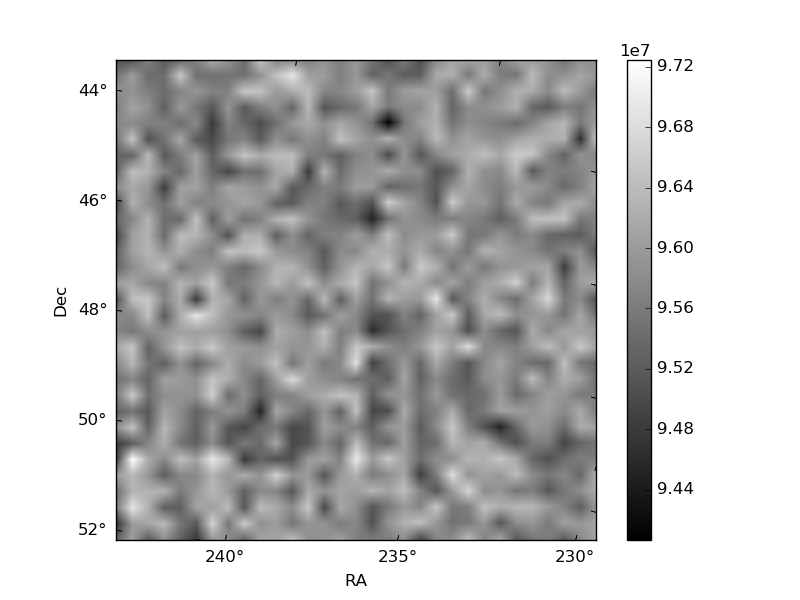
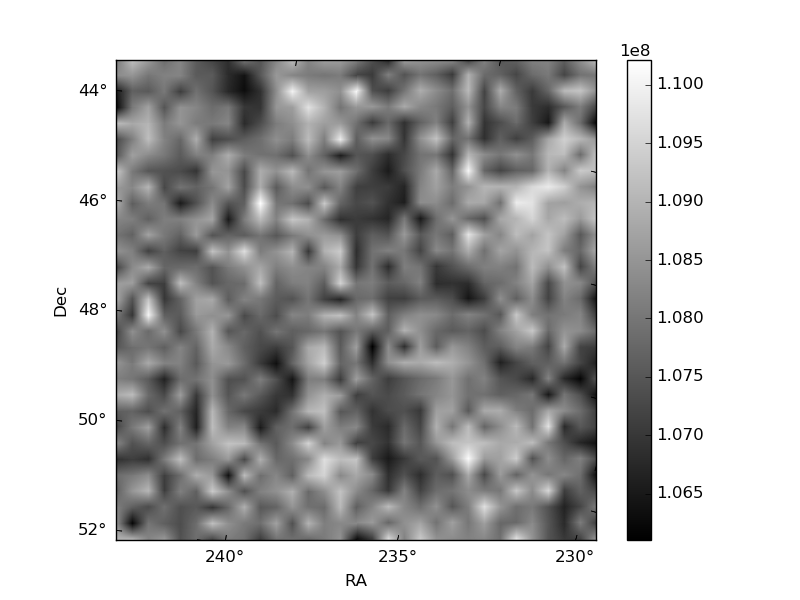
Histogram calculated using DETX and DETY for each event in the final _common_clean file
| Quadrant A | 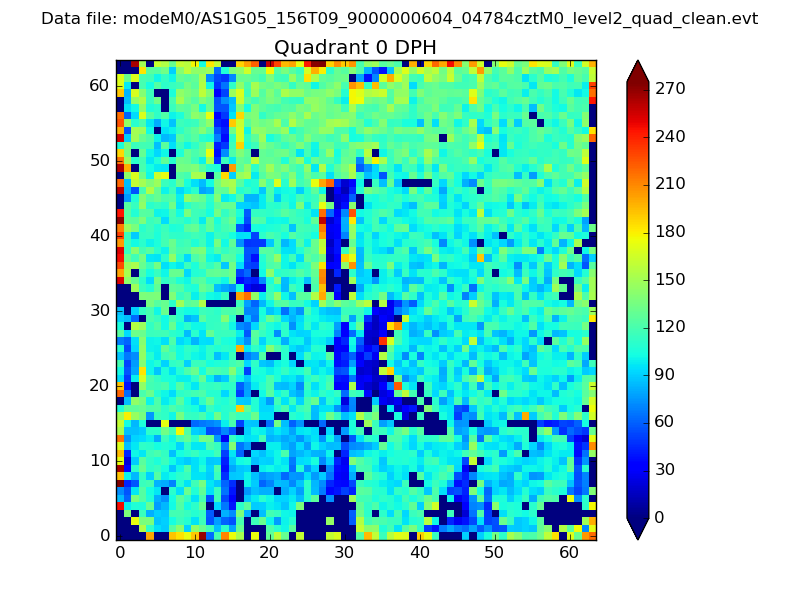 |
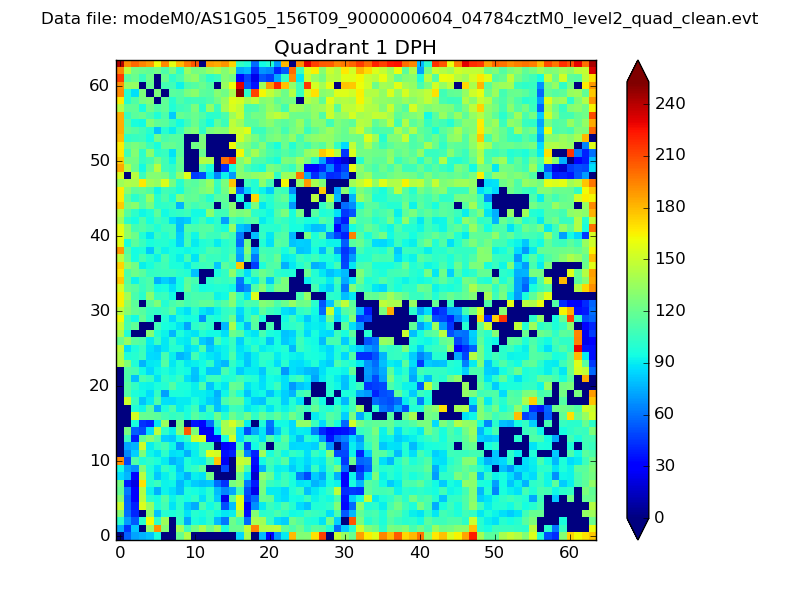 |
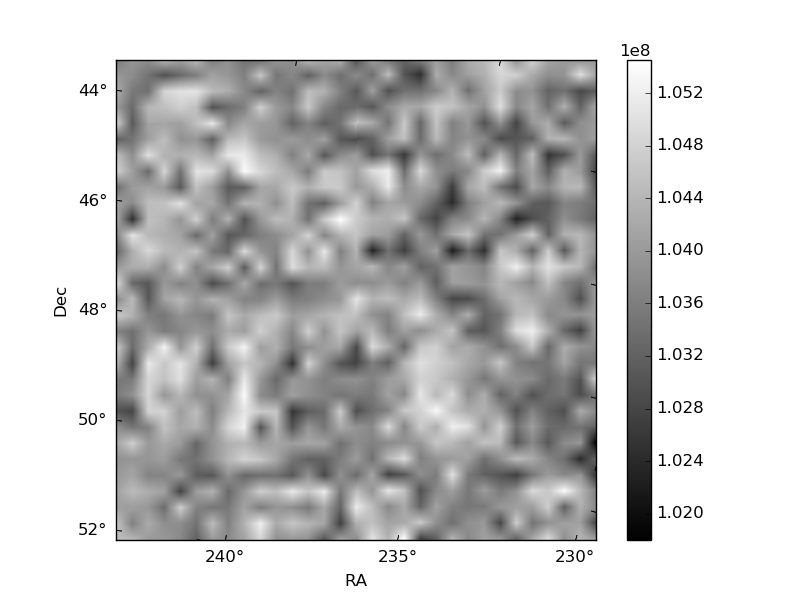
Quadrant B |
|---|---|---|---|
| Quadrant D | 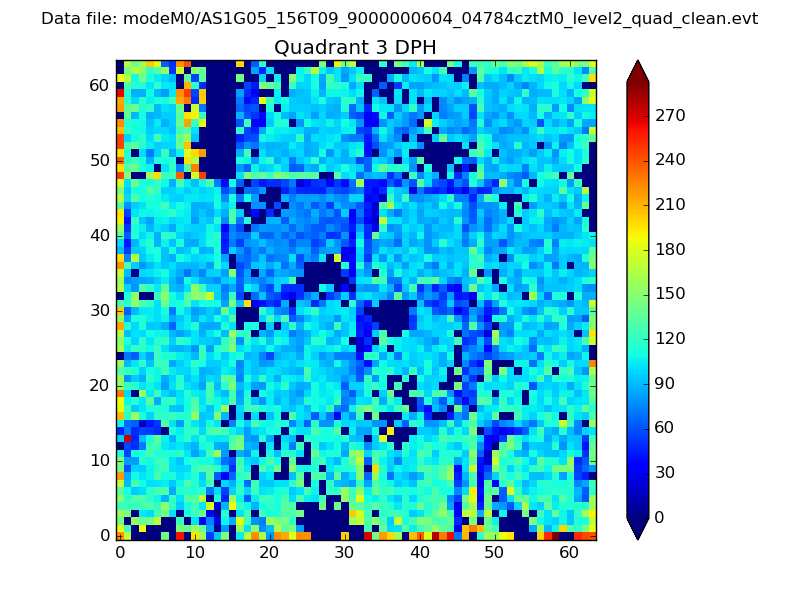 |
 |
Quadrant C |
| Plot type | Count rate plots | Images |
|---|---|---|
| Comparison with Poisson distribution Blue bars denote a histogram of data divided into 1 sec bins. Red curve is a Poisson curve with rate = median count rate of data. |
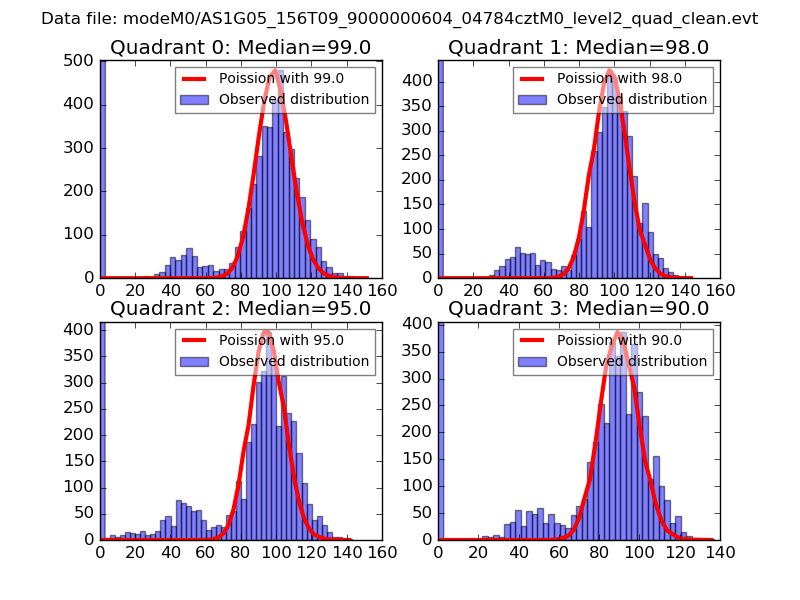 |
 |
| Quadrant-wise count rates Data is divided into 100 sec bins |
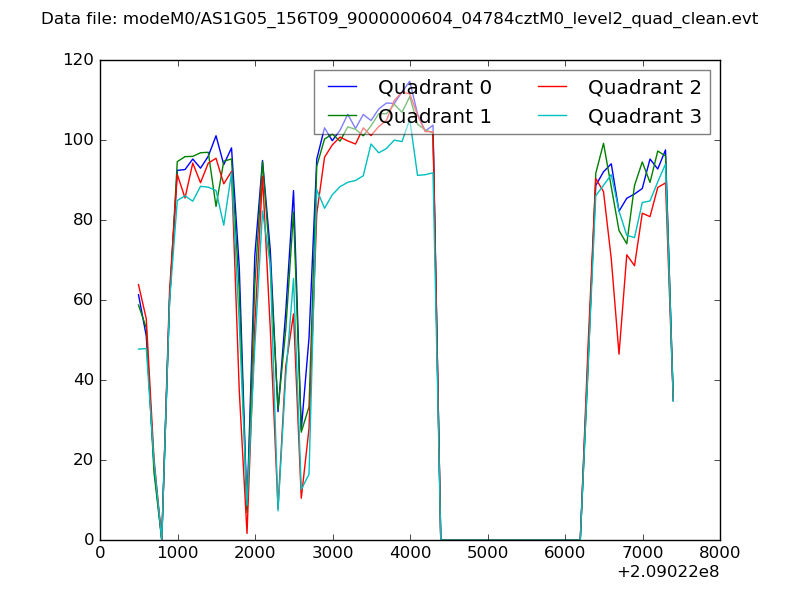 |
|
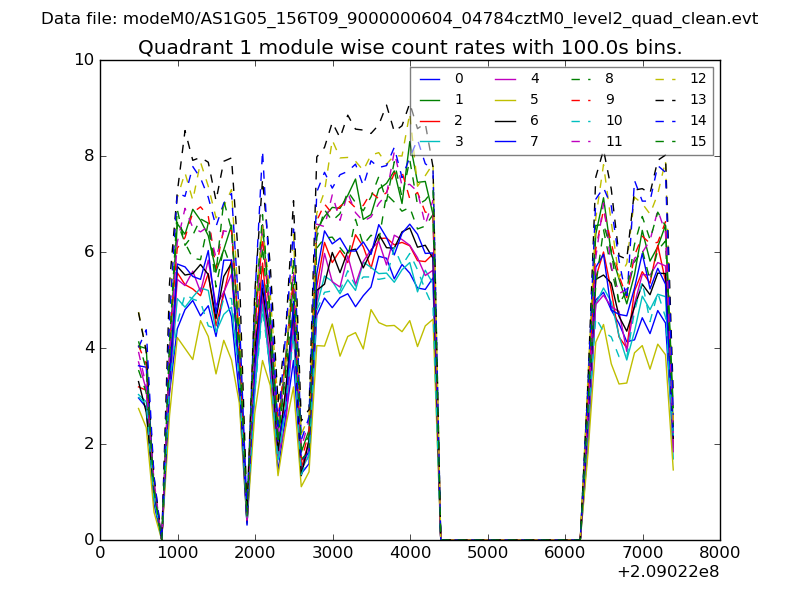
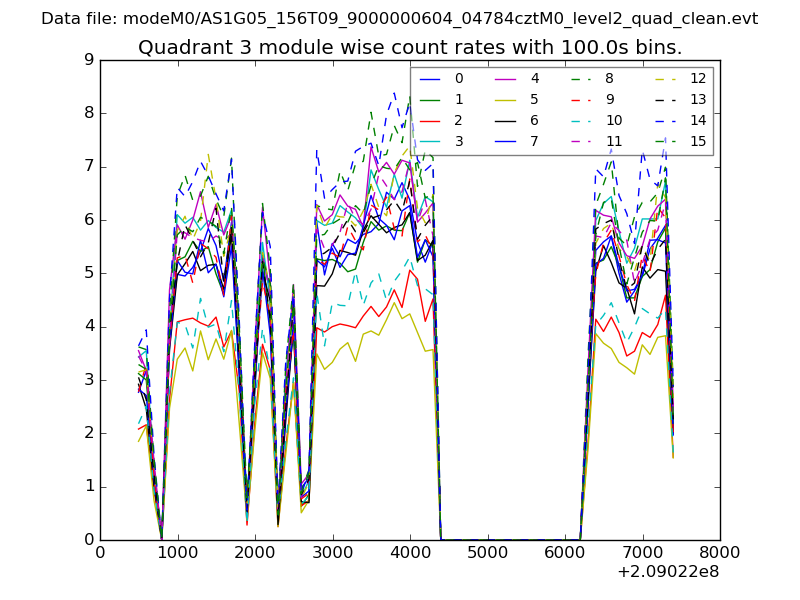
| Module-wise count rates for Quadrant A Data is divided into 100 sec bins |
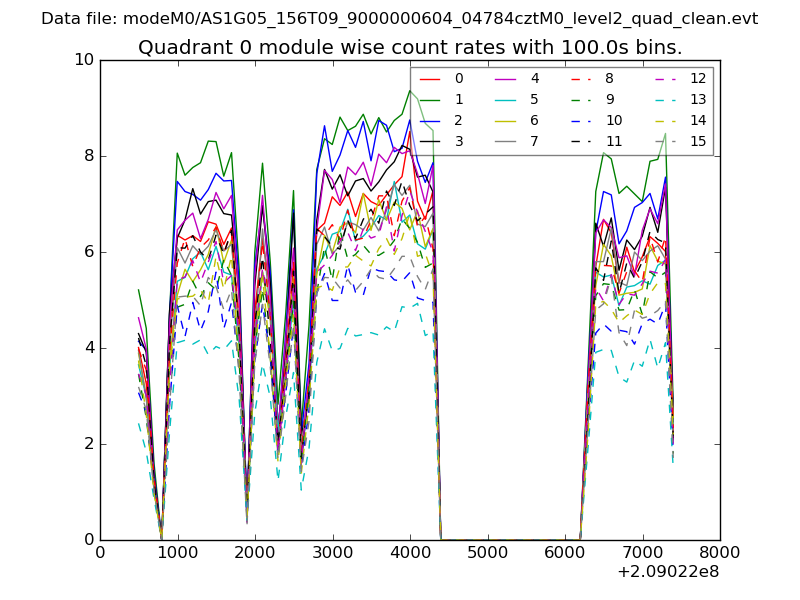 |
 |
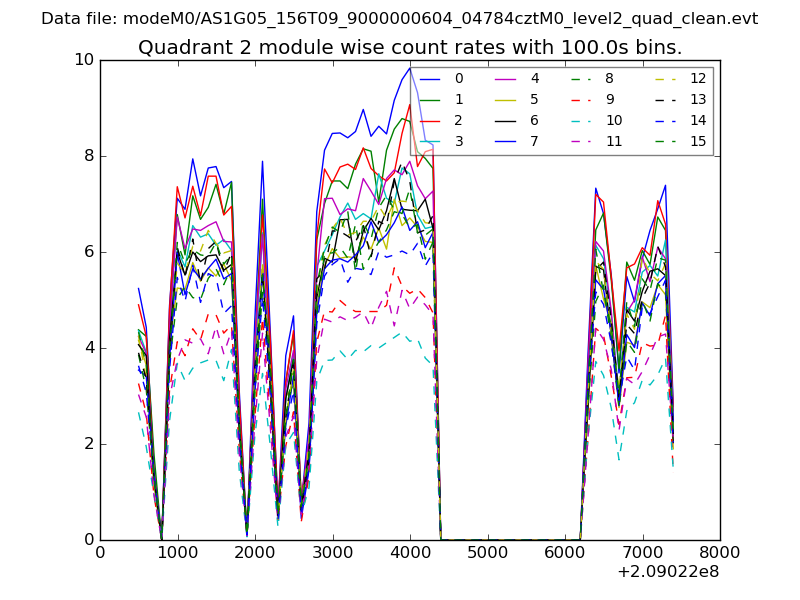
| Module-wise count rates for Quadrant B Data is divided into 100 sec bins |
 |
 |
| Module-wise count rates for Quadrant C Data is divided into 100 sec bins |
 |
 |
| Module-wise count rates for Quadrant D Data is divided into 100 sec bins |
 |
 |
| Parameter | Plot |
|---|---|
| CZT HV Monitor | 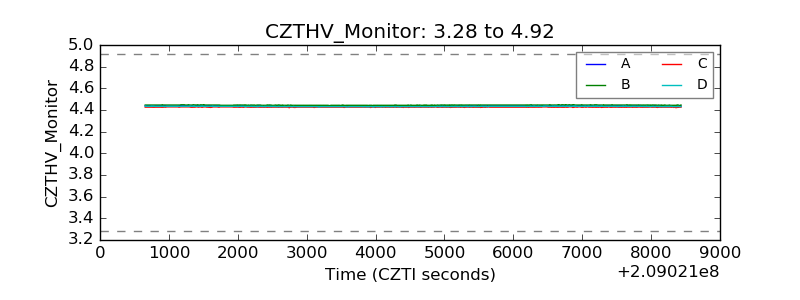 |
| D_VDD | 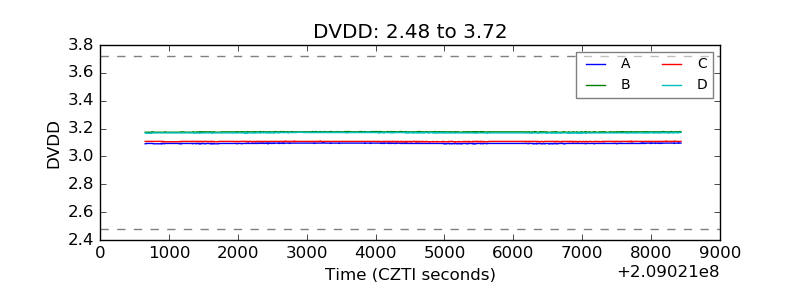 |
| Temperature 1 | 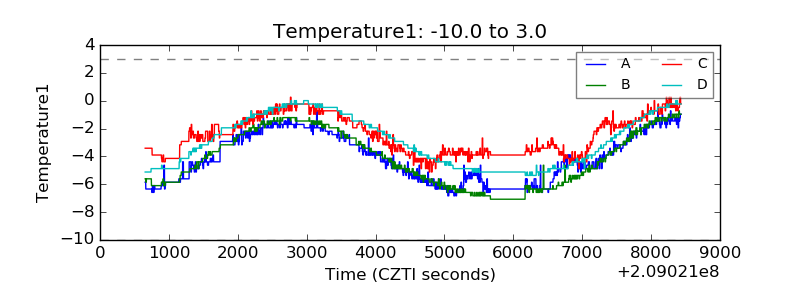 |
| Veto HV Monitor | 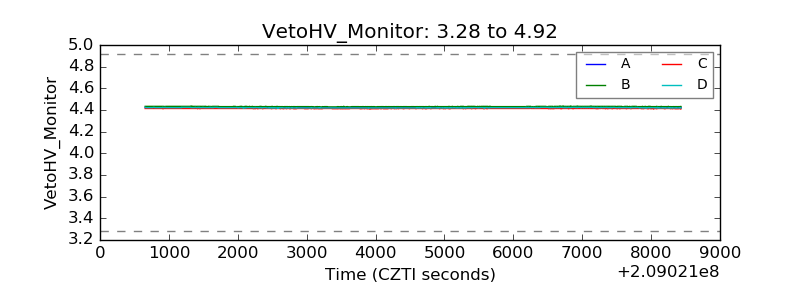 |
| Veto LLD | 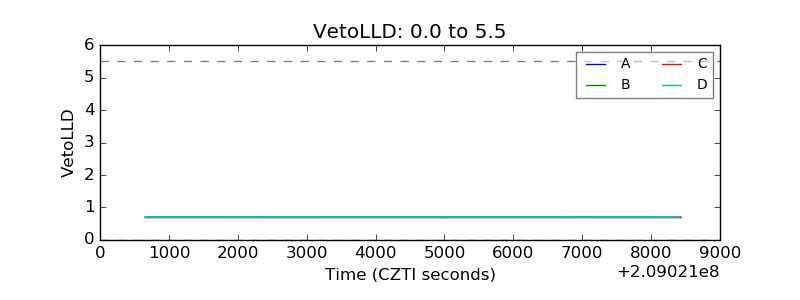 |
| Alpha Counter | 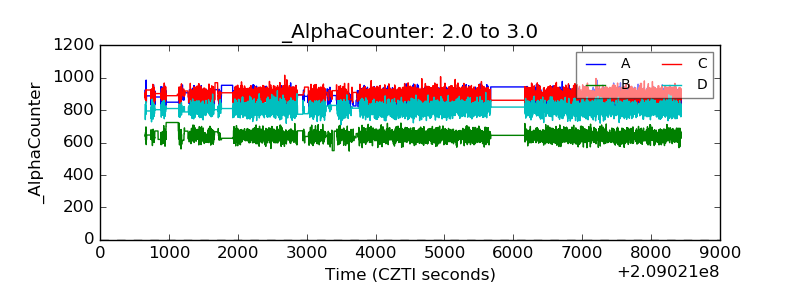 |
| _CPM_Rate | 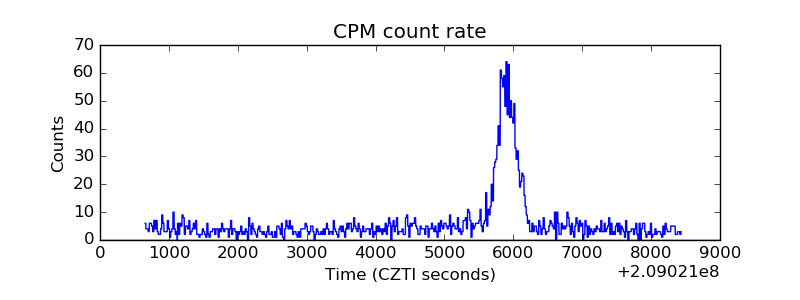 |
| CZT Counter | 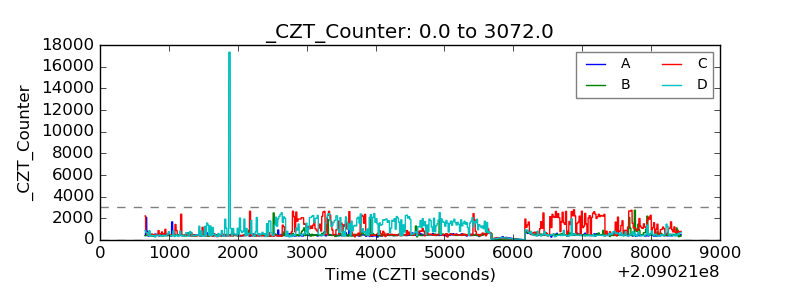 |
| +2.5 Volts monitor |  |
| +5 Volts monitor |  |
| _ROLL_ROT | 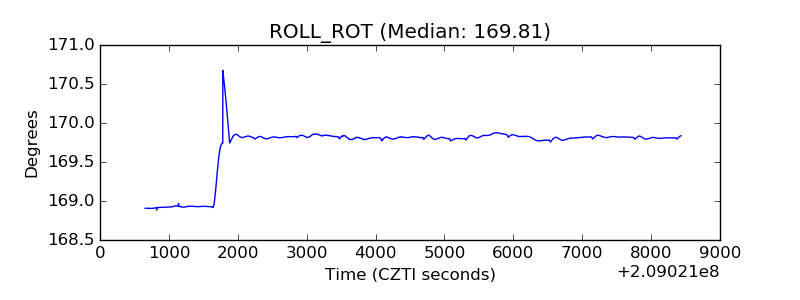 |
| _Roll_DEC | 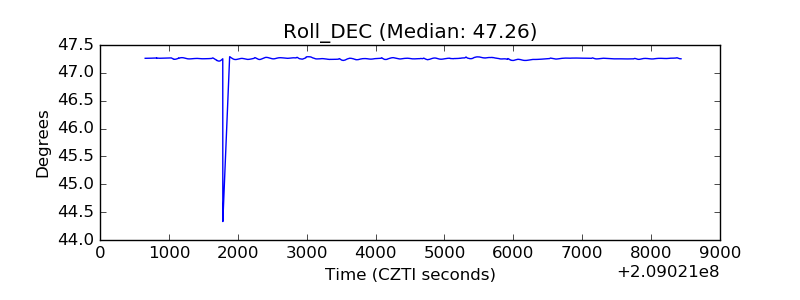 |
| _Roll_RA | 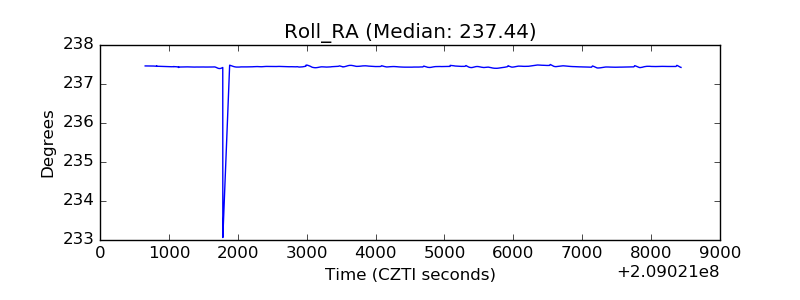 |
| Veto Counter | 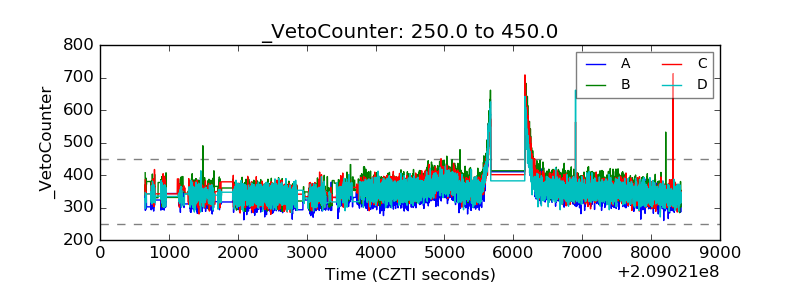 |