| Param | Original file | Final file |
|---|---|---|
| Filename | modeM0/AS1G05_156T09_9000000604_04788cztM0_level2.evt | modeM0/AS1G05_156T09_9000000604_04788cztM0_level2_quad_clean.evt |
| Size (bytes) | 452,551,680 | 83,220,480 |
| Size | 431.6 MB | 79.4 MB |
| Events in quadrant A | 3,491,623 | 532,327 |
| Events in quadrant B | 3,292,065 | 521,991 |
| Events in quadrant C | 2,799,854 | 519,000 |
| Events in quadrant D | 3,693,257 | 506,599 |
| Mode M9 | |||
|---|---|---|---|
| Quadrant | BADHDUFLAG | Total packets | Discarded packets |
| A | 0 | 11 | 0 |
| B | 0 | 11 | 0 |
| C | 0 | 11 | 0 |
| D | 0 | 11 | 0 |
| Mode M0 | |||
|---|---|---|---|
| Quadrant | BADHDUFLAG | Total packets | Discarded packets |
| A | 0 | 14716 | 2 |
| B | 0 | 13971 | 1 |
| C | 0 | 12868 | 1 |
| D | 0 | 15382 | 1 |
| Mode SS | |||
|---|---|---|---|
| Quadrant | BADHDUFLAG | Total packets | Discarded packets |
| A | 0 | 128 | 0 |
| B | 0 | 128 | 0 |
| C | 0 | 128 | 0 |
| D | 0 | 128 | 0 |
| Quadrant | Total seconds | Saturated seconds | Saturation percentage |
|---|---|---|---|
| A | 6308 | 277 | 4.391249% |
| B | 6308 | 80 | 1.268231% |
| C | 6308 | 44 | 0.697527% |
| D | 6308 | 127 | 2.013316% |
Noise dominated data is calculated using 1-second bins in cleaned event files. If a bin has >2000 counts, and if more than 50% of those come from <1% of pixels, then it is considered to be noise-dominated and hence unusable.
| Quadrant | # 1 sec bins | Bins with >0 counts | Bins with >2000 counts | High rate bins dominated by noise | Noise dominated (total time) | Noise dominated (detector-on time) | Marked lightcurve |
|---|---|---|---|---|---|---|---|
| A | 7398 | 6308 | 163 | 163 | 2.20% | 2.58% | 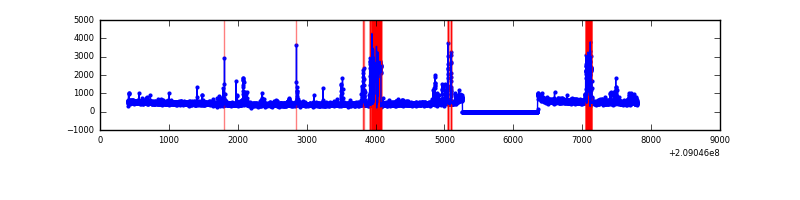 |
| B | 7398 | 6308 | 26 | 26 | 0.35% | 0.41% | 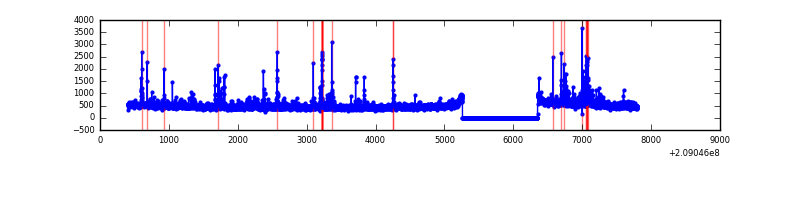 |
| C | 7398 | 6308 | 0 | 0 | 0.00% | 0.00% | 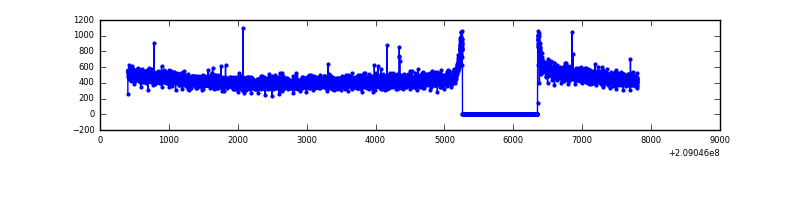 |
| D | 7398 | 6309 | 77 | 77 | 1.04% | 1.22% | 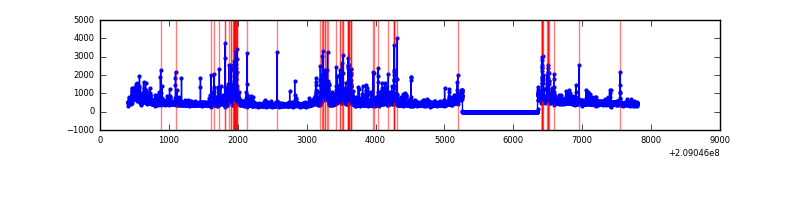 |
Top three noisy pixels from each quadrant. If the there are fewer than three noisy pixels in the level2.evt file, extra rows are filled as -1
| Pixel properties | Quadrant properties | ||||||
|---|---|---|---|---|---|---|---|
| Quadrant | DetID | PixID | Counts | Sigma | Mean | Median | Sigma |
| A | 0 | 50 | 559768 | 3794.05 | 725 | 709 | 147.4 |
| A | 8 | 15 | 50231 | 336.08 | 725 | 709 | 147.4 |
| A | 0 | 118 | 33439 | 222.12 | 725 | 709 | 147.4 |
| B | 10 | 16 | 125349 | 894.75 | 737 | 721 | 139.3 |
| B | 4 | 80 | 113953 | 812.94 | 737 | 721 | 139.3 |
| B | 15 | 204 | 112673 | 803.75 | 737 | 721 | 139.3 |
| C | 13 | 61 | 5865 | 30.84 | 716 | 718 | 166.9 |
| C | 5 | 96 | 2194 | 8.85 | 716 | 718 | 166.9 |
| C | 3 | 202 | 1844 | 6.75 | 716 | 718 | 166.9 |
| D | 13 | 235 | 382504 | 2241.93 | 718 | 698 | 170.3 |
| D | 2 | 136 | 248152 | 1453.03 | 718 | 698 | 170.3 |
| D | 2 | 234 | 172981 | 1011.63 | 718 | 698 | 170.3 |
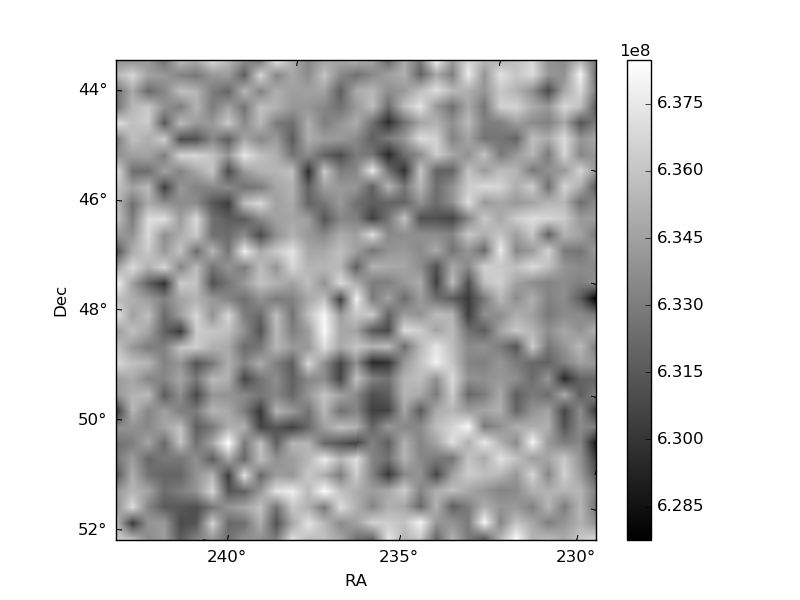
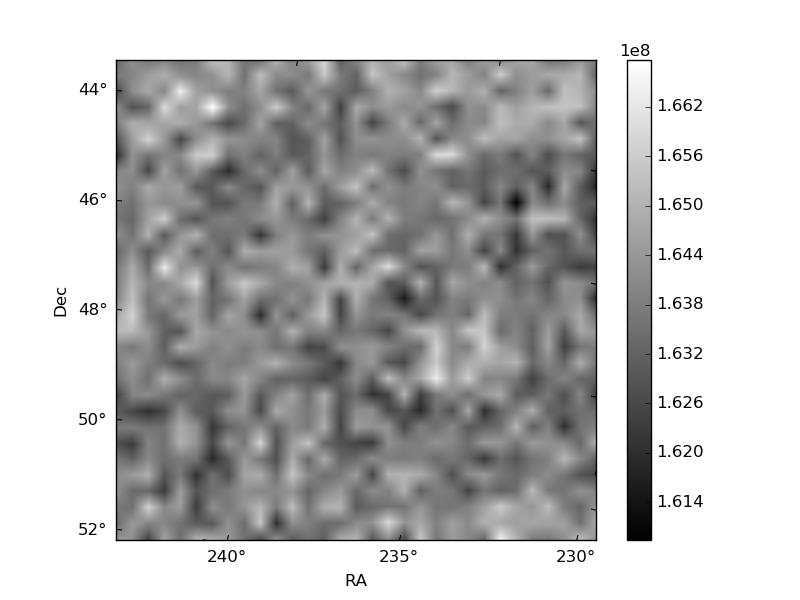
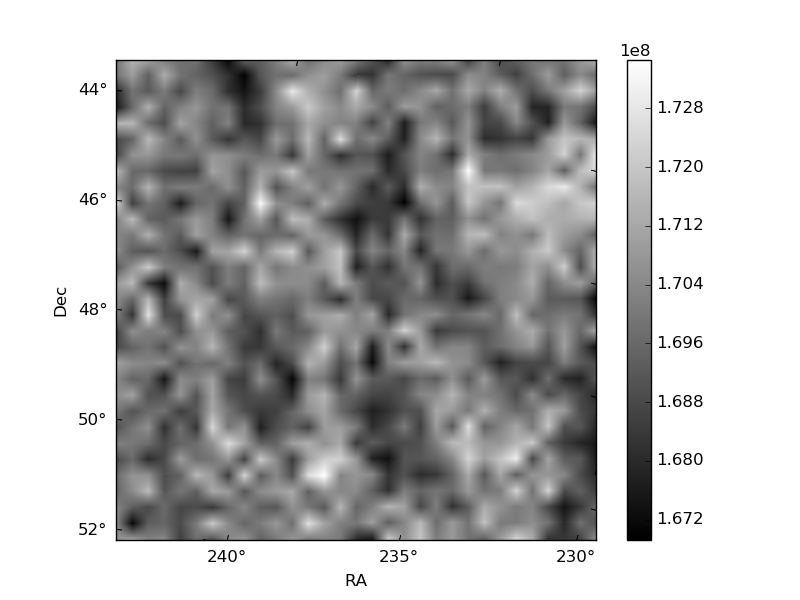
Histogram calculated using DETX and DETY for each event in the final _common_clean file
| Quadrant A | 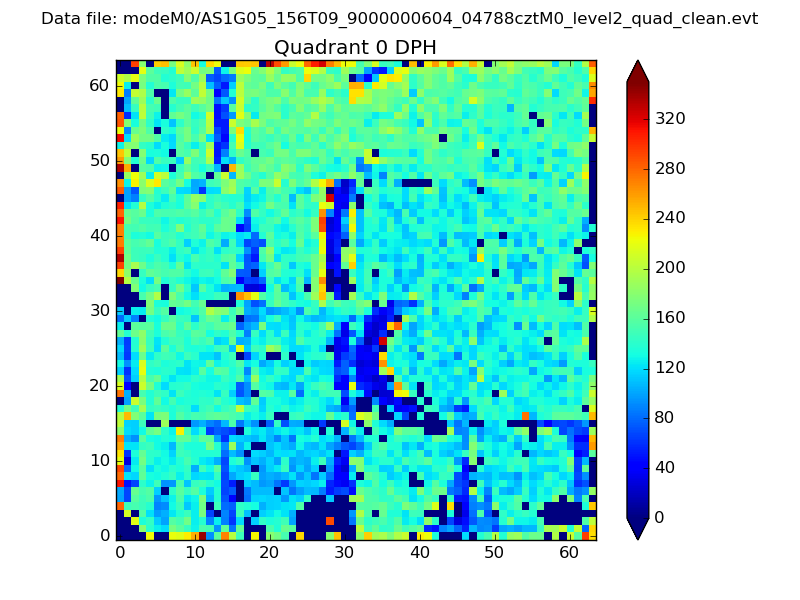 |
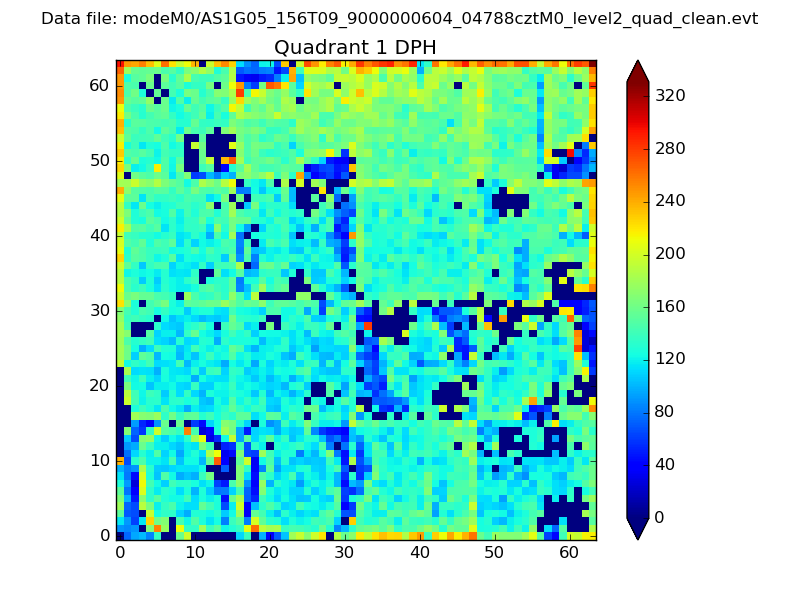 |
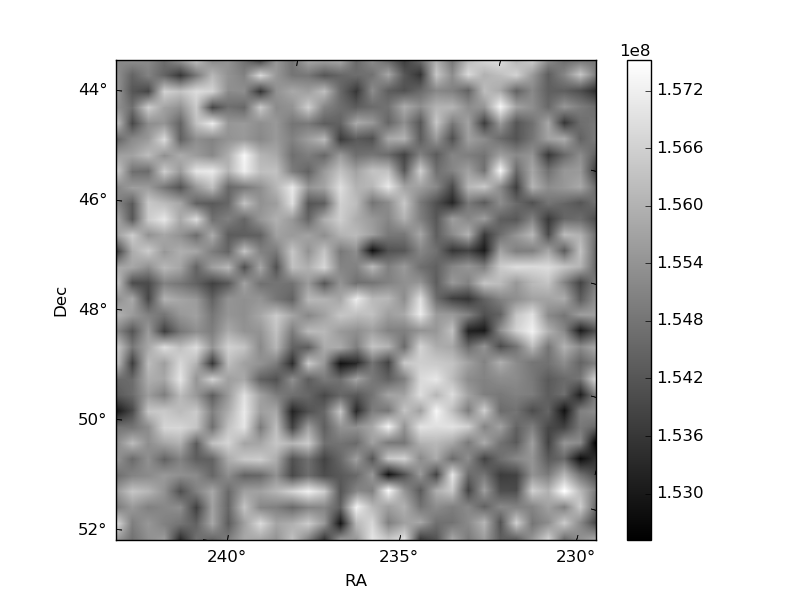
Quadrant B |
|---|---|---|---|
| Quadrant D | 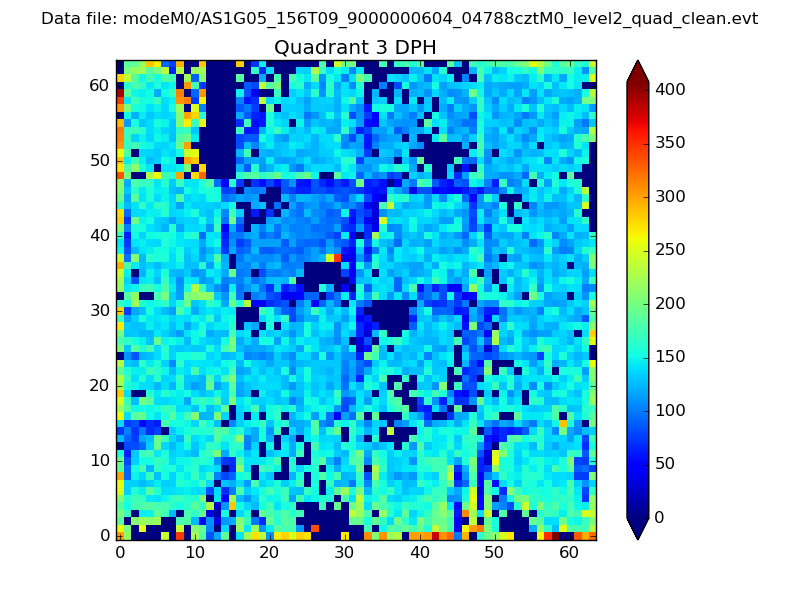 |
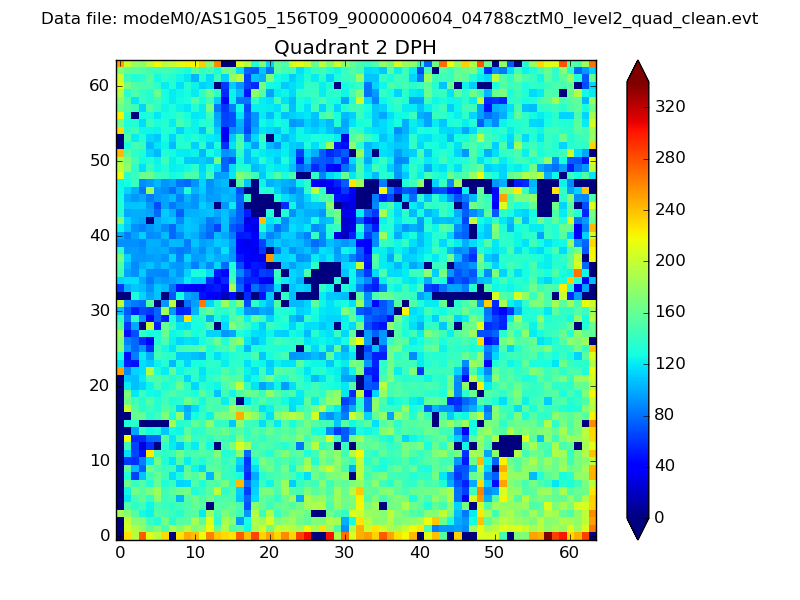 |
Quadrant C |
| Plot type | Count rate plots | Images |
|---|---|---|
| Comparison with Poisson distribution Blue bars denote a histogram of data divided into 1 sec bins. Red curve is a Poisson curve with rate = median count rate of data. |
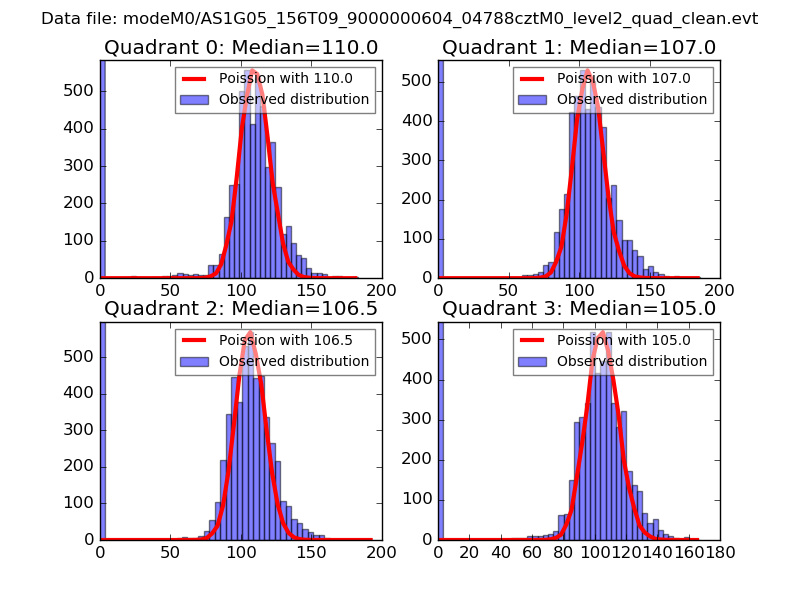 |
 |
| Quadrant-wise count rates Data is divided into 100 sec bins |
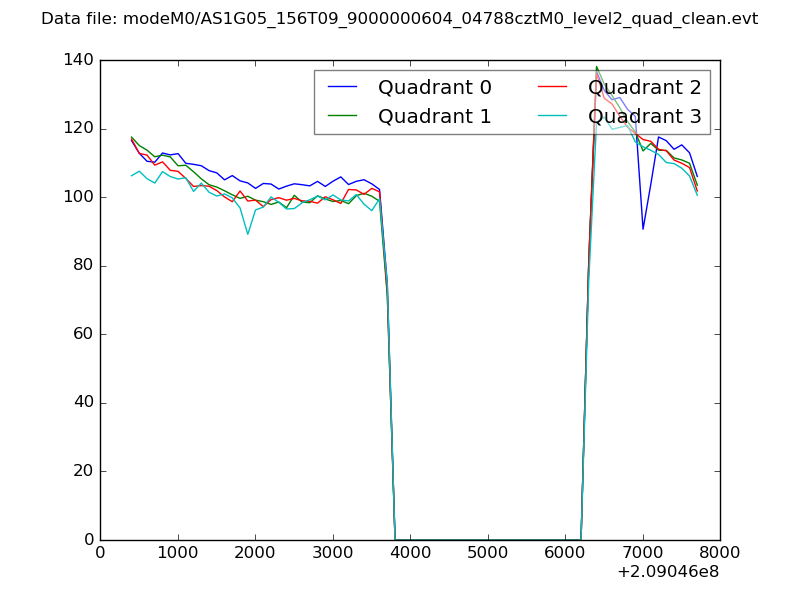 |
|
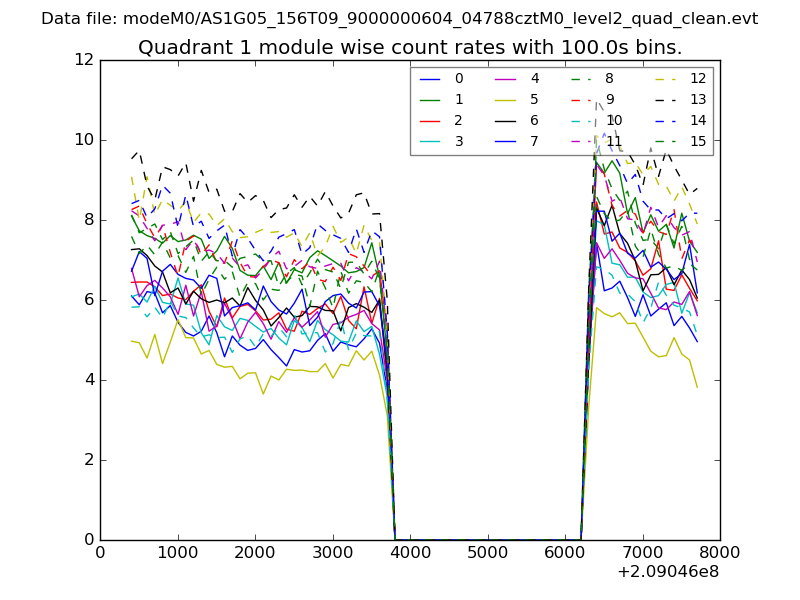
| Module-wise count rates for Quadrant A Data is divided into 100 sec bins |
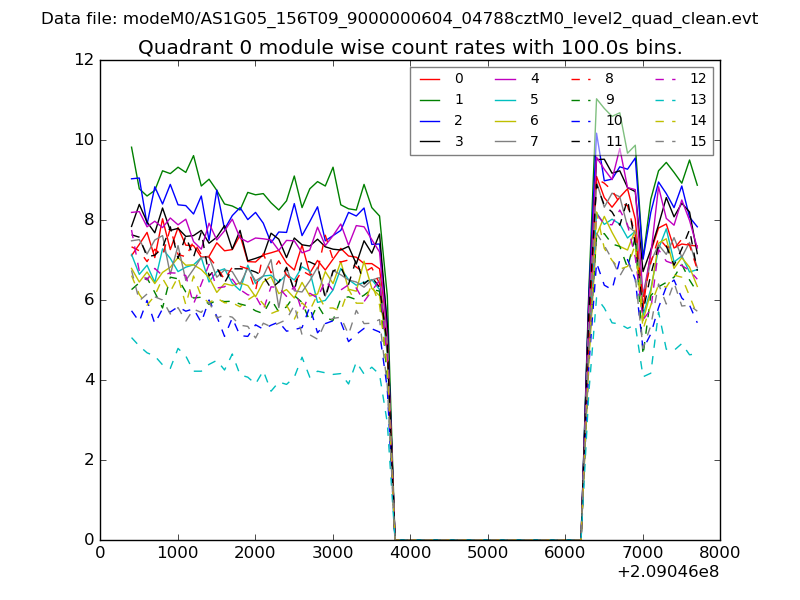 |
 |
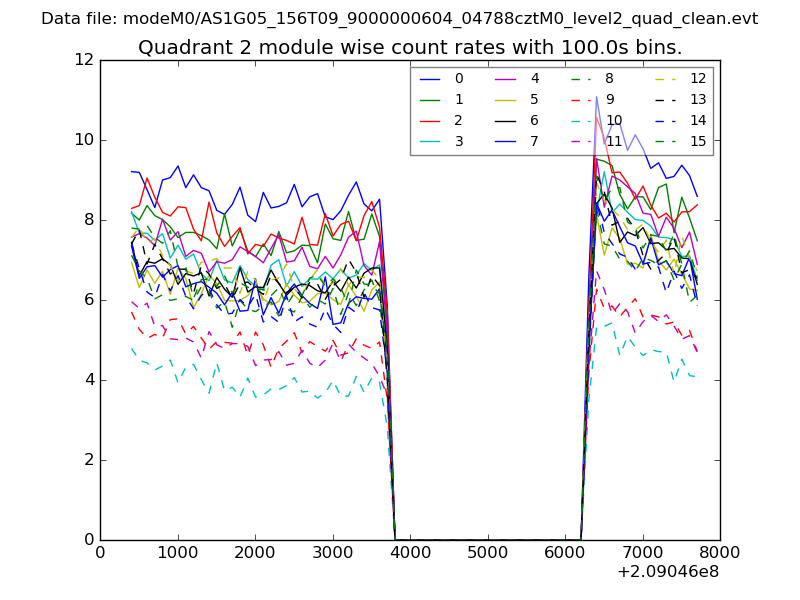
| Module-wise count rates for Quadrant B Data is divided into 100 sec bins |
 |
 |
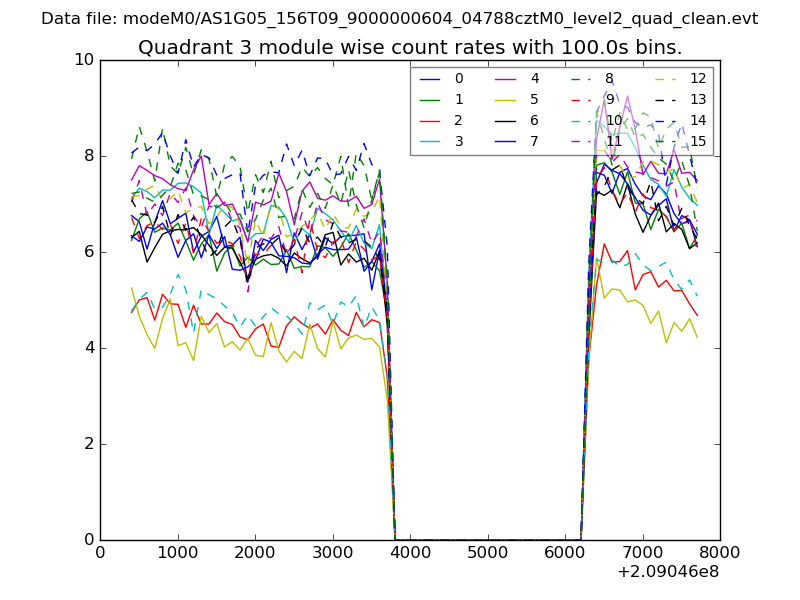
| Module-wise count rates for Quadrant C Data is divided into 100 sec bins |
 |
 |
| Module-wise count rates for Quadrant D Data is divided into 100 sec bins |
 |
 |
| Parameter | Plot |
|---|---|
| CZT HV Monitor | 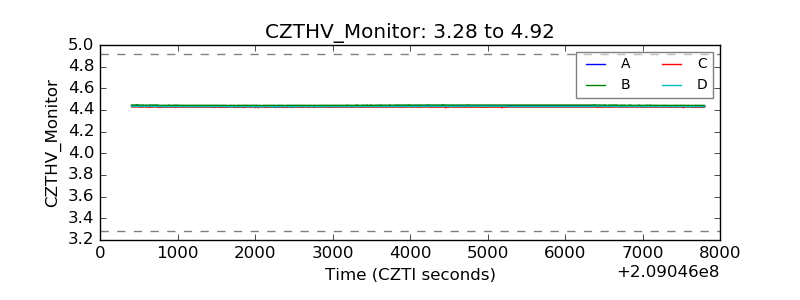 |
| D_VDD | 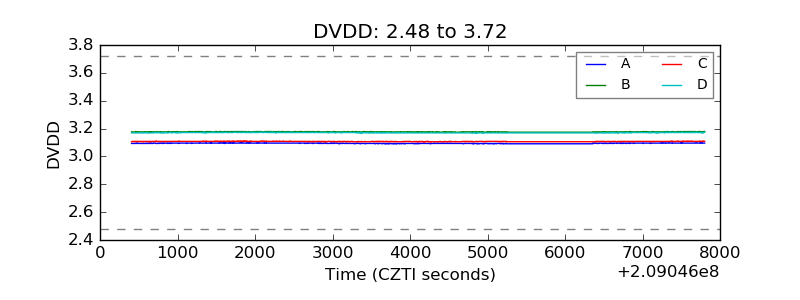 |
| Temperature 1 | 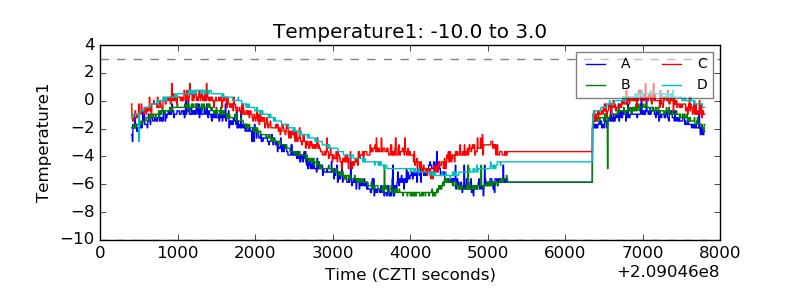 |
| Veto HV Monitor | 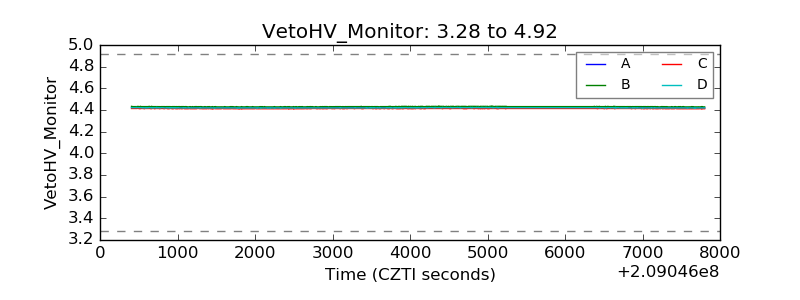 |
| Veto LLD | 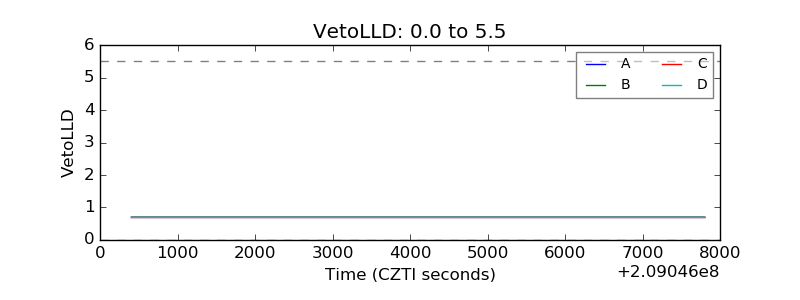 |
| Alpha Counter | 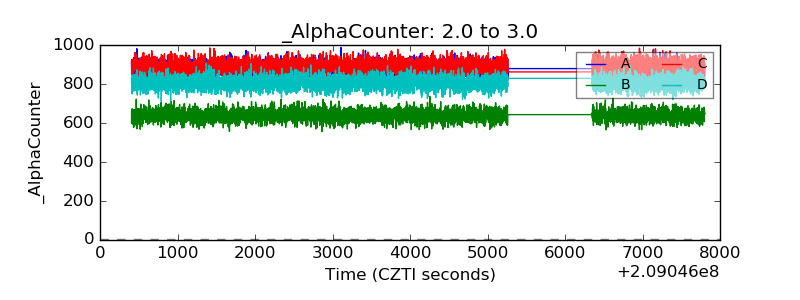 |
| _CPM_Rate | 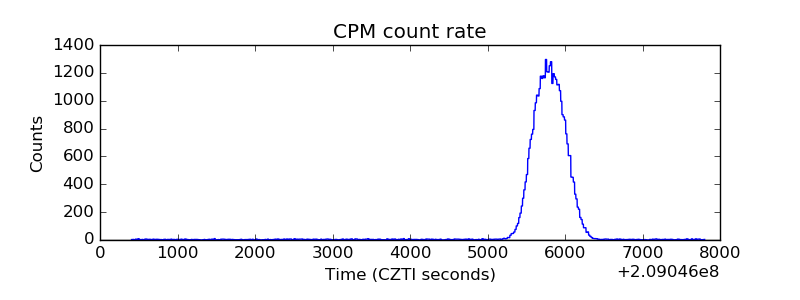 |
| CZT Counter | 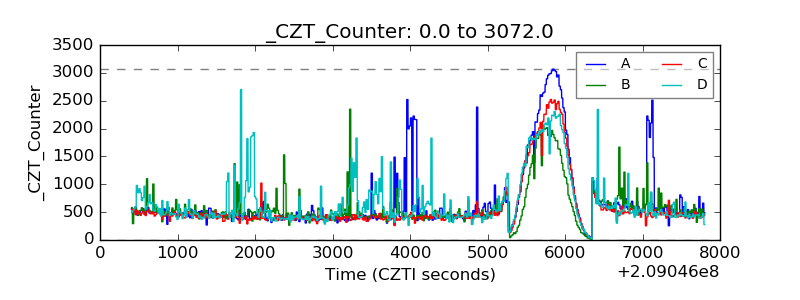 |
| +2.5 Volts monitor | 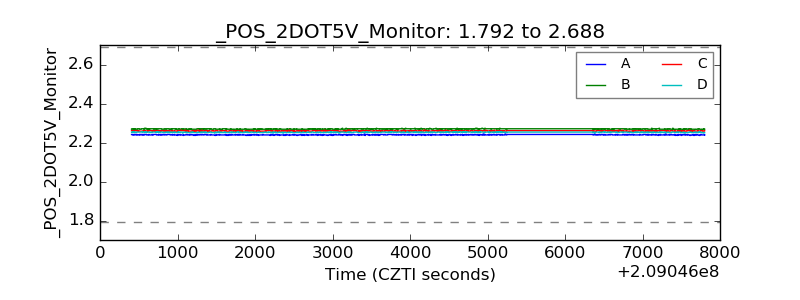 |
| +5 Volts monitor | 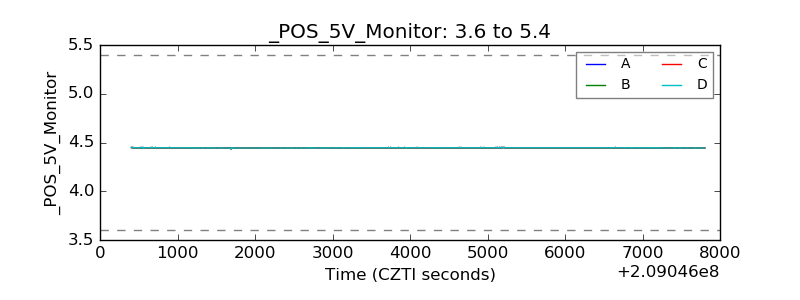 |
| _ROLL_ROT | 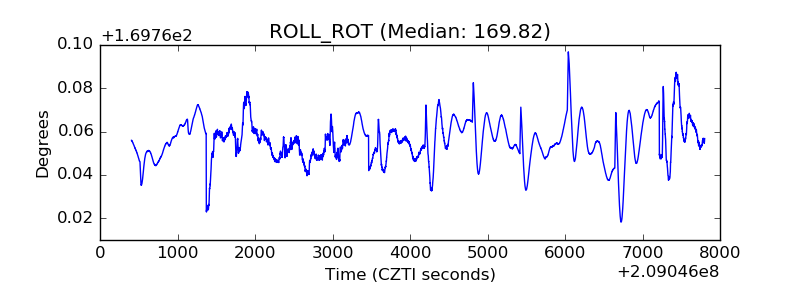 |
| _Roll_DEC | 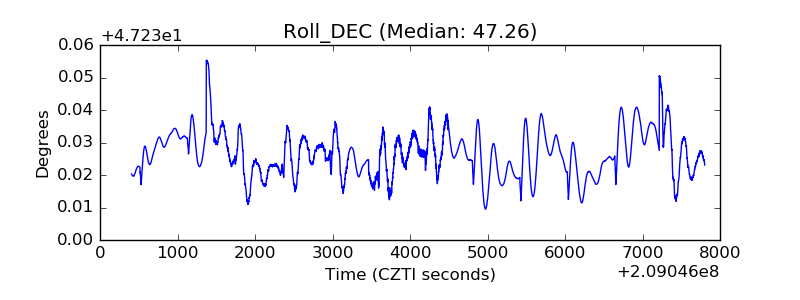 |
| _Roll_RA | 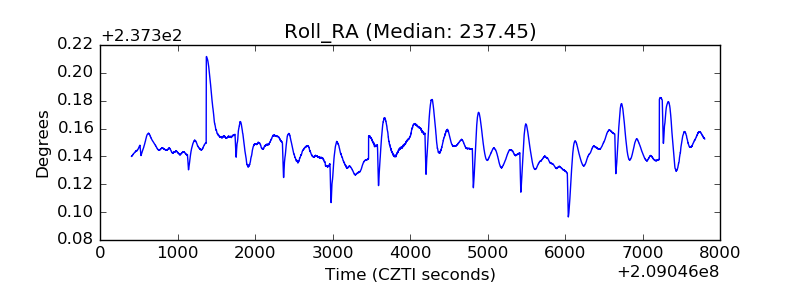 |
| Veto Counter | 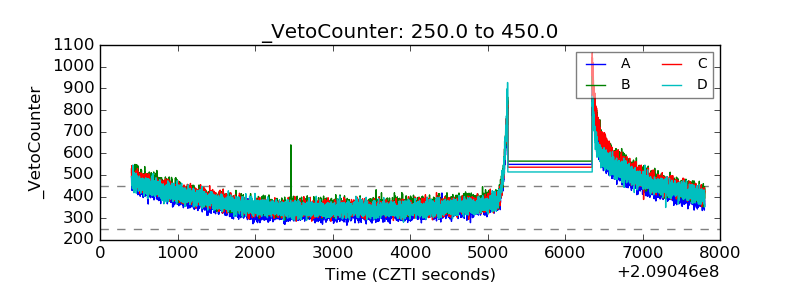 |