| Param | Original file | Final file |
|---|---|---|
| Filename | modeM0/AS1G05_156T09_9000000604_04790cztM0_level2.evt | modeM0/AS1G05_156T09_9000000604_04790cztM0_level2_quad_clean.evt |
| Size (bytes) | 543,628,800 | 75,116,160 |
| Size | 518.4 MB | 71.6 MB |
| Events in quadrant A | 3,083,043 | 502,579 |
| Events in quadrant B | 4,407,263 | 464,328 |
| Events in quadrant C | 3,222,839 | 488,539 |
| Events in quadrant D | 5,332,188 | 387,890 |
| Mode M9 | |||
|---|---|---|---|
| Quadrant | BADHDUFLAG | Total packets | Discarded packets |
| A | 0 | 13 | 0 |
| B | 0 | 13 | 0 |
| C | 0 | 13 | 0 |
| D | 0 | 13 | 0 |
| Mode M0 | |||
|---|---|---|---|
| Quadrant | BADHDUFLAG | Total packets | Discarded packets |
| A | 0 | 13317 | 2 |
| B | 0 | 17290 | 1 |
| C | 0 | 13790 | 1 |
| D | 0 | 20052 | 1 |
| Mode SS | |||
|---|---|---|---|
| Quadrant | BADHDUFLAG | Total packets | Discarded packets |
| A | 0 | 126 | 0 |
| B | 0 | 126 | 0 |
| C | 0 | 126 | 0 |
| D | 0 | 126 | 0 |
| Quadrant | Total seconds | Saturated seconds | Saturation percentage |
|---|---|---|---|
| A | 6166 | 74 | 1.200130% |
| B | 6166 | 432 | 7.006163% |
| C | 6166 | 36 | 0.583847% |
| D | 6166 | 1049 | 17.012650% |
Noise dominated data is calculated using 1-second bins in cleaned event files. If a bin has >2000 counts, and if more than 50% of those come from <1% of pixels, then it is considered to be noise-dominated and hence unusable.
| Quadrant | # 1 sec bins | Bins with >0 counts | Bins with >2000 counts | High rate bins dominated by noise | Noise dominated (total time) | Noise dominated (detector-on time) | Marked lightcurve |
|---|---|---|---|---|---|---|---|
| A | 7461 | 6167 | 33 | 33 | 0.44% | 0.54% | 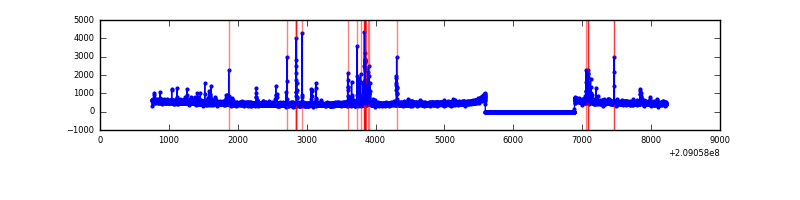 |
| B | 7461 | 6167 | 344 | 344 | 4.61% | 5.58% | 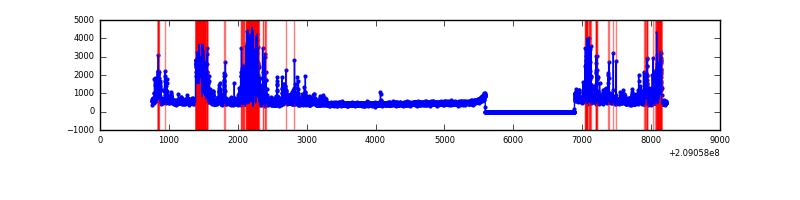 |
| C | 7461 | 6167 | 0 | 0 | 0.00% | 0.00% | 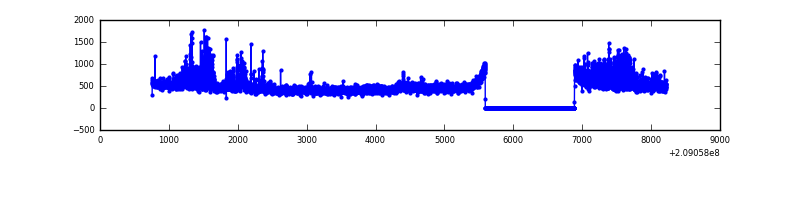 |
| D | 7460 | 6166 | 937 | 937 | 12.56% | 15.20% | 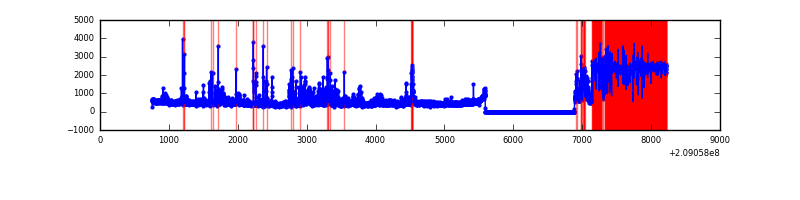 |
Top three noisy pixels from each quadrant. If the there are fewer than three noisy pixels in the level2.evt file, extra rows are filled as -1
| Pixel properties | Quadrant properties | ||||||
|---|---|---|---|---|---|---|---|
| Quadrant | DetID | PixID | Counts | Sigma | Mean | Median | Sigma |
| A | 0 | 50 | 119960 | 815.22 | 730 | 716 | 146.3 |
| A | 0 | 149 | 51522 | 347.34 | 730 | 716 | 146.3 |
| A | 0 | 118 | 48263 | 325.06 | 730 | 716 | 146.3 |
| B | 14 | 167 | 1123105 | 8299.27 | 715 | 698 | 135.2 |
| B | 15 | 204 | 211914 | 1561.77 | 715 | 698 | 135.2 |
| B | 0 | 219 | 183860 | 1354.33 | 715 | 698 | 135.2 |
| C | 8 | 208 | 403959 | 2437.79 | 718 | 722 | 165.4 |
| C | 1 | 3 | 8149 | 44.9 | 718 | 722 | 165.4 |
| C | 13 | 61 | 5940 | 31.55 | 718 | 722 | 165.4 |
| D | 1 | 52 | 2214249 | 14674.12 | 632 | 613 | 150.9 |
| D | 13 | 235 | 289839 | 1917.27 | 632 | 613 | 150.9 |
| D | 2 | 63 | 133507 | 880.95 | 632 | 613 | 150.9 |
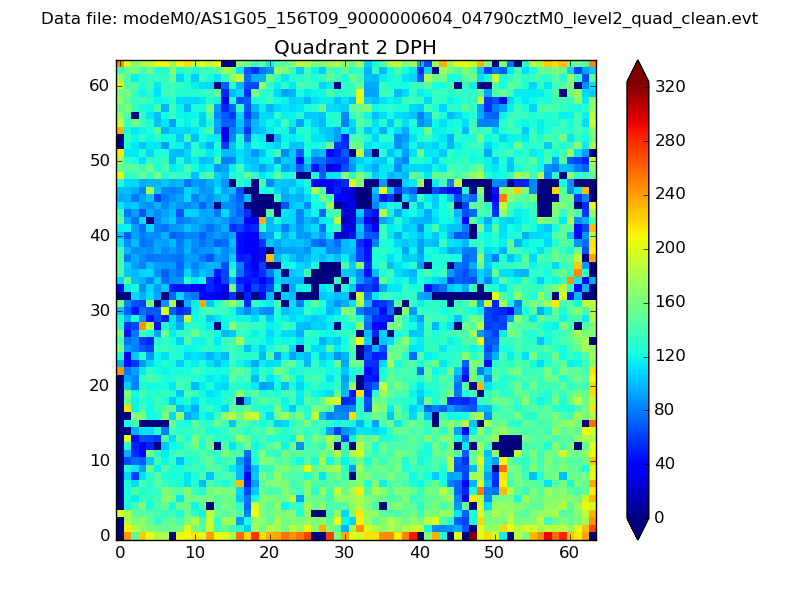
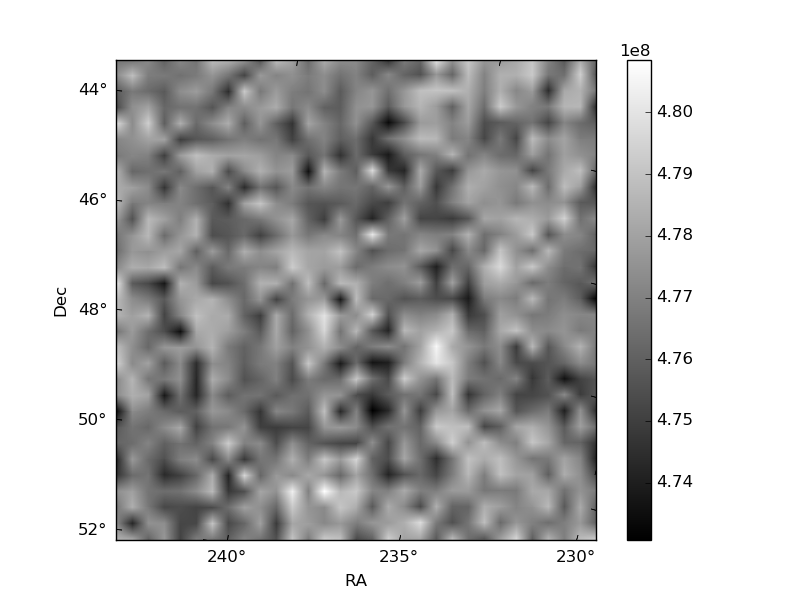
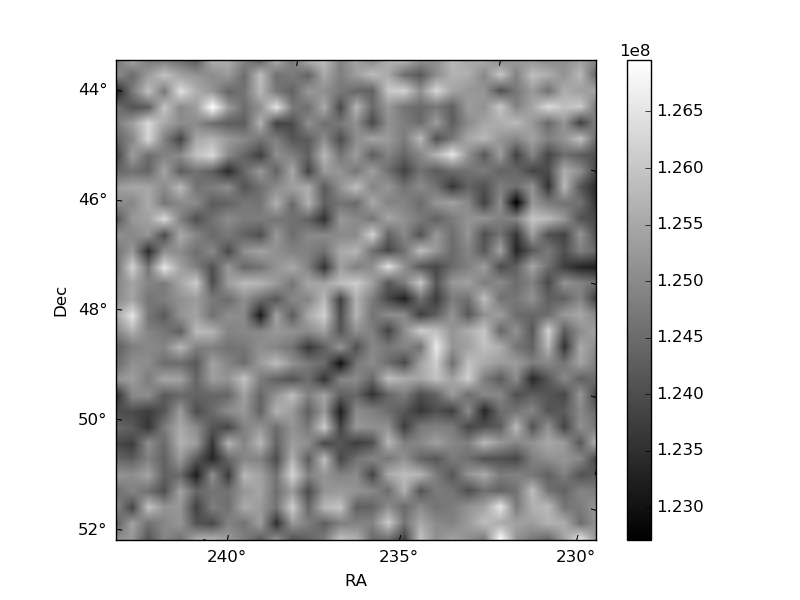
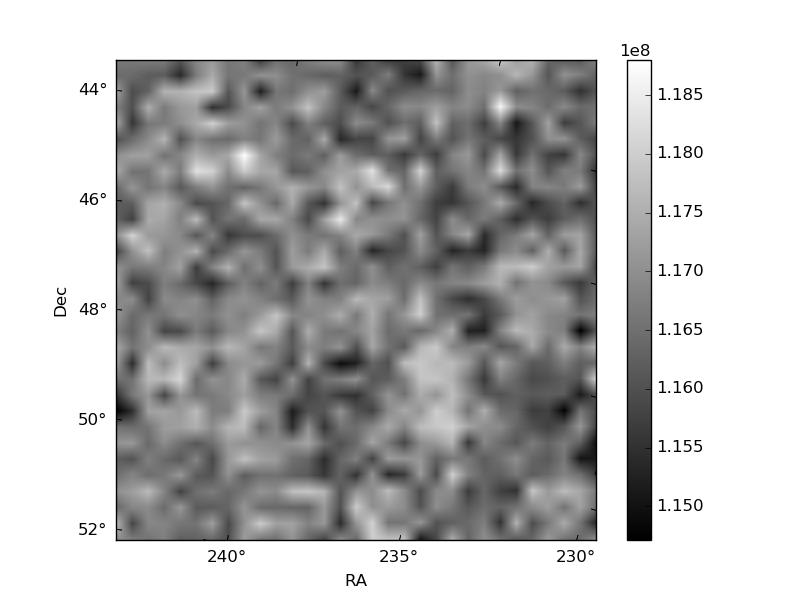
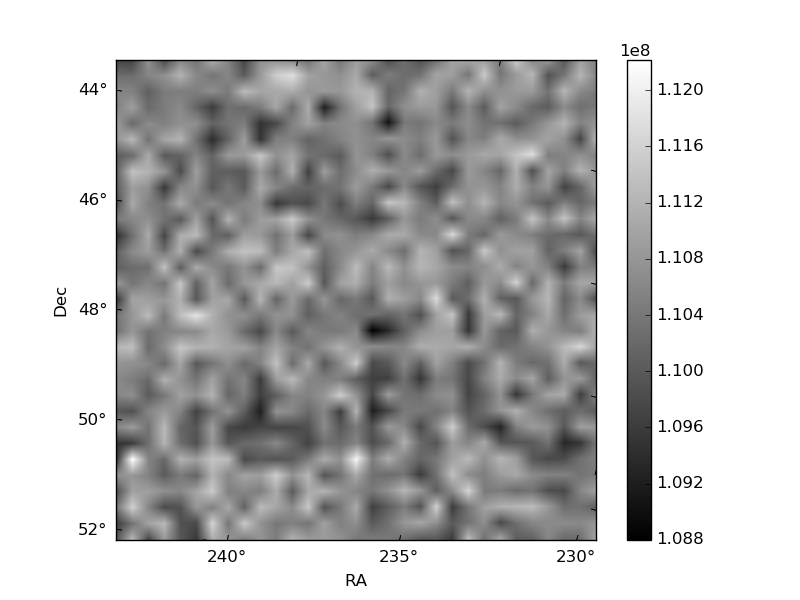
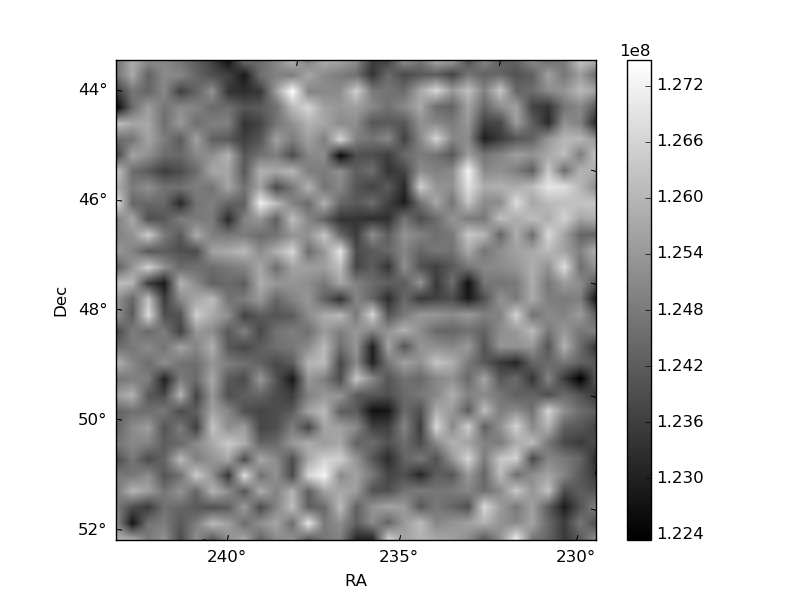
Histogram calculated using DETX and DETY for each event in the final _common_clean file
| Quadrant A | 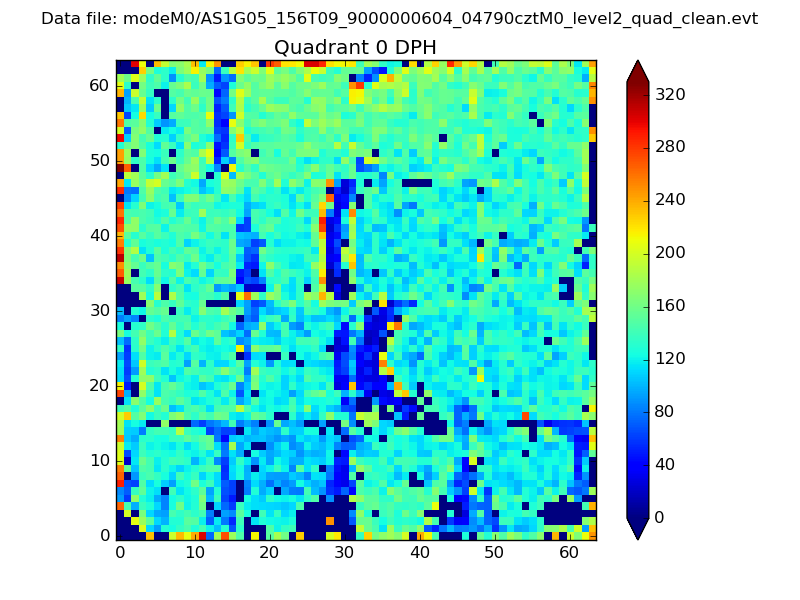 |
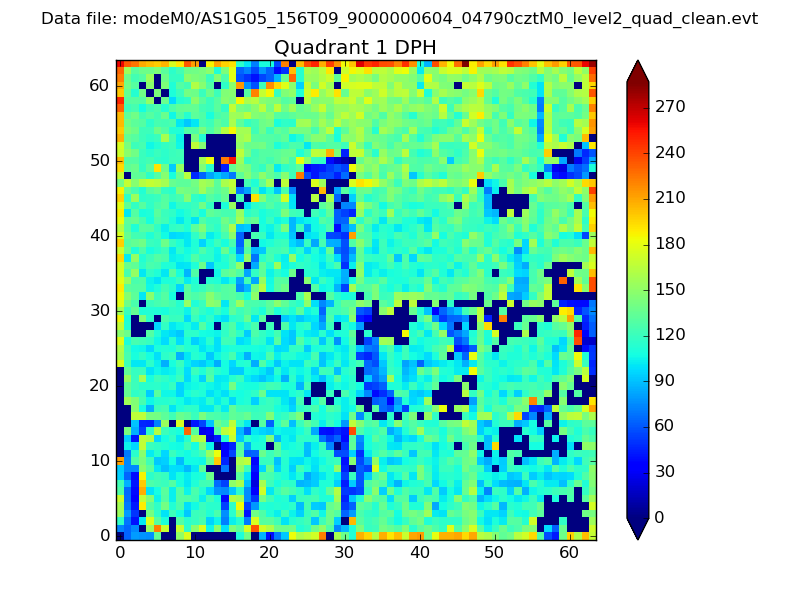 |
Quadrant B |
|---|---|---|---|
| Quadrant D | 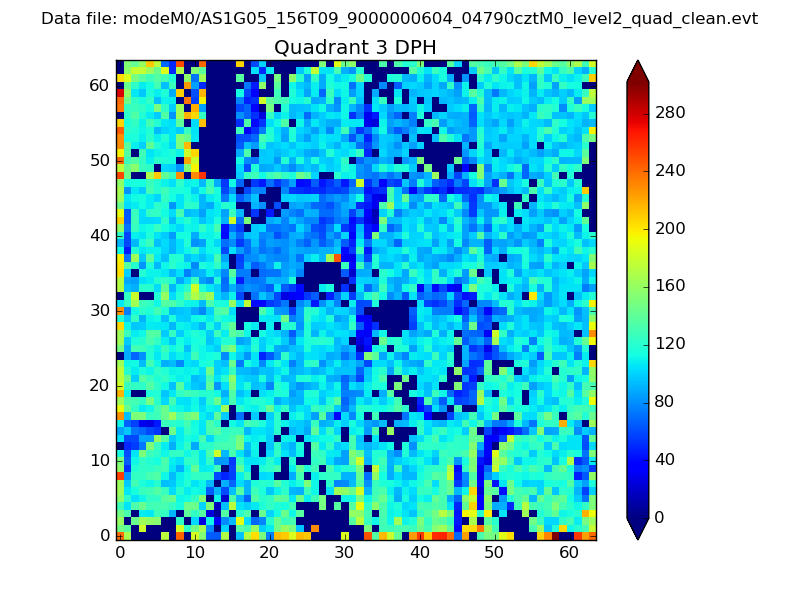 |
 |
Quadrant C |
| Plot type | Count rate plots | Images |
|---|---|---|
| Comparison with Poisson distribution Blue bars denote a histogram of data divided into 1 sec bins. Red curve is a Poisson curve with rate = median count rate of data. |
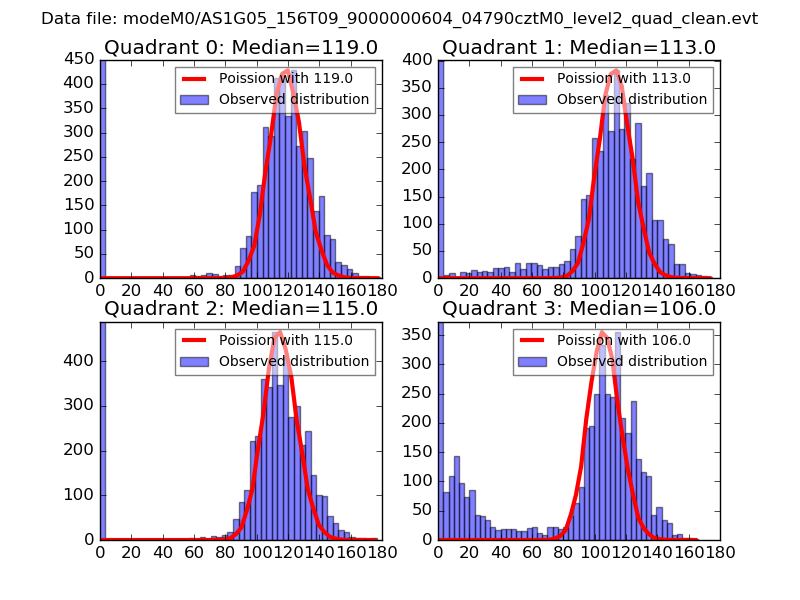 |
 |
| Quadrant-wise count rates Data is divided into 100 sec bins |
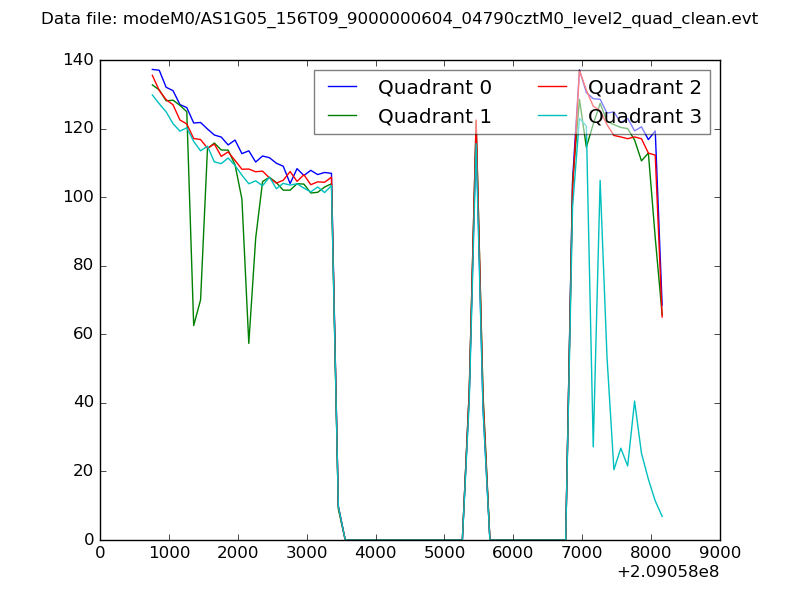 |
|
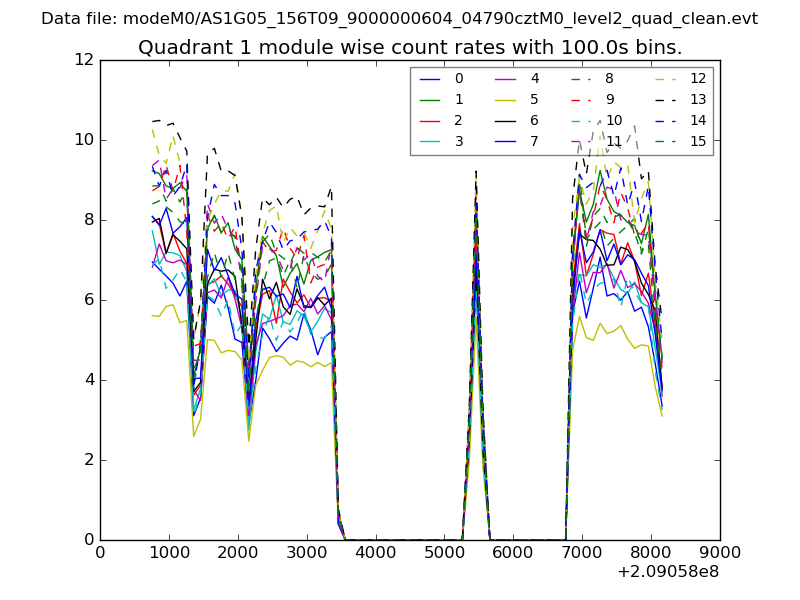
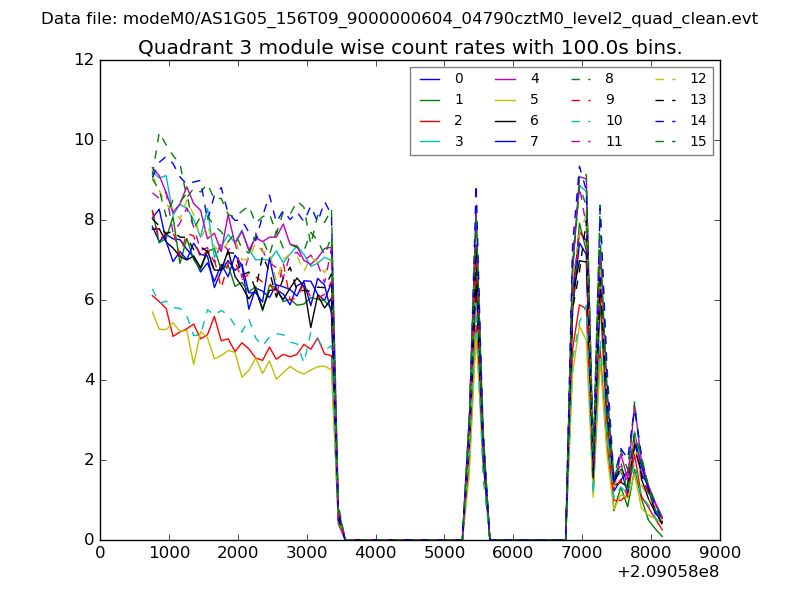
| Module-wise count rates for Quadrant A Data is divided into 100 sec bins |
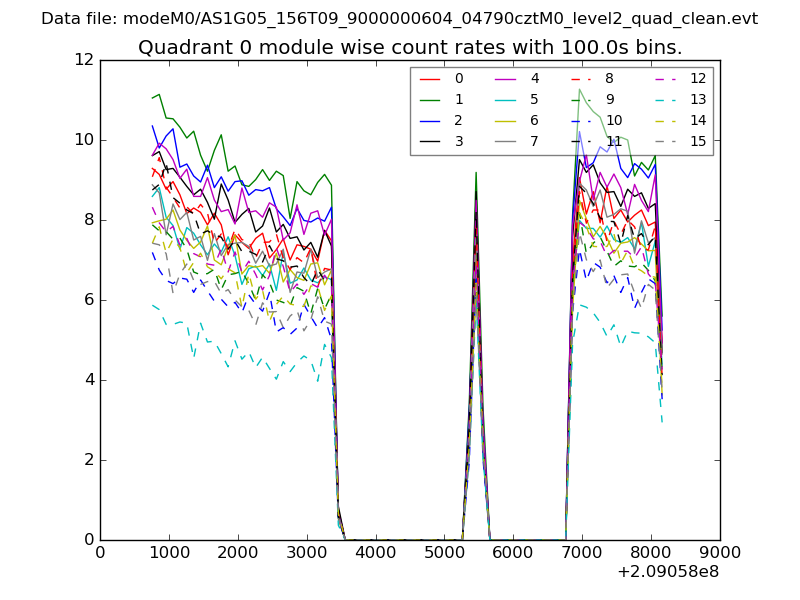 |
 |
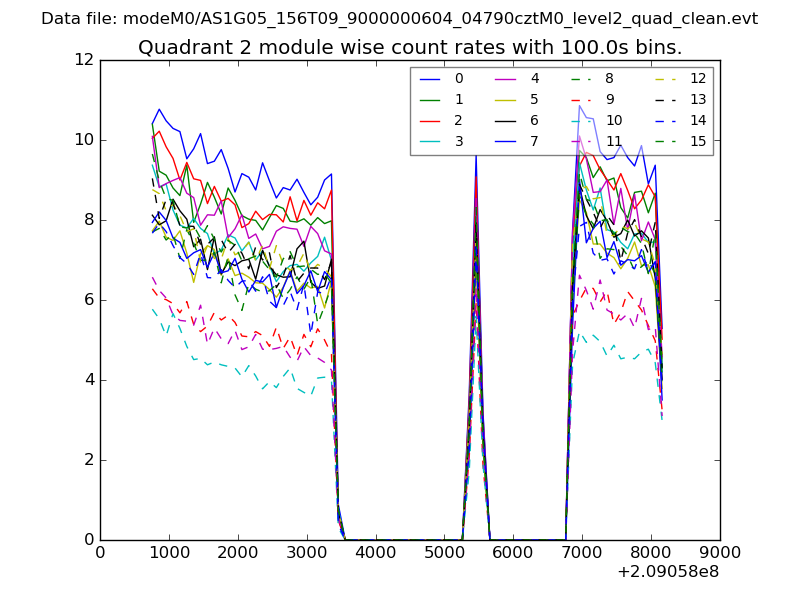
| Module-wise count rates for Quadrant B Data is divided into 100 sec bins |
 |
 |
| Module-wise count rates for Quadrant C Data is divided into 100 sec bins |
 |
 |
| Module-wise count rates for Quadrant D Data is divided into 100 sec bins |
 |
 |
| Parameter | Plot |
|---|---|
| CZT HV Monitor | 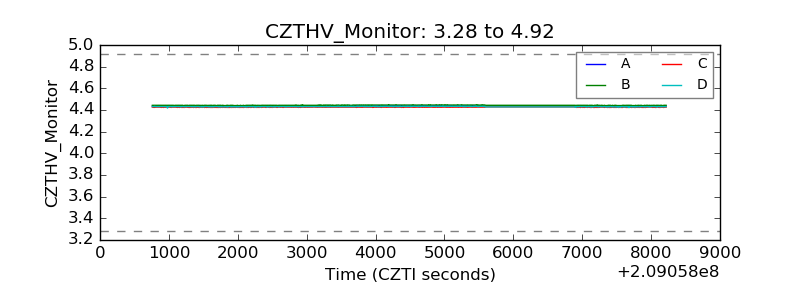 |
| D_VDD | 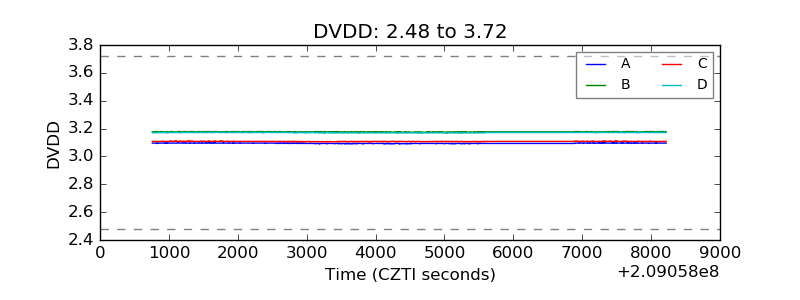 |
| Temperature 1 | 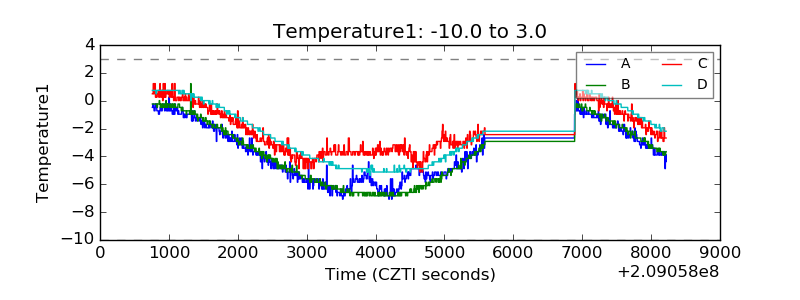 |
| Veto HV Monitor | 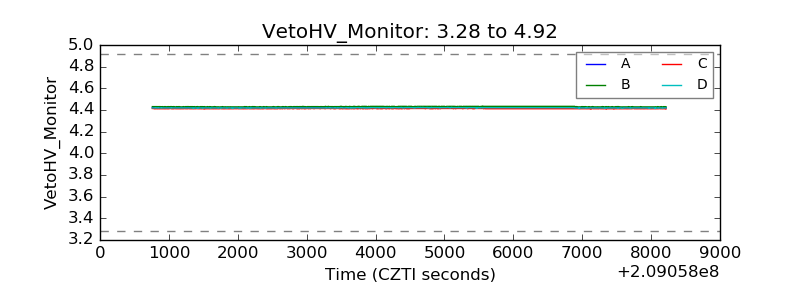 |
| Veto LLD | 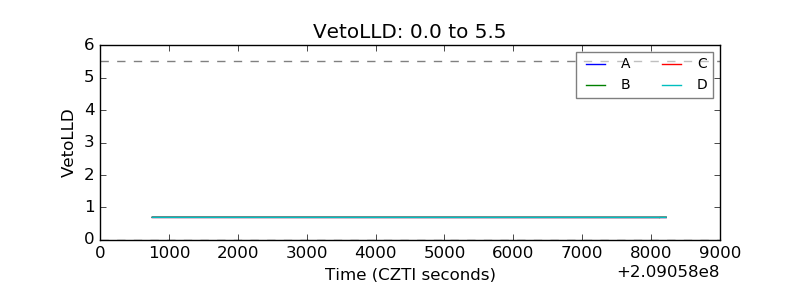 |
| Alpha Counter | 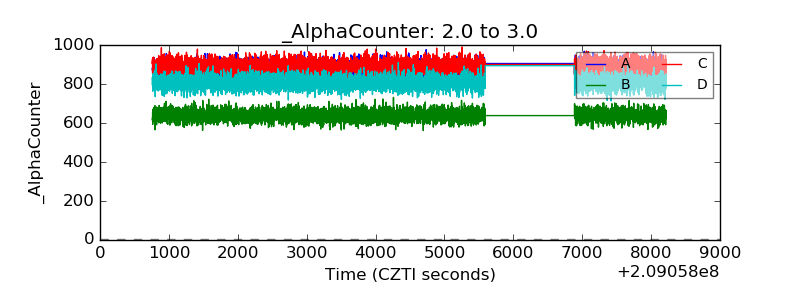 |
| _CPM_Rate | 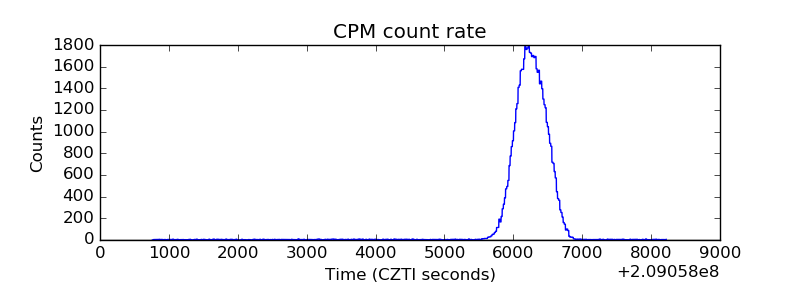 |
| CZT Counter | 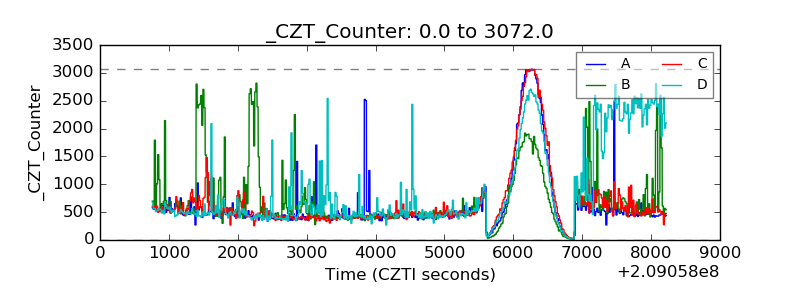 |
| +2.5 Volts monitor |  |
| +5 Volts monitor |  |
| _ROLL_ROT | 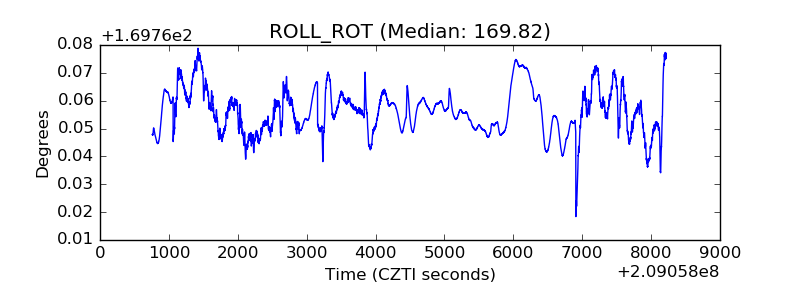 |
| _Roll_DEC | 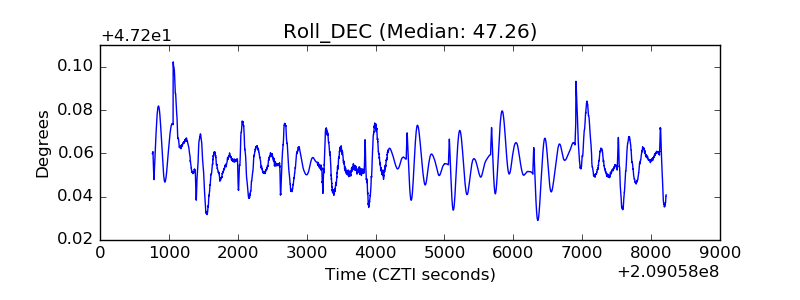 |
| _Roll_RA | 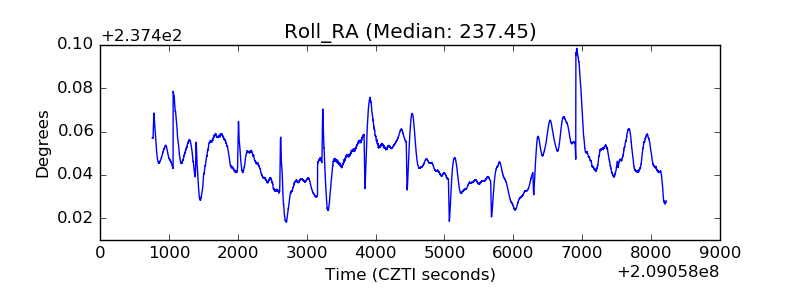 |
| Veto Counter | 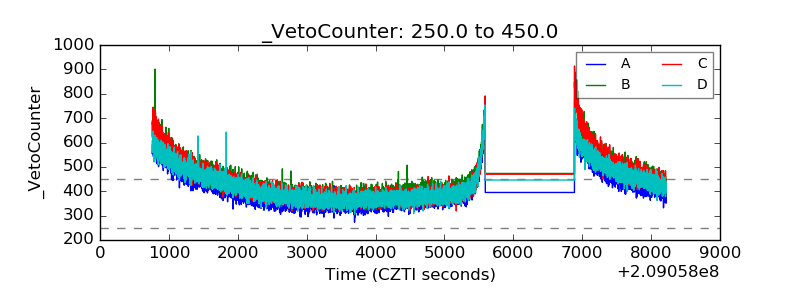 |