| Param | Original file | Final file |
|---|---|---|
| Filename | modeM0/AS1G05_156T09_9000000604_04791cztM0_level2.evt | modeM0/AS1G05_156T09_9000000604_04791cztM0_level2_quad_clean.evt |
| Size (bytes) | 548,317,440 | 76,536,000 |
| Size | 522.9 MB | 73.0 MB |
| Events in quadrant A | 3,254,229 | 502,460 |
| Events in quadrant B | 4,025,907 | 495,199 |
| Events in quadrant C | 3,228,113 | 499,214 |
| Events in quadrant D | 5,672,236 | 382,684 |
| Mode M9 | |||
|---|---|---|---|
| Quadrant | BADHDUFLAG | Total packets | Discarded packets |
| A | 0 | 13 | 0 |
| B | 0 | 13 | 0 |
| C | 0 | 13 | 0 |
| D | 0 | 13 | 0 |
| Mode M0 | |||
|---|---|---|---|
| Quadrant | BADHDUFLAG | Total packets | Discarded packets |
| A | 0 | 13985 | 3 |
| B | 0 | 16143 | 2 |
| C | 0 | 13871 | 2 |
| D | 0 | 21182 | 2 |
| Mode SS | |||
|---|---|---|---|
| Quadrant | BADHDUFLAG | Total packets | Discarded packets |
| A | 0 | 128 | 0 |
| B | 0 | 128 | 0 |
| C | 0 | 128 | 0 |
| D | 0 | 128 | 0 |
| Quadrant | Total seconds | Saturated seconds | Saturation percentage |
|---|---|---|---|
| A | 6263 | 143 | 2.283251% |
| B | 6263 | 173 | 2.762255% |
| C | 6263 | 48 | 0.766406% |
| D | 6264 | 1211 | 19.332695% |
Noise dominated data is calculated using 1-second bins in cleaned event files. If a bin has >2000 counts, and if more than 50% of those come from <1% of pixels, then it is considered to be noise-dominated and hence unusable.
| Quadrant | # 1 sec bins | Bins with >0 counts | Bins with >2000 counts | High rate bins dominated by noise | Noise dominated (total time) | Noise dominated (detector-on time) | Marked lightcurve |
|---|---|---|---|---|---|---|---|
| A | 7553 | 6264 | 83 | 83 | 1.10% | 1.33% | 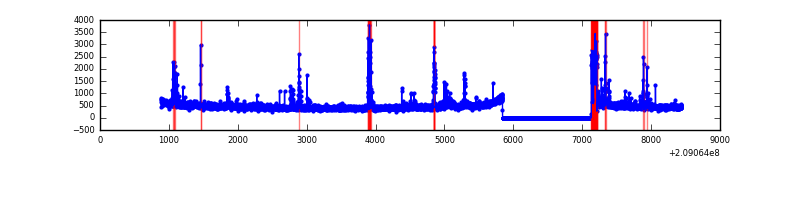 |
| B | 7553 | 6264 | 95 | 95 | 1.26% | 1.52% | 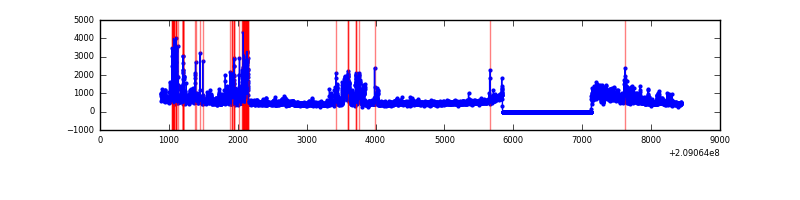 |
| C | 7553 | 6264 | 7 | 7 | 0.09% | 0.11% | 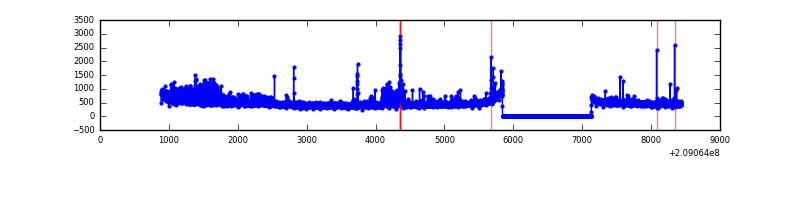 |
| D | 7554 | 6265 | 1086 | 1086 | 14.38% | 17.33% | 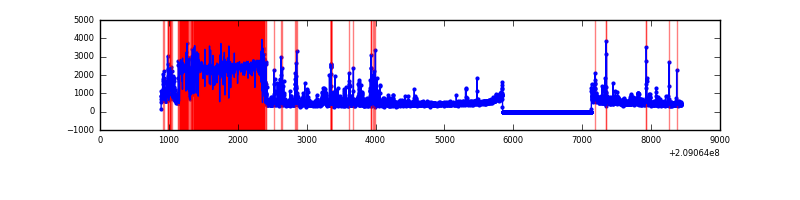 |
Top three noisy pixels from each quadrant. If the there are fewer than three noisy pixels in the level2.evt file, extra rows are filled as -1
| Pixel properties | Quadrant properties | ||||||
|---|---|---|---|---|---|---|---|
| Quadrant | DetID | PixID | Counts | Sigma | Mean | Median | Sigma |
| A | 0 | 50 | 301176 | 2034.66 | 732 | 716 | 147.7 |
| A | 0 | 118 | 83109 | 557.95 | 732 | 716 | 147.7 |
| A | 0 | 149 | 18770 | 122.26 | 732 | 716 | 147.7 |
| B | 8 | 3 | 461346 | 3290.96 | 744 | 727 | 140.0 |
| B | 14 | 167 | 222379 | 1583.62 | 744 | 727 | 140.0 |
| B | 0 | 219 | 171389 | 1219.32 | 744 | 727 | 140.0 |
| C | 8 | 208 | 280673 | 1661.16 | 730 | 733 | 168.5 |
| C | 1 | 16 | 71947 | 422.58 | 730 | 733 | 168.5 |
| C | 1 | 3 | 9078 | 49.52 | 730 | 733 | 168.5 |
| D | 1 | 52 | 2621294 | 17329.4 | 630 | 613 | 151.2 |
| D | 13 | 235 | 233789 | 1541.89 | 630 | 613 | 151.2 |
| D | 2 | 63 | 134690 | 886.59 | 630 | 613 | 151.2 |
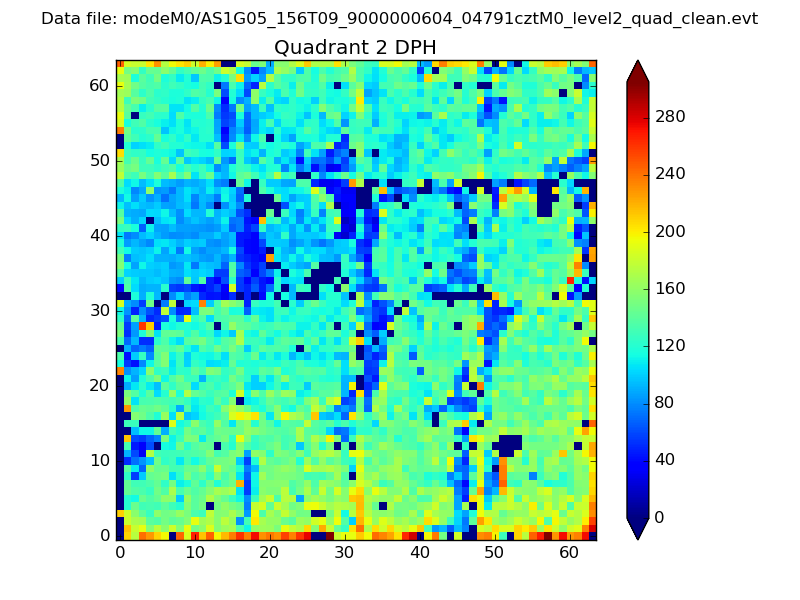
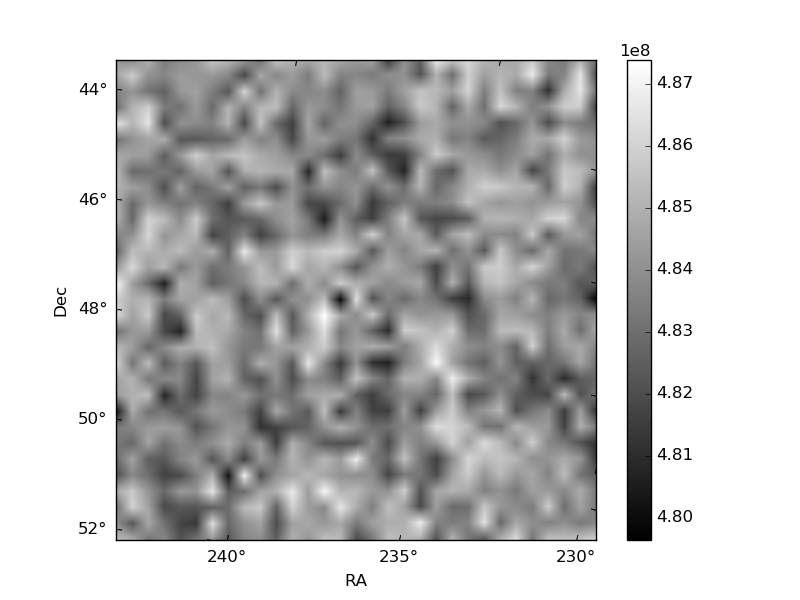
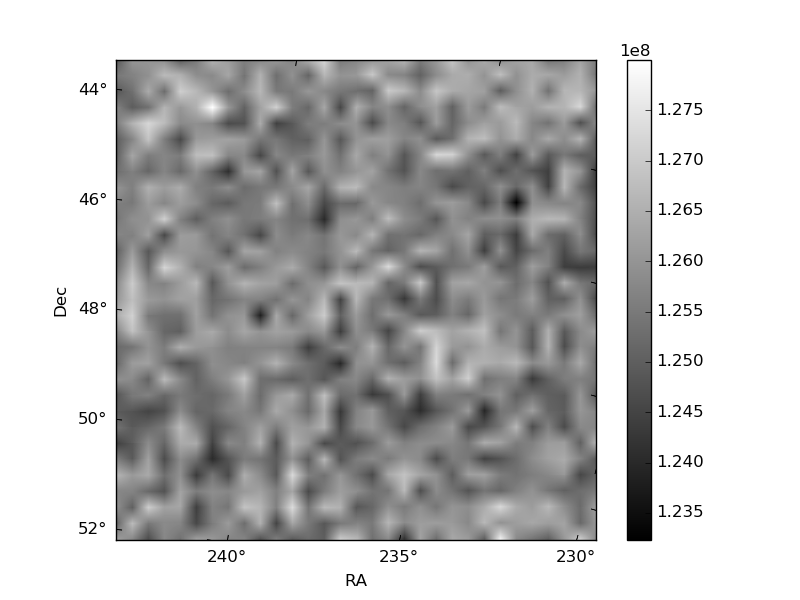
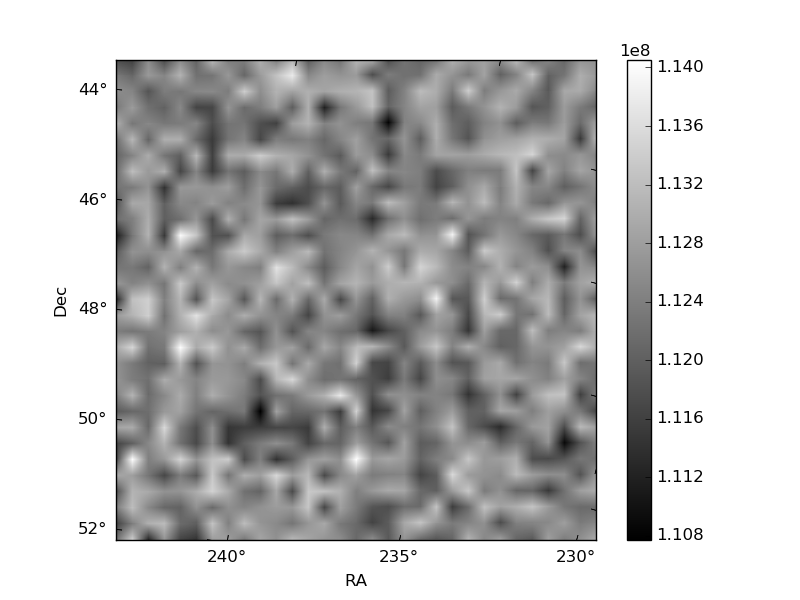
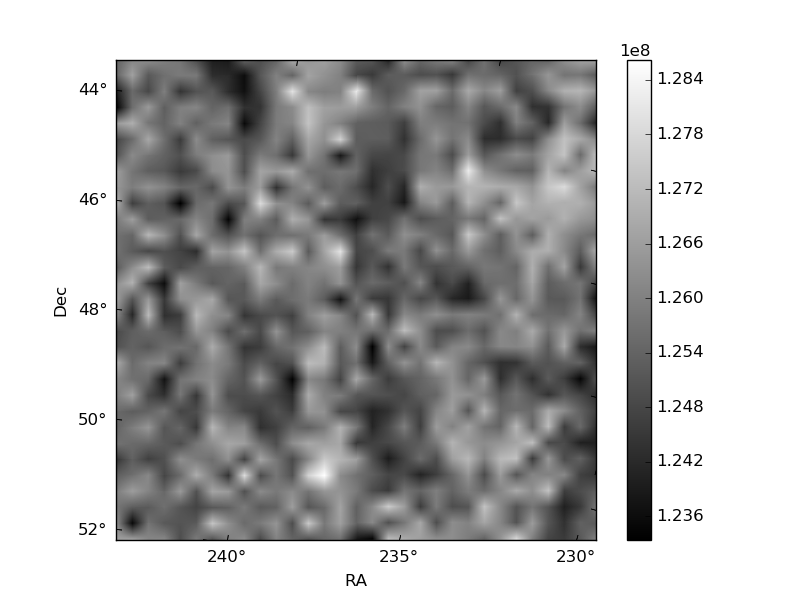
Histogram calculated using DETX and DETY for each event in the final _common_clean file
| Quadrant A | 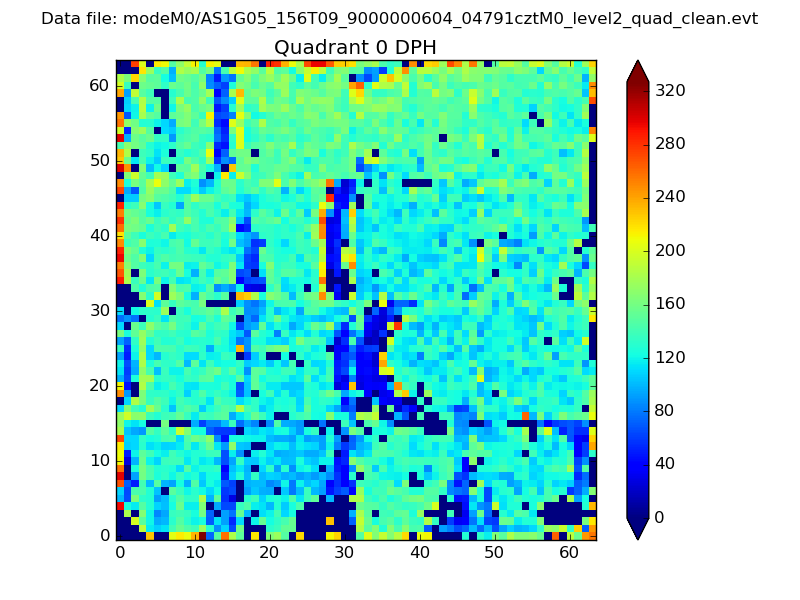 |
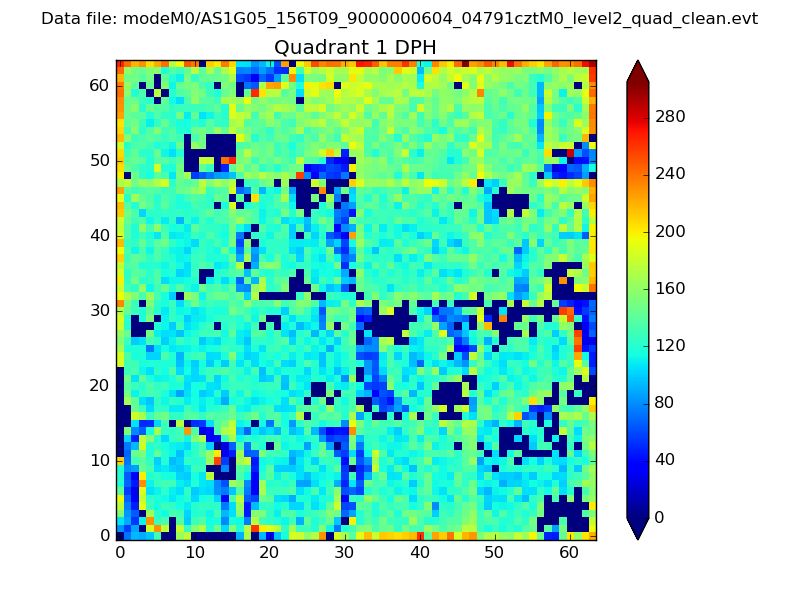 |
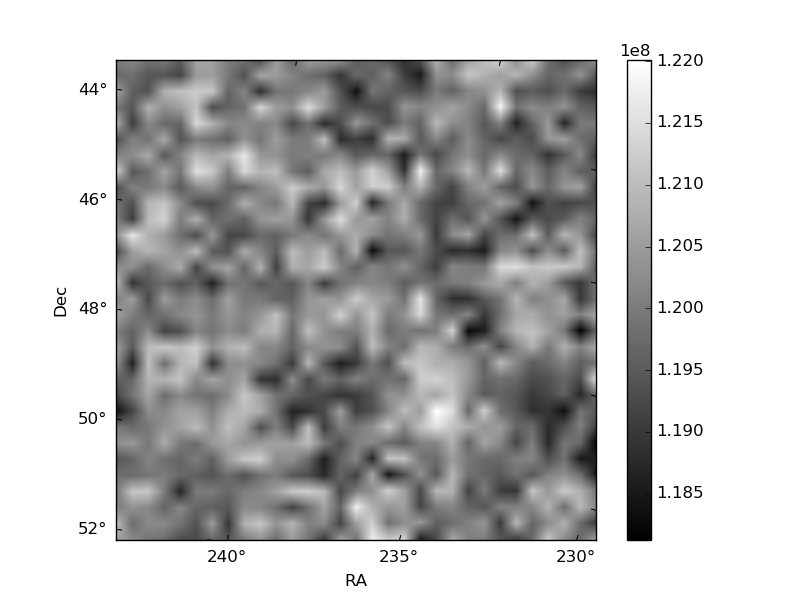
Quadrant B |
|---|---|---|---|
| Quadrant D | 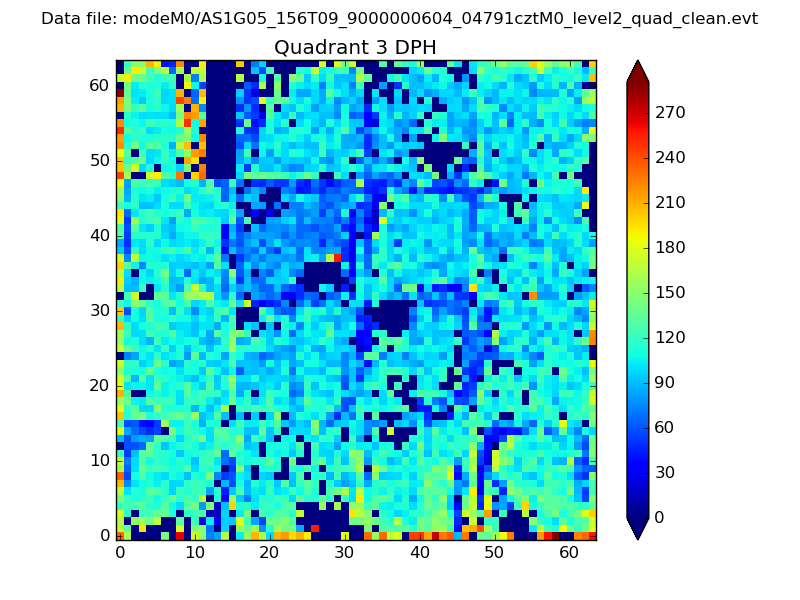 |
 |
Quadrant C |
| Plot type | Count rate plots | Images |
|---|---|---|
| Comparison with Poisson distribution Blue bars denote a histogram of data divided into 1 sec bins. Red curve is a Poisson curve with rate = median count rate of data. |
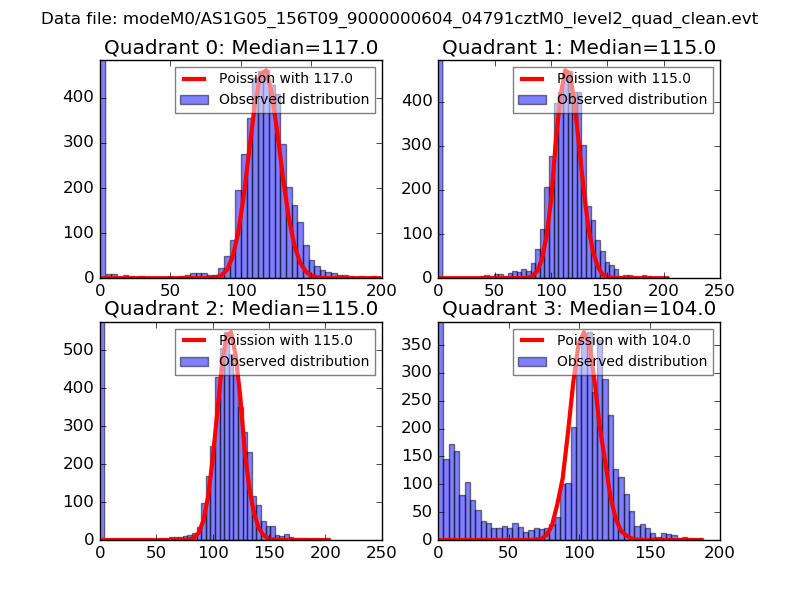 |
 |
| Quadrant-wise count rates Data is divided into 100 sec bins |
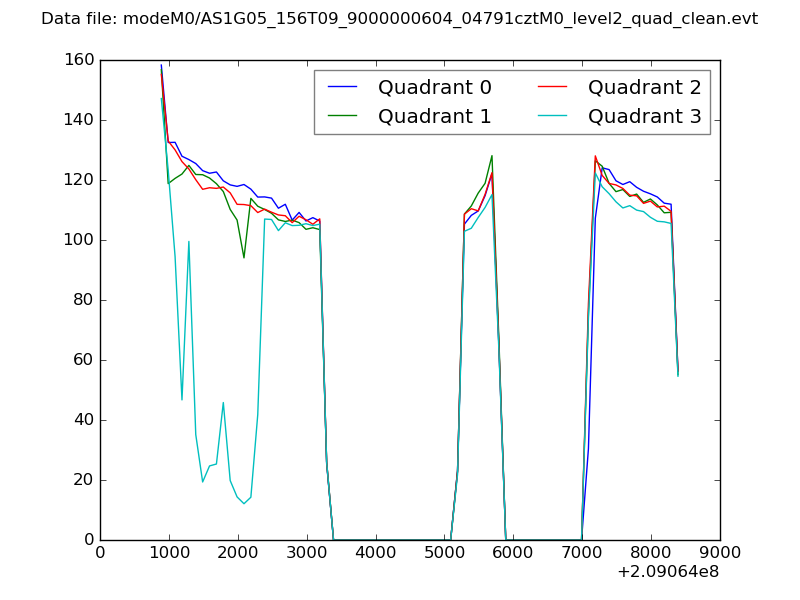 |
|
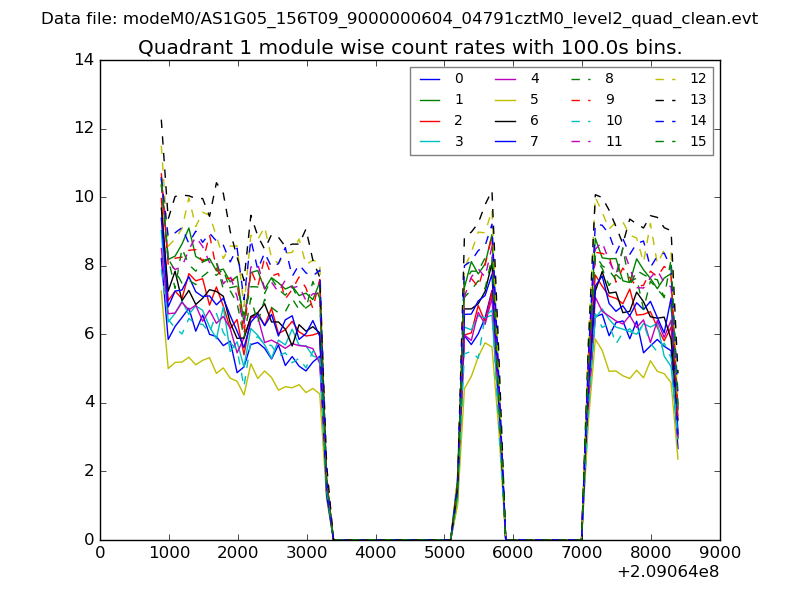
| Module-wise count rates for Quadrant A Data is divided into 100 sec bins |
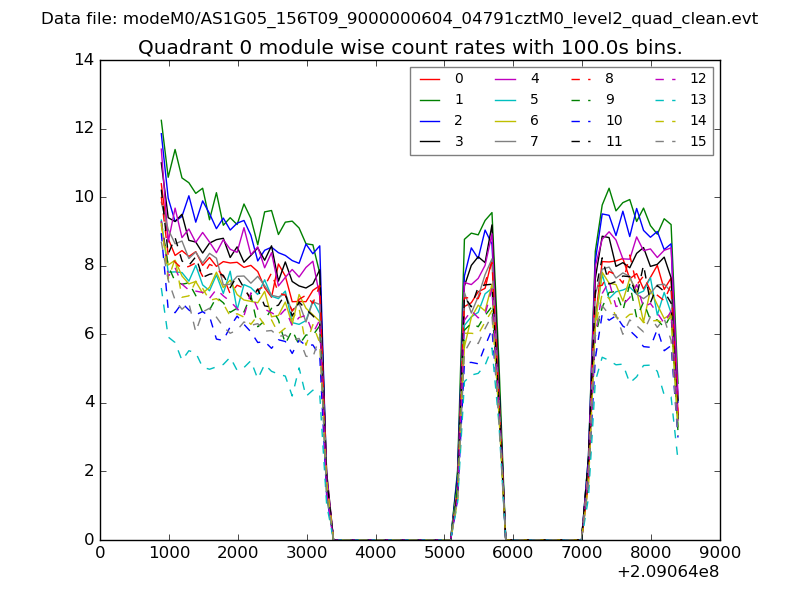 |
 |
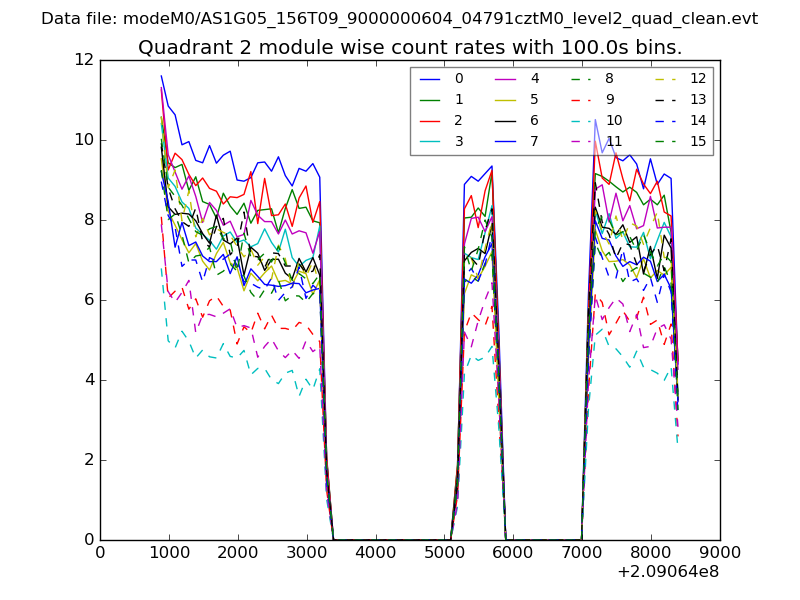
| Module-wise count rates for Quadrant B Data is divided into 100 sec bins |
 |
 |
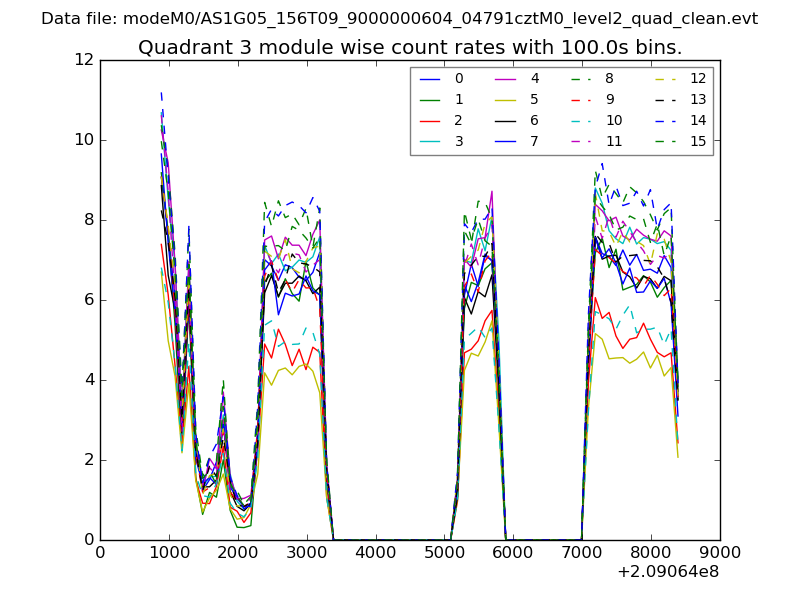
| Module-wise count rates for Quadrant C Data is divided into 100 sec bins |
 |
 |
| Module-wise count rates for Quadrant D Data is divided into 100 sec bins |
 |
 |
| Parameter | Plot |
|---|---|
| CZT HV Monitor | 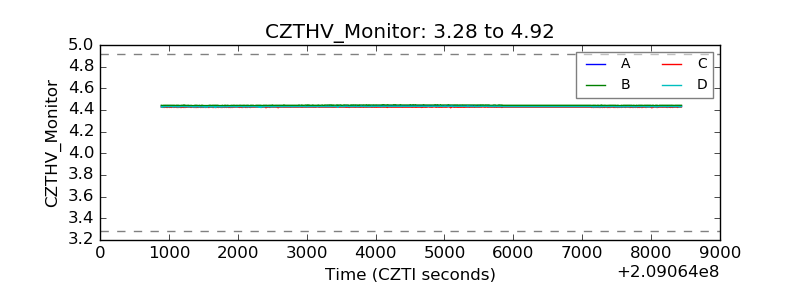 |
| D_VDD | 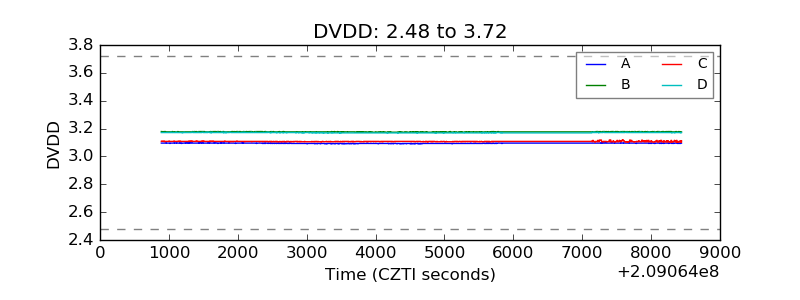 |
| Temperature 1 | 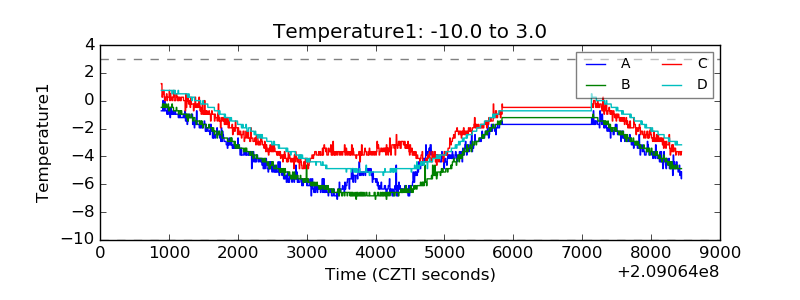 |
| Veto HV Monitor | 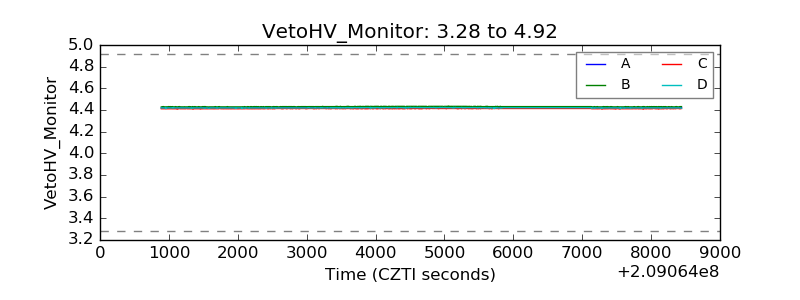 |
| Veto LLD | 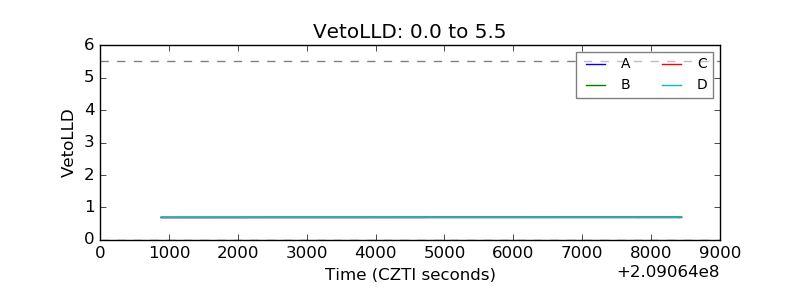 |
| Alpha Counter | 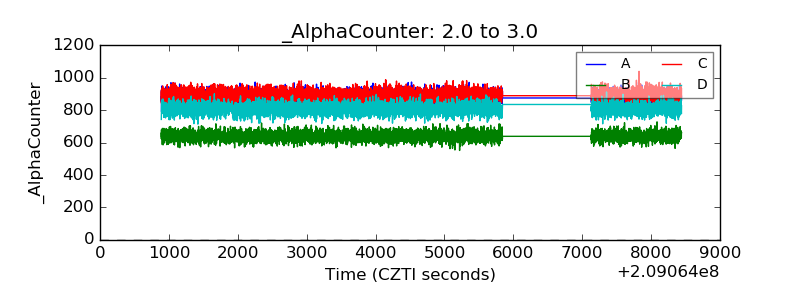 |
| _CPM_Rate | 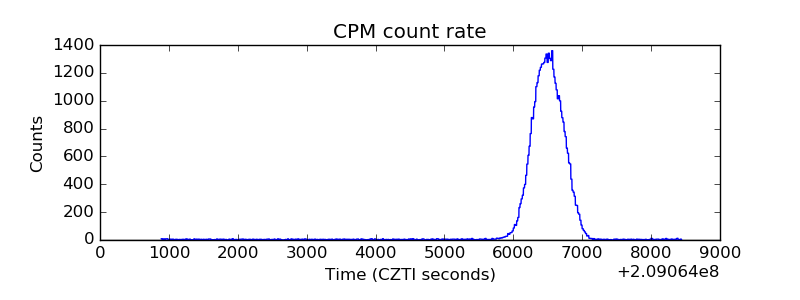 |
| CZT Counter | 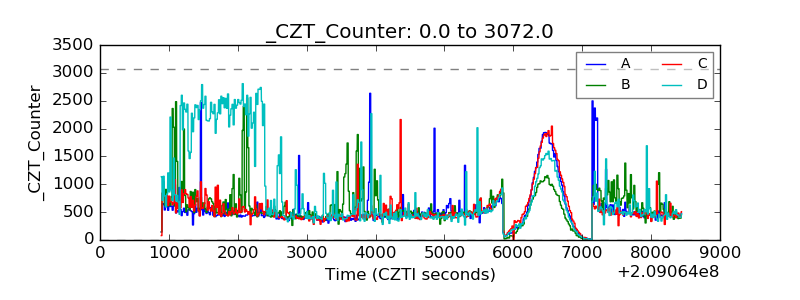 |
| +2.5 Volts monitor | 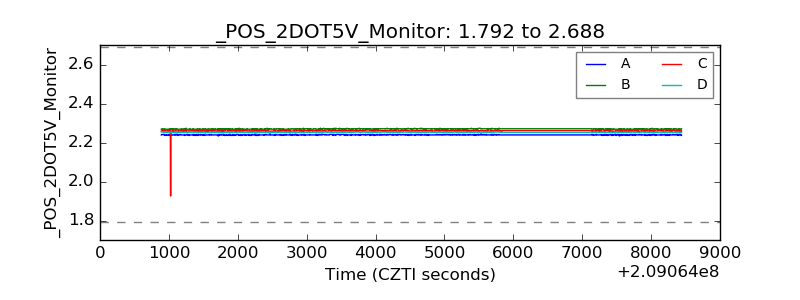 |
| +5 Volts monitor | 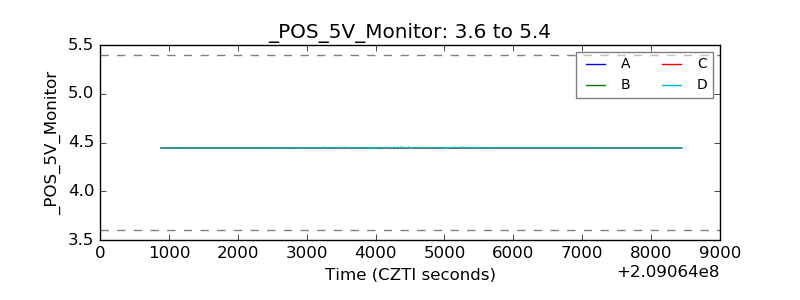 |
| _ROLL_ROT | 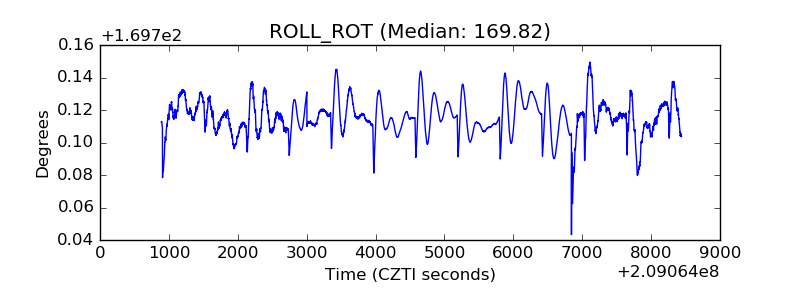 |
| _Roll_DEC | 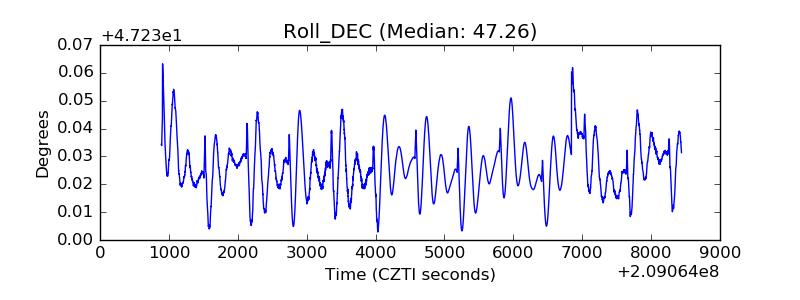 |
| _Roll_RA | 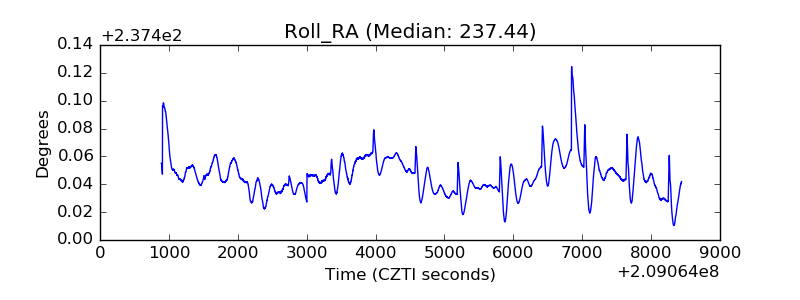 |
| Veto Counter | 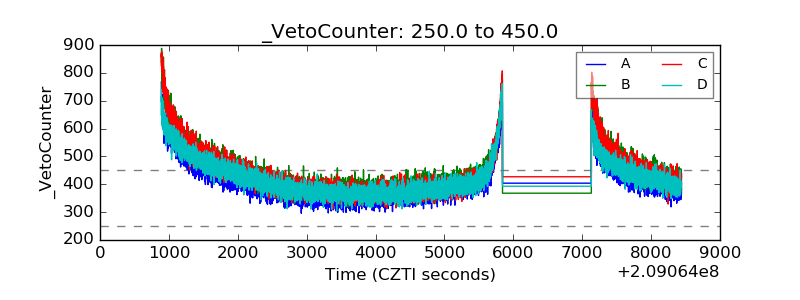 |