| Param | Original file | Final file |
|---|---|---|
| Filename | modeM0/AS1G05_156T09_9000000604_04792cztM0_level2.evt | modeM0/AS1G05_156T09_9000000604_04792cztM0_level2_quad_clean.evt |
| Size (bytes) | 443,070,720 | 75,919,680 |
| Size | 422.5 MB | 72.4 MB |
| Events in quadrant A | 3,125,460 | 472,210 |
| Events in quadrant B | 3,604,259 | 470,475 |
| Events in quadrant C | 2,951,306 | 471,497 |
| Events in quadrant D | 3,315,943 | 451,880 |
| Mode M9 | |||
|---|---|---|---|
| Quadrant | BADHDUFLAG | Total packets | Discarded packets |
| A | 0 | 17 | 0 |
| B | 0 | 17 | 0 |
| C | 0 | 17 | 0 |
| D | 0 | 18 | 0 |
| Mode M0 | |||
|---|---|---|---|
| Quadrant | BADHDUFLAG | Total packets | Discarded packets |
| A | 0 | 13618 | 3 |
| B | 0 | 14895 | 2 |
| C | 0 | 12999 | 2 |
| D | 0 | 14267 | 2 |
| Mode SS | |||
|---|---|---|---|
| Quadrant | BADHDUFLAG | Total packets | Discarded packets |
| A | 0 | 126 | 0 |
| B | 0 | 126 | 0 |
| C | 0 | 126 | 0 |
| D | 0 | 126 | 0 |
| Quadrant | Total seconds | Saturated seconds | Saturation percentage |
|---|---|---|---|
| A | 6202 | 120 | 1.934860% |
| B | 6202 | 68 | 1.096421% |
| C | 6202 | 13 | 0.209610% |
| D | 6202 | 37 | 0.596582% |
Noise dominated data is calculated using 1-second bins in cleaned event files. If a bin has >2000 counts, and if more than 50% of those come from <1% of pixels, then it is considered to be noise-dominated and hence unusable.
| Quadrant | # 1 sec bins | Bins with >0 counts | Bins with >2000 counts | High rate bins dominated by noise | Noise dominated (total time) | Noise dominated (detector-on time) | Marked lightcurve |
|---|---|---|---|---|---|---|---|
| A | 7477 | 6203 | 90 | 90 | 1.20% | 1.45% | 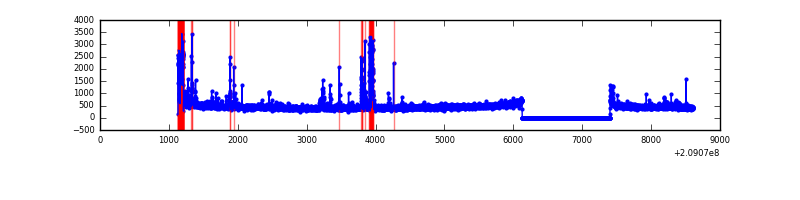 |
| B | 7477 | 6203 | 28 | 28 | 0.37% | 0.45% | 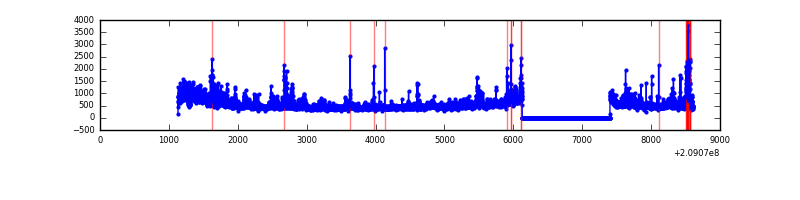 |
| C | 7477 | 6203 | 2 | 2 | 0.03% | 0.03% | 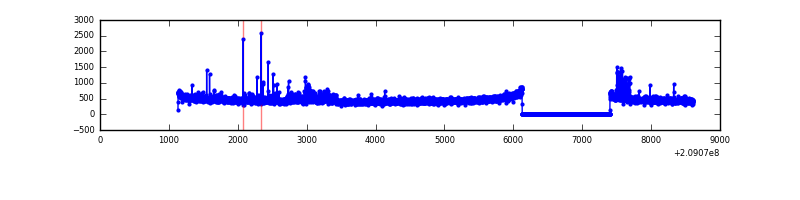 |
| D | 7477 | 6203 | 19 | 19 | 0.25% | 0.31% | 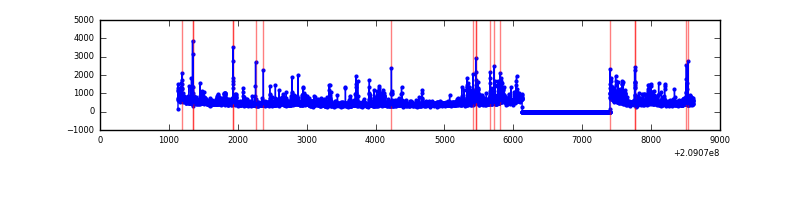 |
Top three noisy pixels from each quadrant. If the there are fewer than three noisy pixels in the level2.evt file, extra rows are filled as -1
| Pixel properties | Quadrant properties | ||||||
|---|---|---|---|---|---|---|---|
| Quadrant | DetID | PixID | Counts | Sigma | Mean | Median | Sigma |
| A | 0 | 50 | 306034 | 2167.08 | 701 | 688 | 140.9 |
| A | 0 | 118 | 63028 | 442.43 | 701 | 688 | 140.9 |
| A | 8 | 15 | 29558 | 204.89 | 701 | 688 | 140.9 |
| B | 8 | 3 | 387088 | 2863.72 | 721 | 705 | 134.9 |
| B | 10 | 16 | 165746 | 1223.22 | 721 | 705 | 134.9 |
| B | 15 | 204 | 110738 | 815.52 | 721 | 705 | 134.9 |
| C | 8 | 208 | 144725 | 886.68 | 701 | 703 | 162.4 |
| C | 1 | 16 | 32261 | 194.29 | 701 | 703 | 162.4 |
| C | 8 | 128 | 13086 | 76.24 | 701 | 703 | 162.4 |
| D | 2 | 136 | 197150 | 1171.66 | 692 | 671 | 167.7 |
| D | 13 | 235 | 155142 | 921.15 | 692 | 671 | 167.7 |
| D | 2 | 63 | 71913 | 424.83 | 692 | 671 | 167.7 |
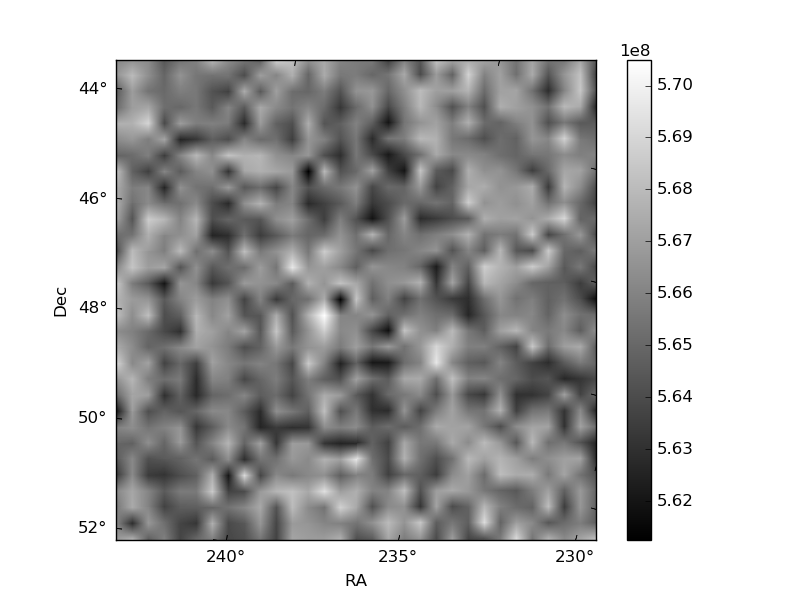
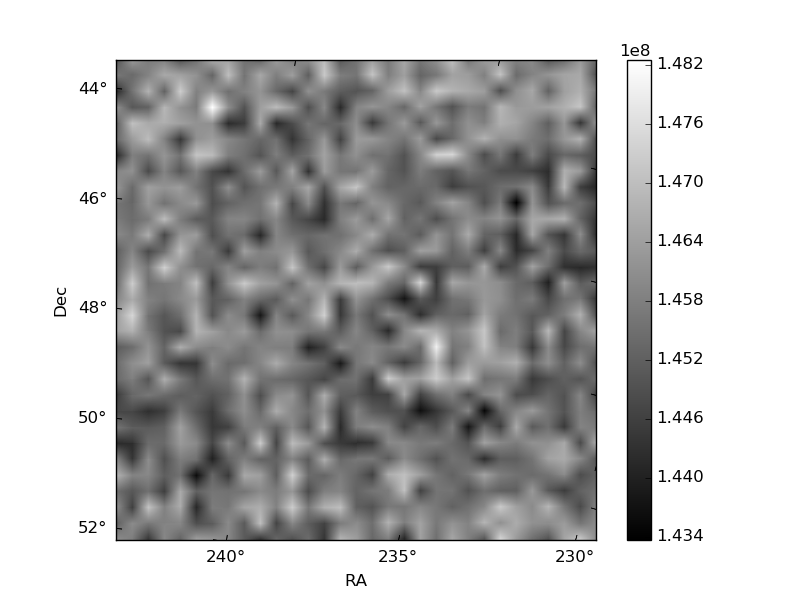
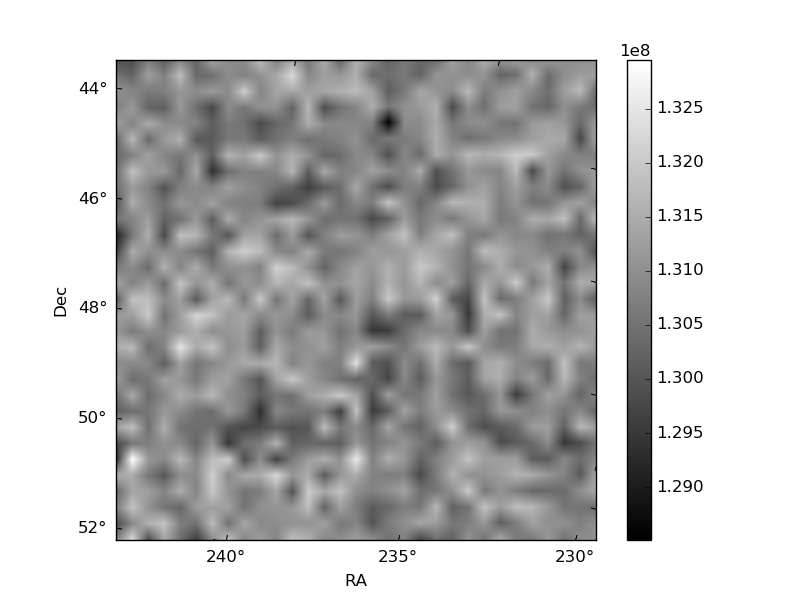
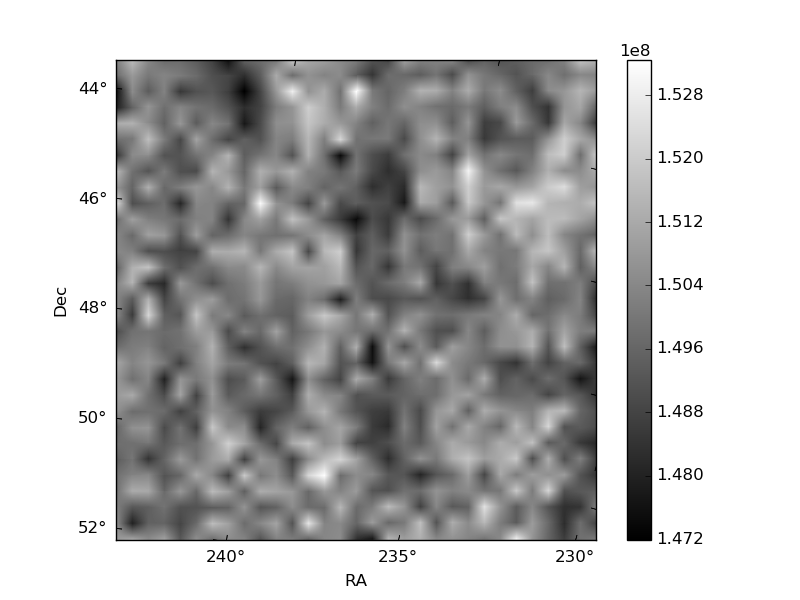
Histogram calculated using DETX and DETY for each event in the final _common_clean file
| Quadrant A | 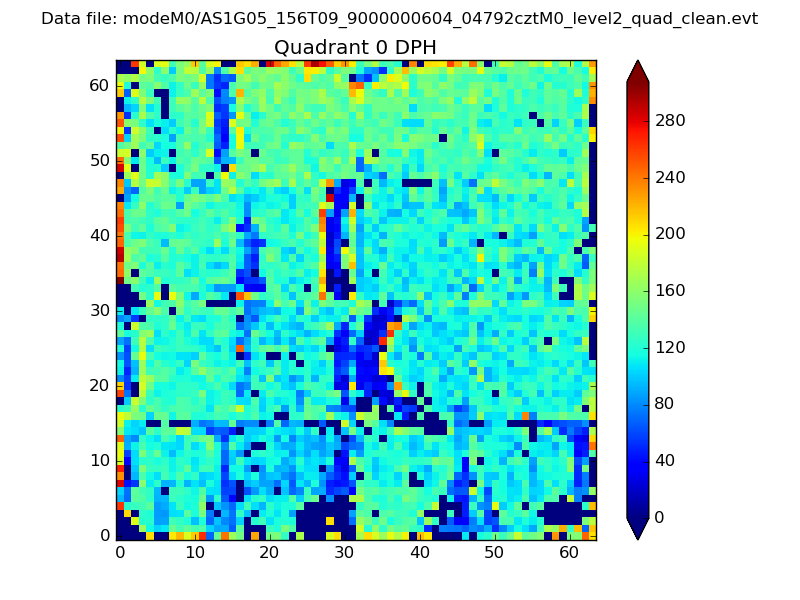 |
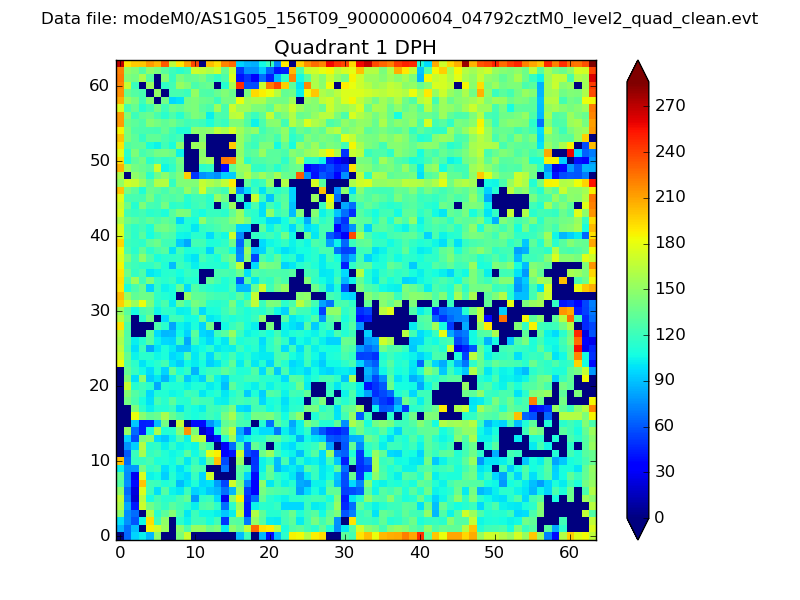 |
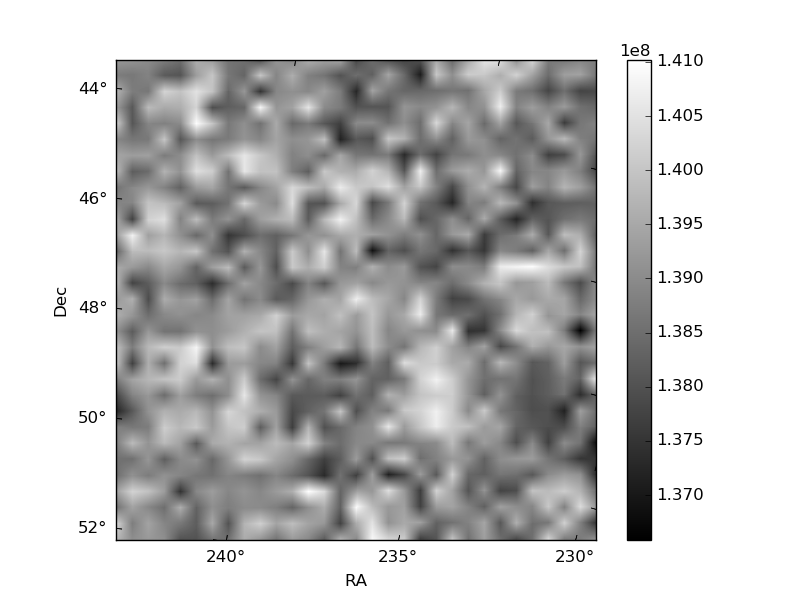
Quadrant B |
|---|---|---|---|
| Quadrant D | 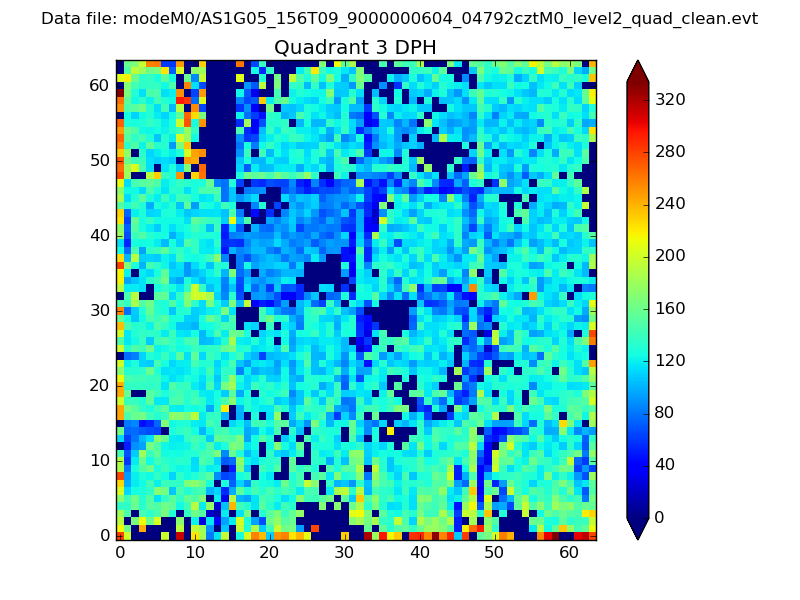 |
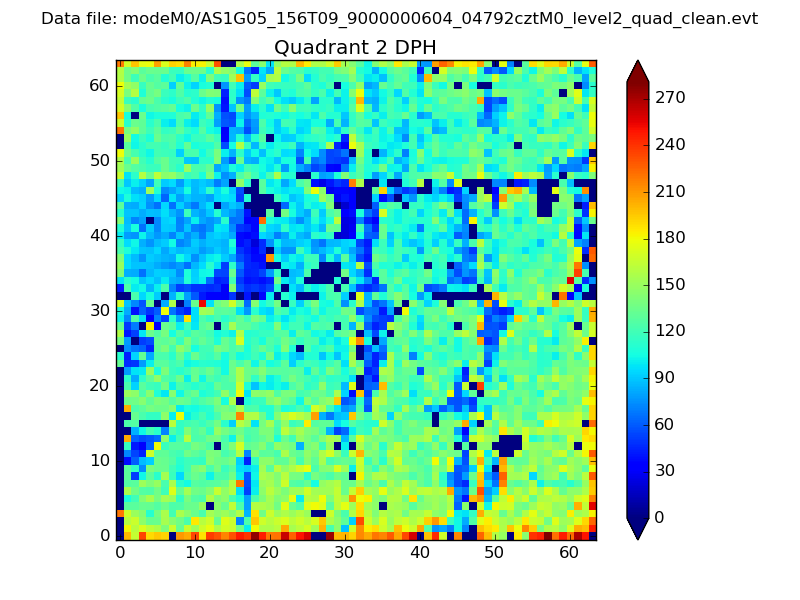 |
Quadrant C |
| Plot type | Count rate plots | Images |
|---|---|---|
| Comparison with Poisson distribution Blue bars denote a histogram of data divided into 1 sec bins. Red curve is a Poisson curve with rate = median count rate of data. |
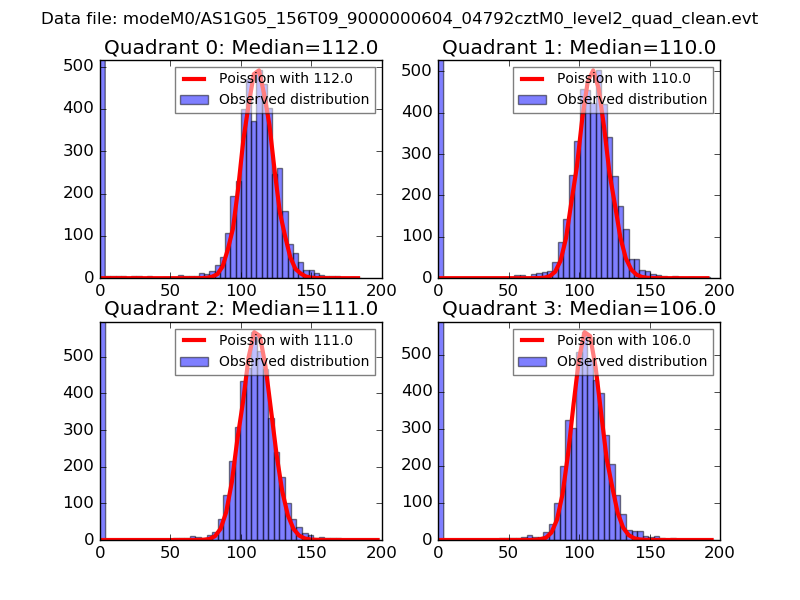 |
 |
| Quadrant-wise count rates Data is divided into 100 sec bins |
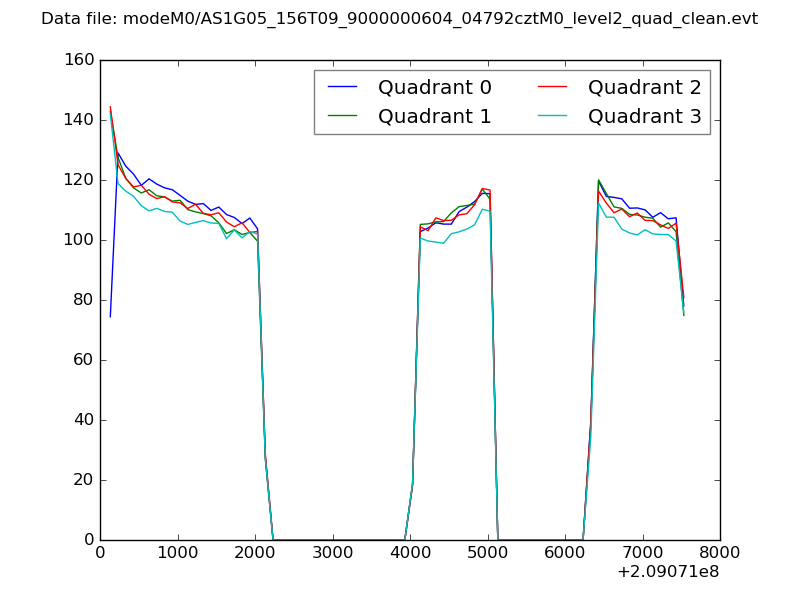 |
|
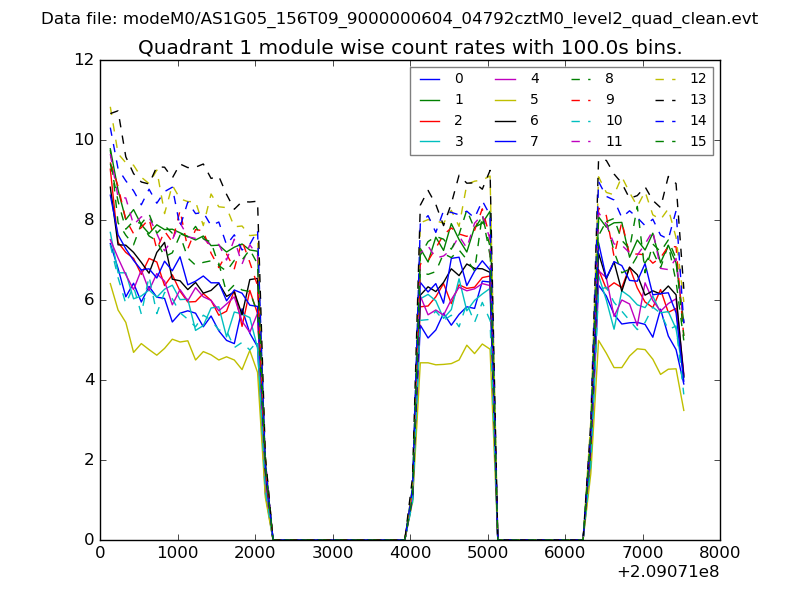
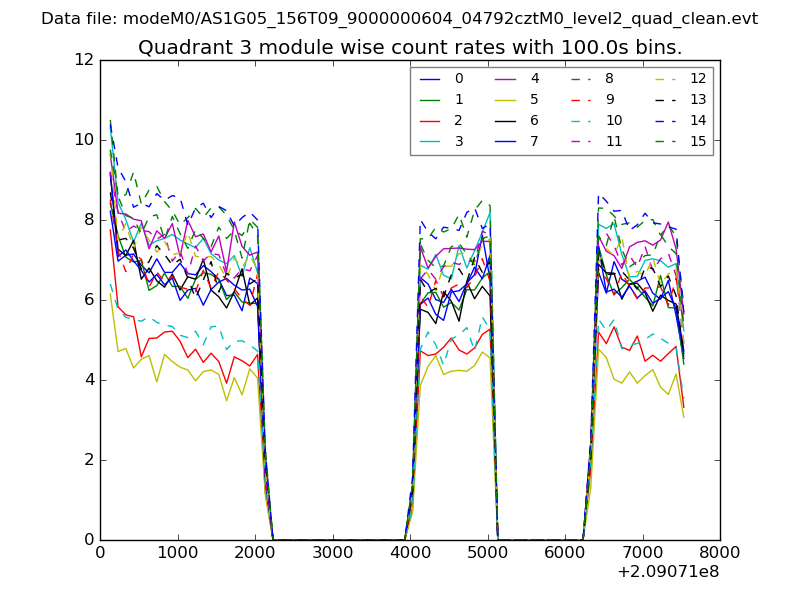
| Module-wise count rates for Quadrant A Data is divided into 100 sec bins |
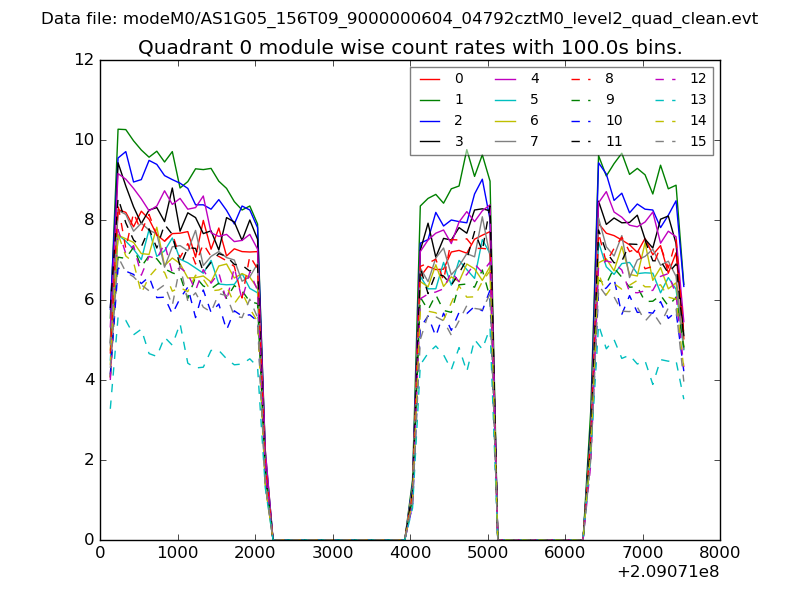 |
 |
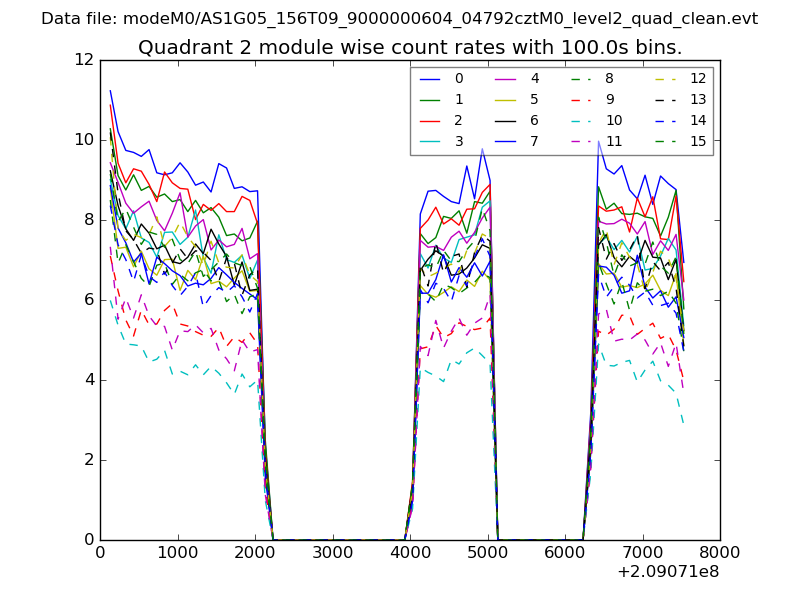
| Module-wise count rates for Quadrant B Data is divided into 100 sec bins |
 |
 |
| Module-wise count rates for Quadrant C Data is divided into 100 sec bins |
 |
 |
| Module-wise count rates for Quadrant D Data is divided into 100 sec bins |
 |
 |
| Parameter | Plot |
|---|---|
| CZT HV Monitor | 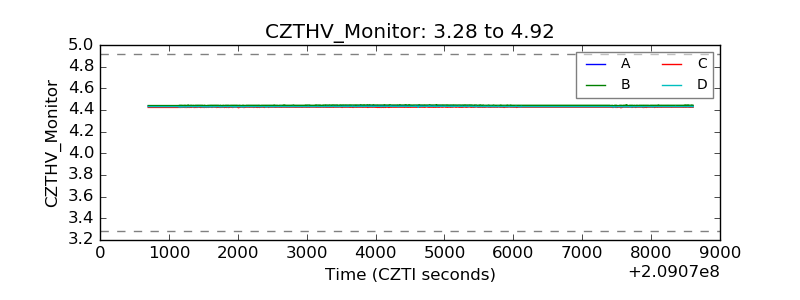 |
| D_VDD | 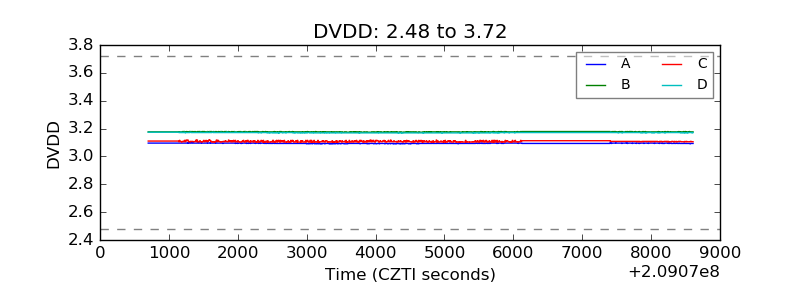 |
| Temperature 1 | 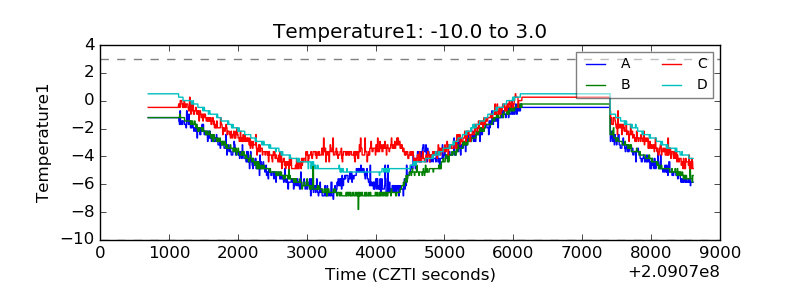 |
| Veto HV Monitor | 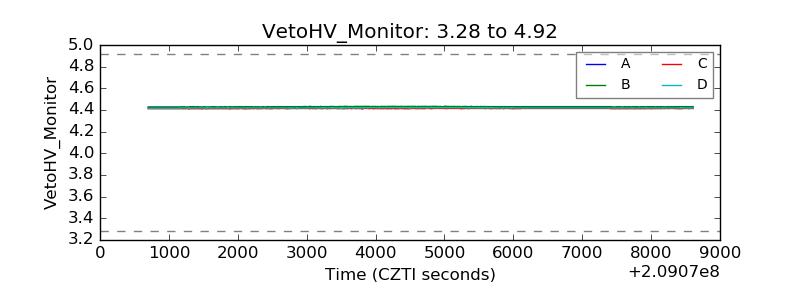 |
| Veto LLD | 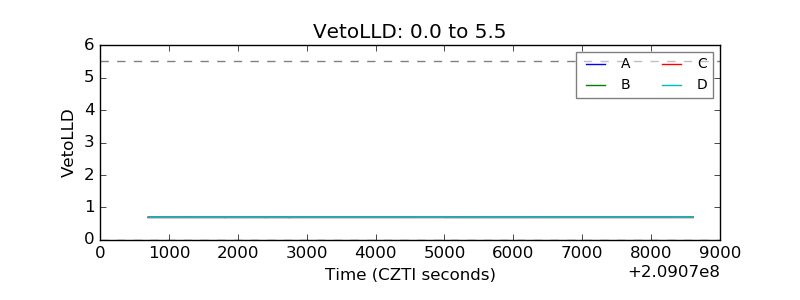 |
| Alpha Counter | 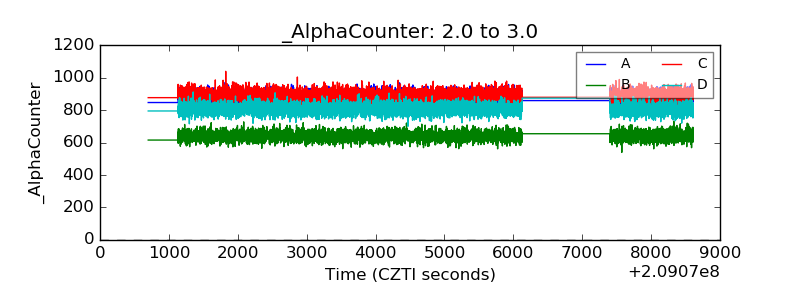 |
| _CPM_Rate |  |
| CZT Counter | 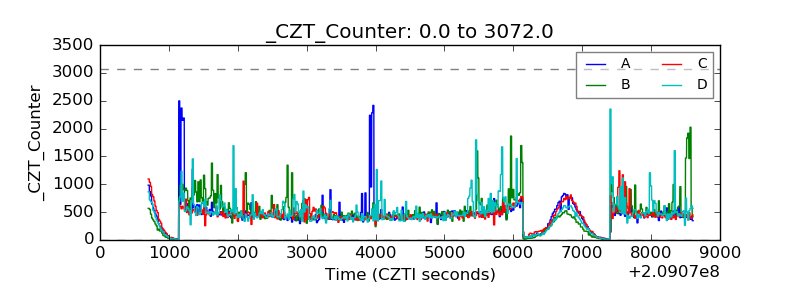 |
| +2.5 Volts monitor |  |
| +5 Volts monitor |  |
| _ROLL_ROT | 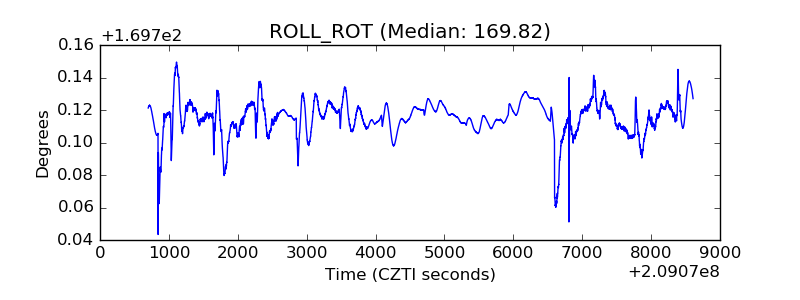 |
| _Roll_DEC | 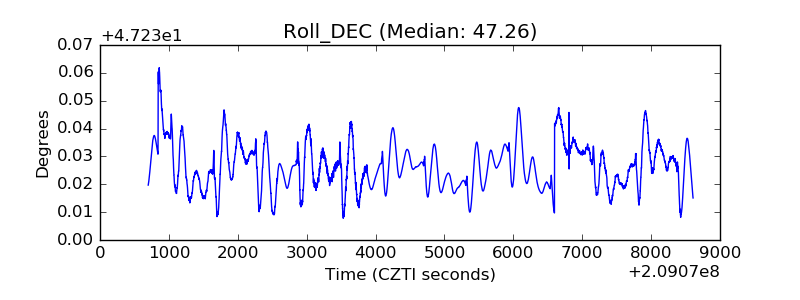 |
| _Roll_RA | 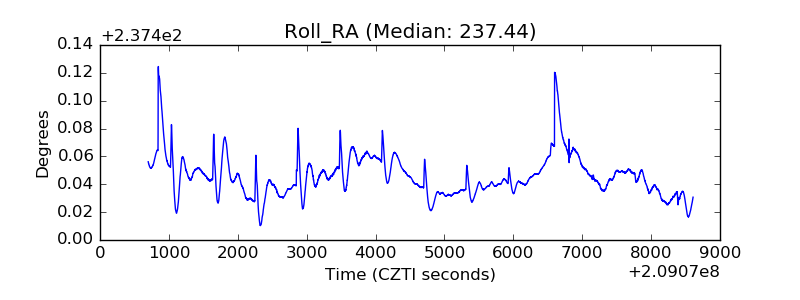 |
| Veto Counter | 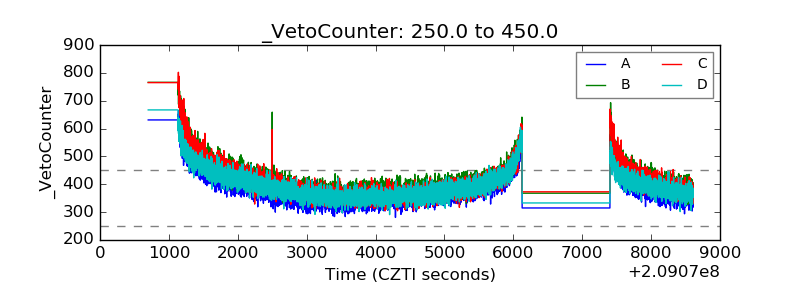 |