| Param | Original file | Final file |
|---|---|---|
| Filename | modeM0/AS1G05_156T09_9000000604_04794cztM0_level2.evt | modeM0/AS1G05_156T09_9000000604_04794cztM0_level2_quad_clean.evt |
| Size (bytes) | 562,080,960 | 77,696,640 |
| Size | 536.0 MB | 74.1 MB |
| Events in quadrant A | 4,242,926 | 472,748 |
| Events in quadrant B | 4,236,769 | 465,921 |
| Events in quadrant C | 4,123,194 | 462,726 |
| Events in quadrant D | 3,940,817 | 459,089 |
| Mode M9 | |||
|---|---|---|---|
| Quadrant | BADHDUFLAG | Total packets | Discarded packets |
| A | 0 | 14 | 0 |
| B | 0 | 14 | 0 |
| C | 0 | 14 | 0 |
| D | 0 | 15 | 0 |
| Mode M0 | |||
|---|---|---|---|
| Quadrant | BADHDUFLAG | Total packets | Discarded packets |
| A | 0 | 17583 | 3 |
| B | 0 | 17475 | 2 |
| C | 0 | 16970 | 2 |
| D | 0 | 16630 | 2 |
| Mode SS | |||
|---|---|---|---|
| Quadrant | BADHDUFLAG | Total packets | Discarded packets |
| A | 0 | 144 | 0 |
| B | 0 | 144 | 0 |
| C | 0 | 144 | 0 |
| D | 0 | 144 | 0 |
| Quadrant | Total seconds | Saturated seconds | Saturation percentage |
|---|---|---|---|
| A | 7064 | 335 | 4.742356% |
| B | 7064 | 133 | 1.882786% |
| C | 7064 | 102 | 1.443941% |
| D | 7064 | 44 | 0.622877% |
Noise dominated data is calculated using 1-second bins in cleaned event files. If a bin has >2000 counts, and if more than 50% of those come from <1% of pixels, then it is considered to be noise-dominated and hence unusable.
| Quadrant | # 1 sec bins | Bins with >0 counts | Bins with >2000 counts | High rate bins dominated by noise | Noise dominated (total time) | Noise dominated (detector-on time) | Marked lightcurve |
|---|---|---|---|---|---|---|---|
| A | 7674 | 7065 | 213 | 213 | 2.78% | 3.01% | 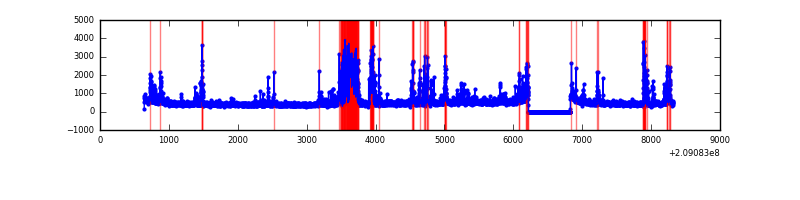 |
| B | 7674 | 7065 | 66 | 66 | 0.86% | 0.93% | 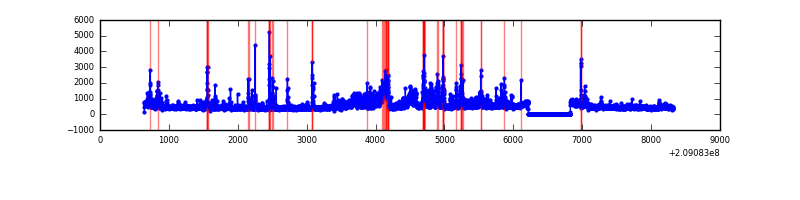 |
| C | 7674 | 7065 | 27 | 27 | 0.35% | 0.38% | 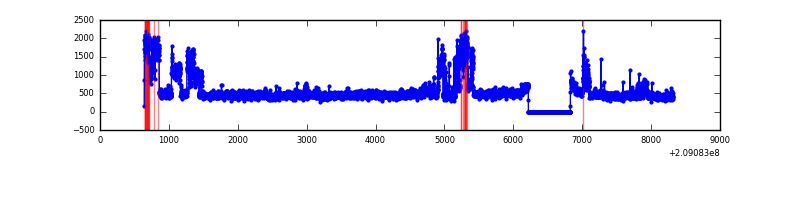 |
| D | 7674 | 7065 | 29 | 29 | 0.38% | 0.41% | 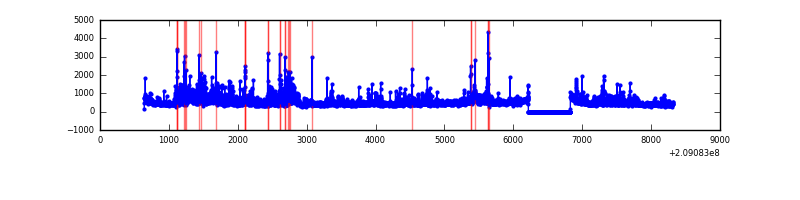 |
Top three noisy pixels from each quadrant. If the there are fewer than three noisy pixels in the level2.evt file, extra rows are filled as -1
| Pixel properties | Quadrant properties | ||||||
|---|---|---|---|---|---|---|---|
| Quadrant | DetID | PixID | Counts | Sigma | Mean | Median | Sigma |
| A | 0 | 50 | 673479 | 4202.18 | 783 | 765 | 160.1 |
| A | 14 | 238 | 408205 | 2545.12 | 783 | 765 | 160.1 |
| A | 8 | 15 | 75947 | 469.63 | 783 | 765 | 160.1 |
| B | 14 | 167 | 569668 | 3686.36 | 803 | 783 | 154.3 |
| B | 10 | 16 | 297868 | 1925.1 | 803 | 783 | 154.3 |
| B | 8 | 3 | 144844 | 933.51 | 803 | 783 | 154.3 |
| C | 8 | 208 | 1065562 | 5879.38 | 776 | 780 | 181.1 |
| C | 12 | 4 | 12082 | 62.41 | 776 | 780 | 181.1 |
| C | 1 | 16 | 7442 | 36.79 | 776 | 780 | 181.1 |
| D | 13 | 235 | 309189 | 1651.83 | 774 | 749 | 186.7 |
| D | 2 | 136 | 269324 | 1438.33 | 774 | 749 | 186.7 |
| D | 12 | 22 | 147122 | 783.89 | 774 | 749 | 186.7 |
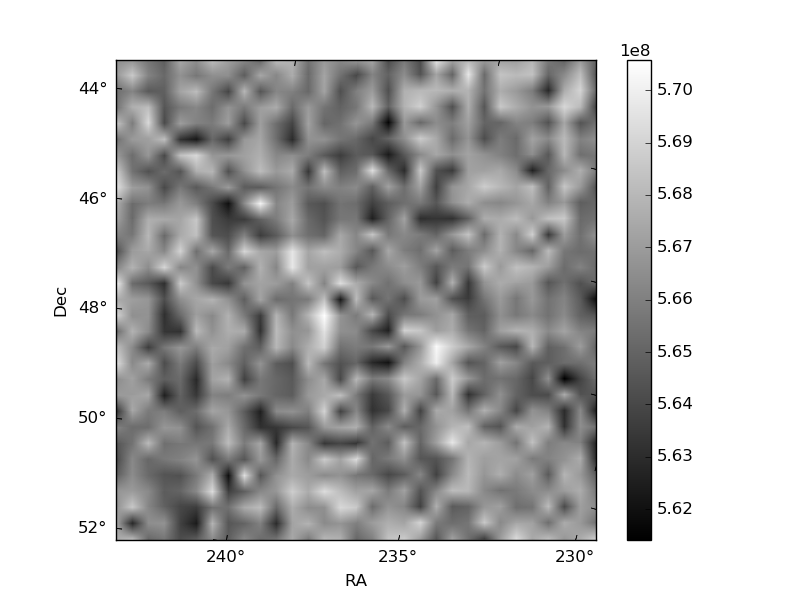
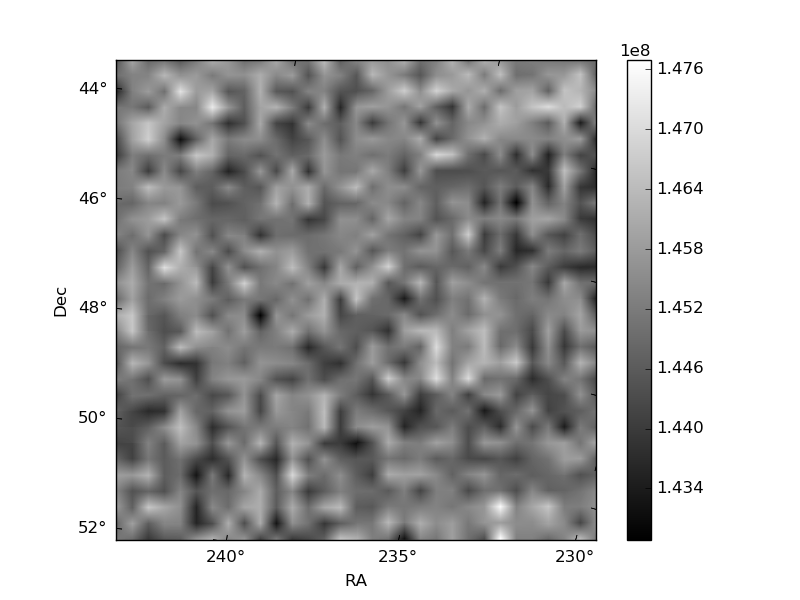
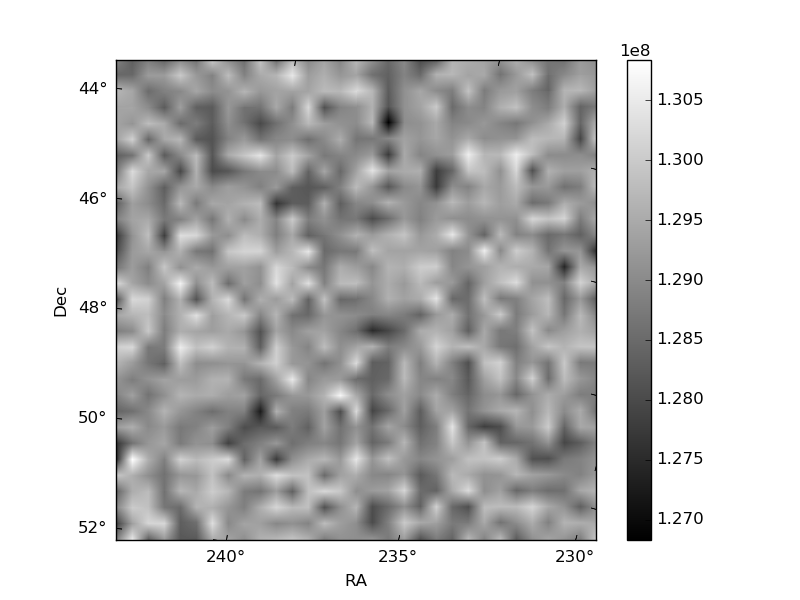
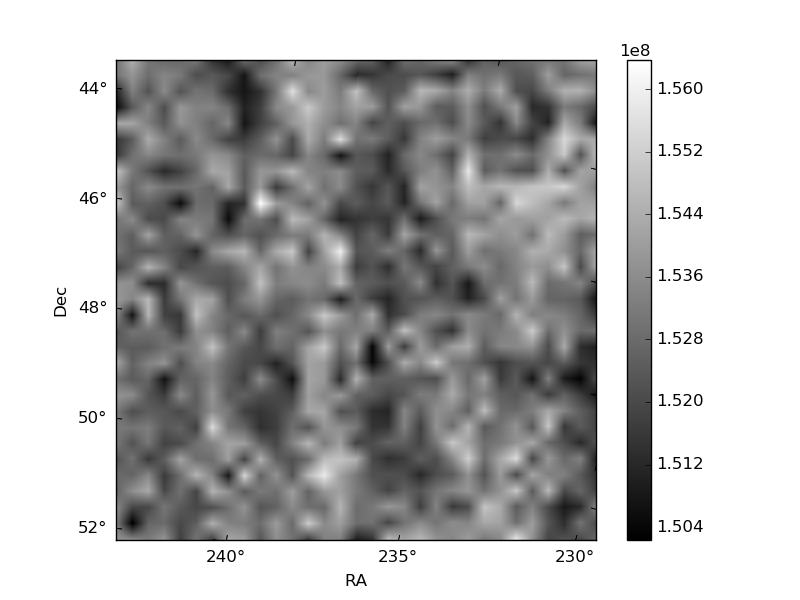
Histogram calculated using DETX and DETY for each event in the final _common_clean file
| Quadrant A | 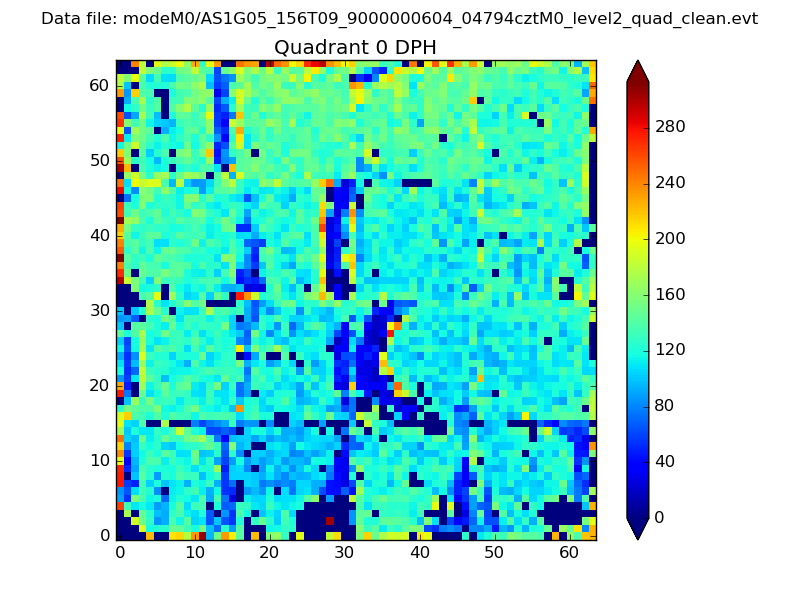 |
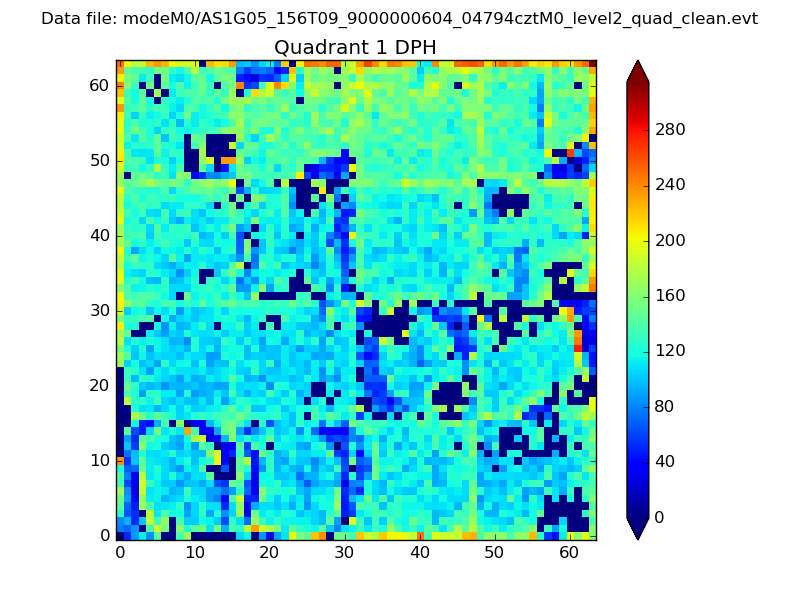 |
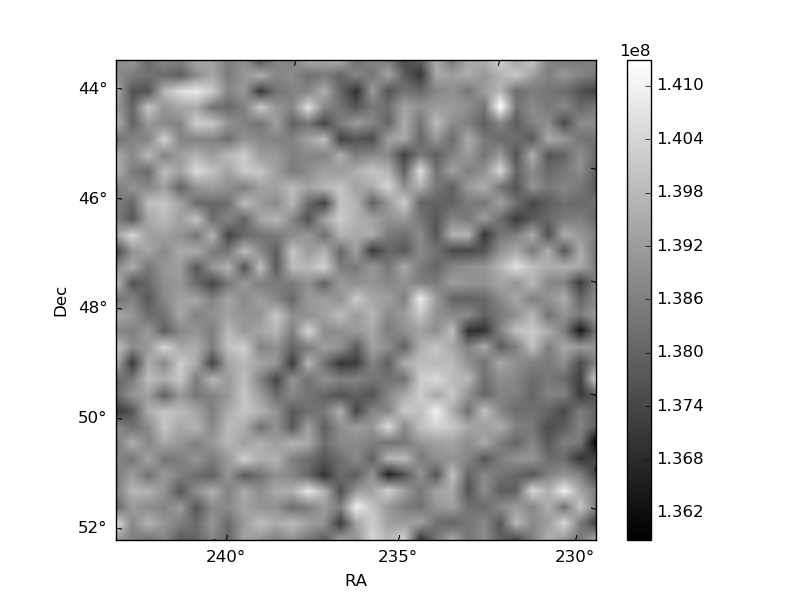
Quadrant B |
|---|---|---|---|
| Quadrant D | 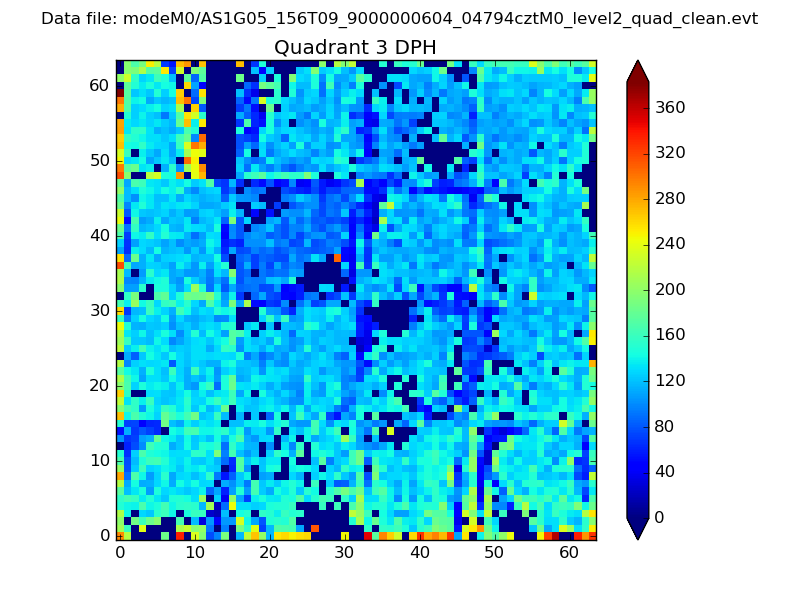 |
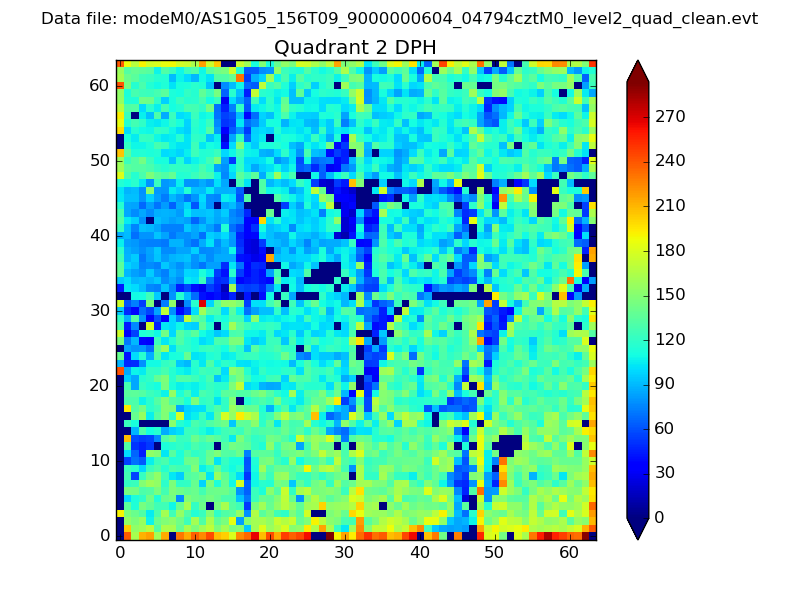 |
Quadrant C |
| Plot type | Count rate plots | Images |
|---|---|---|
| Comparison with Poisson distribution Blue bars denote a histogram of data divided into 1 sec bins. Red curve is a Poisson curve with rate = median count rate of data. |
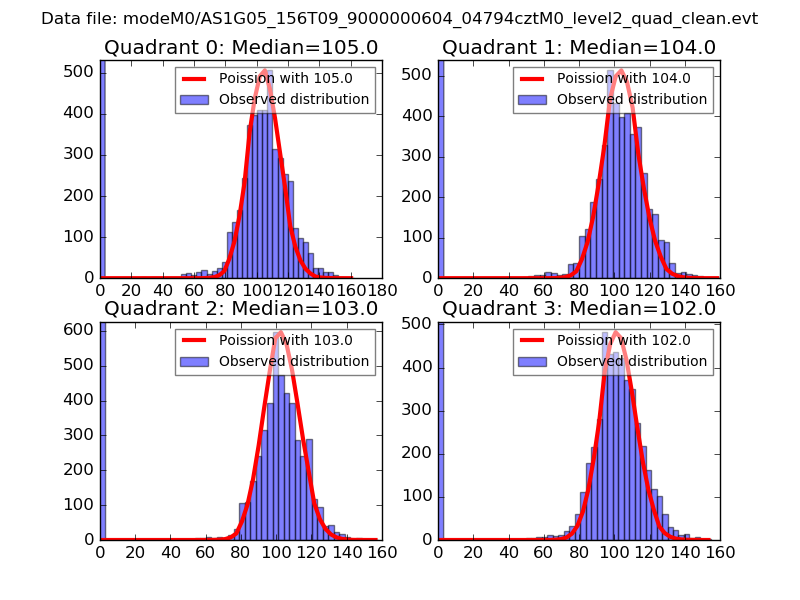 |
 |
| Quadrant-wise count rates Data is divided into 100 sec bins |
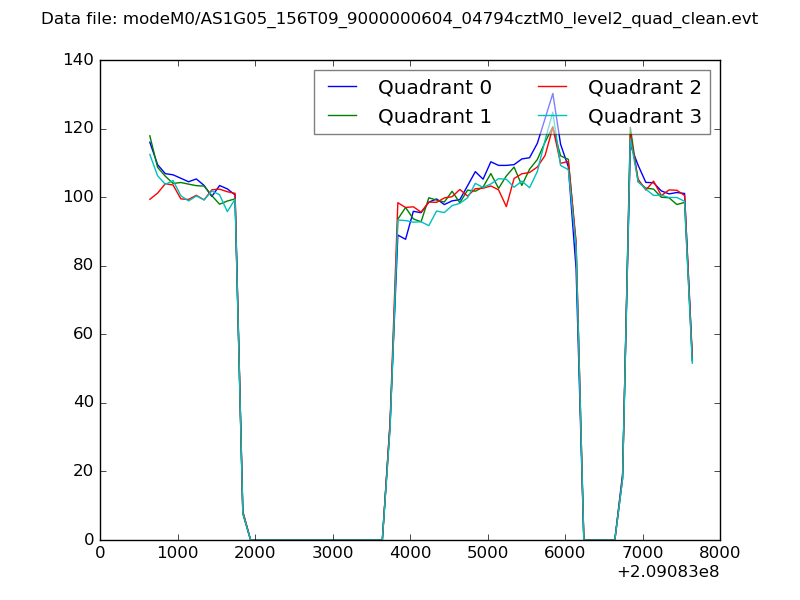 |
|
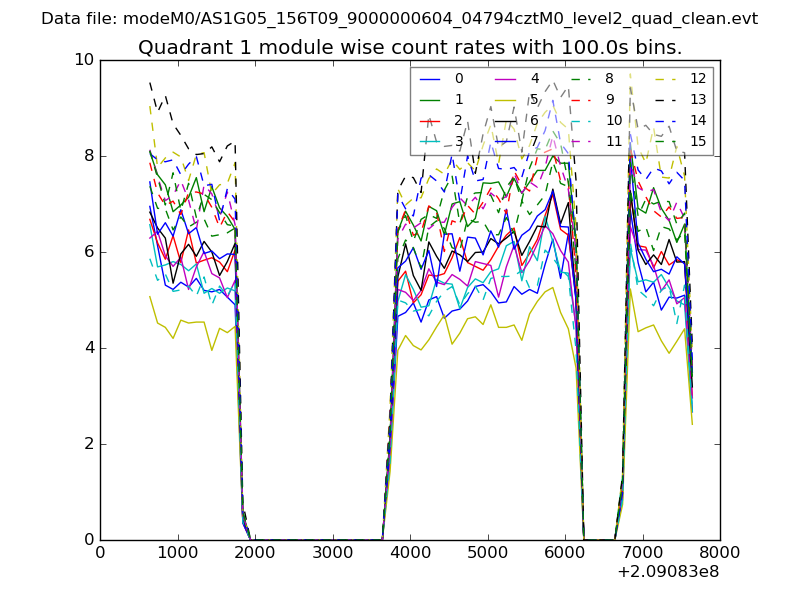
| Module-wise count rates for Quadrant A Data is divided into 100 sec bins |
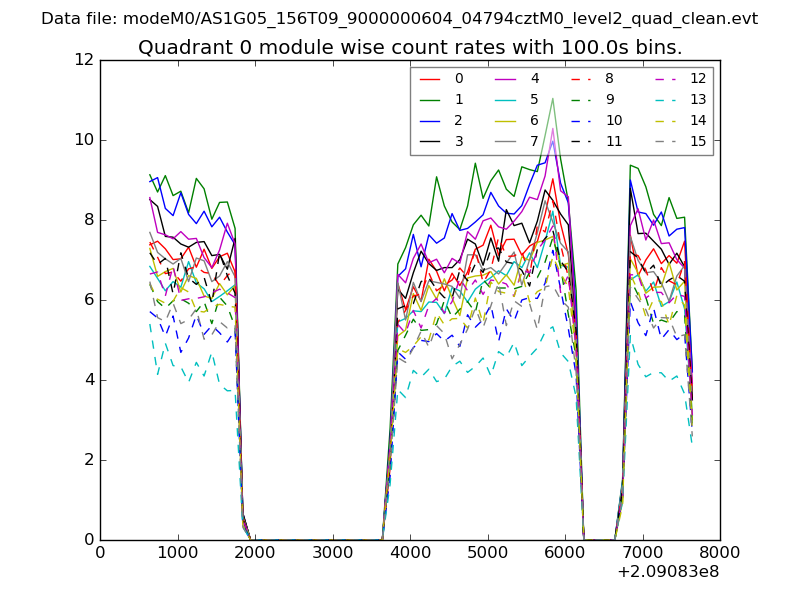 |
 |
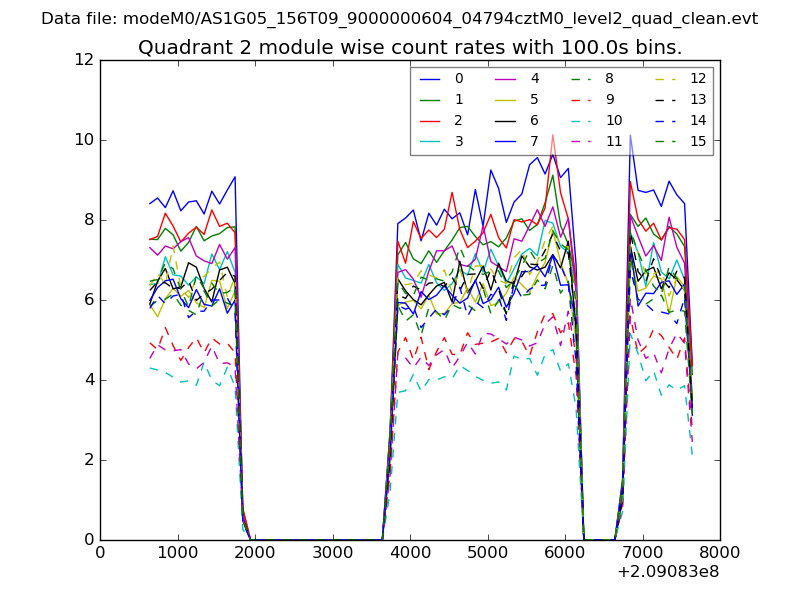
| Module-wise count rates for Quadrant B Data is divided into 100 sec bins |
 |
 |
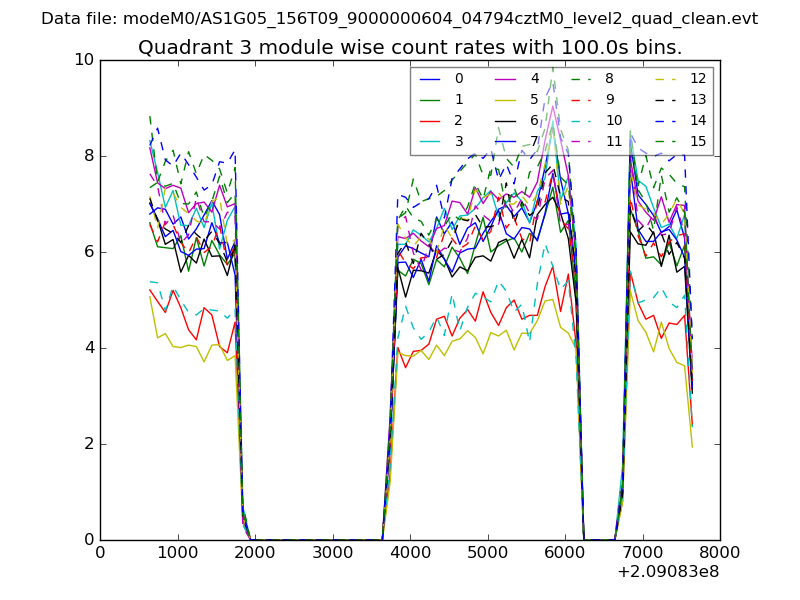
| Module-wise count rates for Quadrant C Data is divided into 100 sec bins |
 |
 |
| Module-wise count rates for Quadrant D Data is divided into 100 sec bins |
 |
 |
| Parameter | Plot |
|---|---|
| CZT HV Monitor | 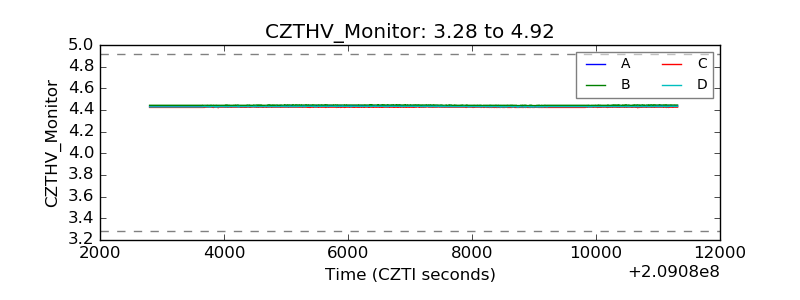 |
| D_VDD | 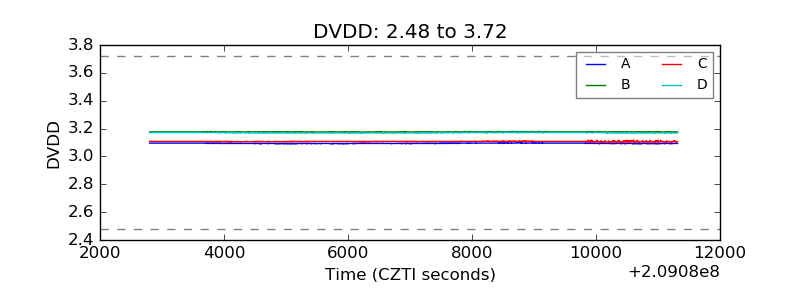 |
| Temperature 1 | 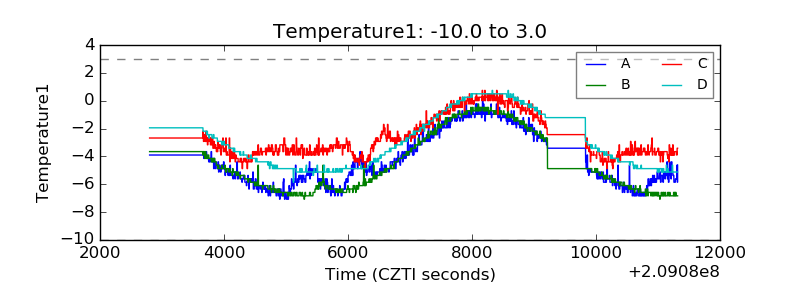 |
| Veto HV Monitor | 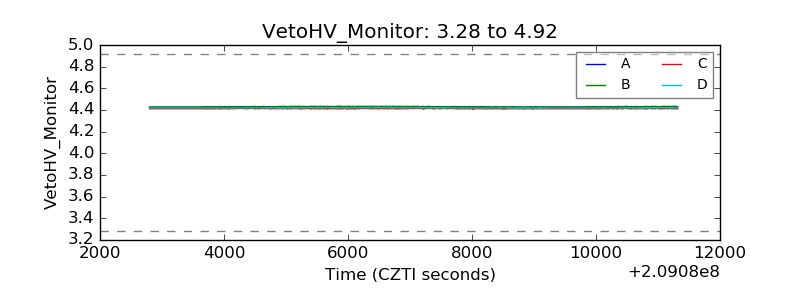 |
| Veto LLD | 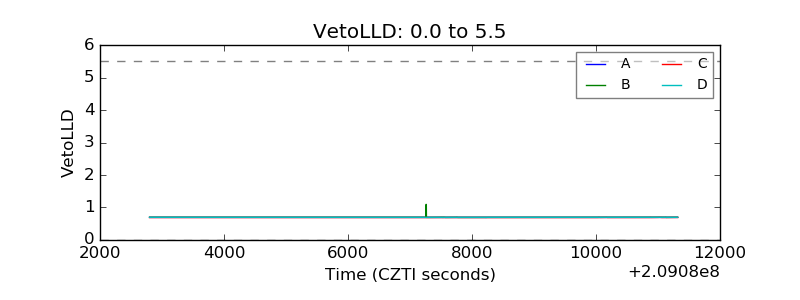 |
| Alpha Counter | 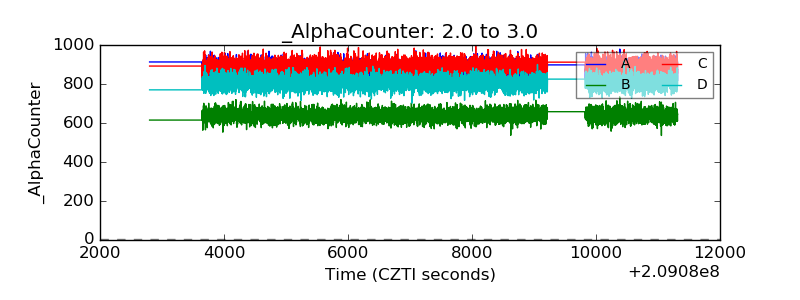 |
| _CPM_Rate | 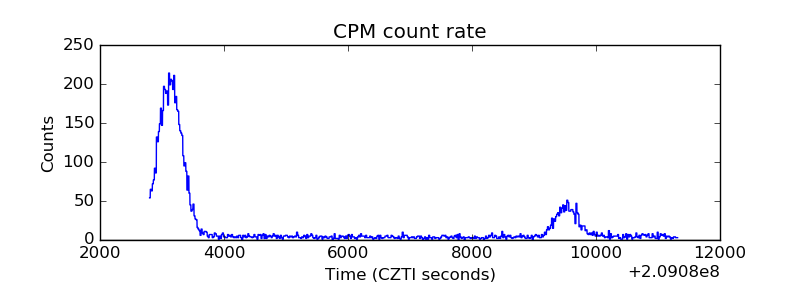 |
| CZT Counter | 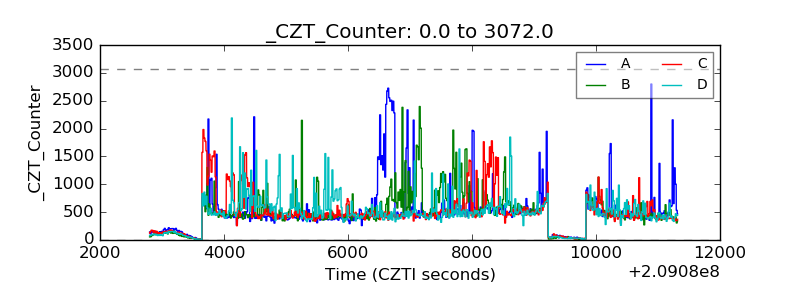 |
| +2.5 Volts monitor |  |
| +5 Volts monitor |  |
| _ROLL_ROT | 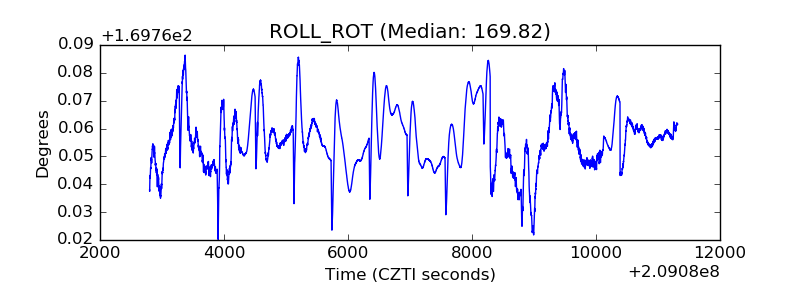 |
| _Roll_DEC | 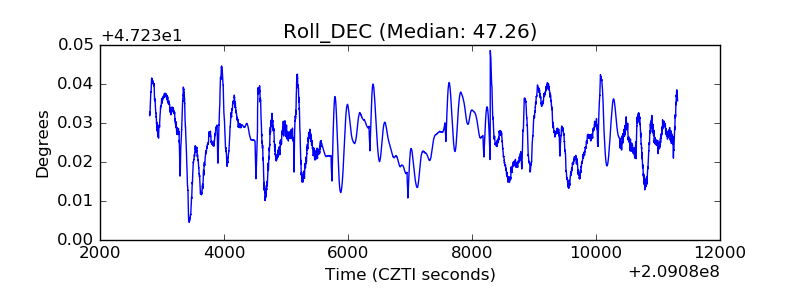 |
| _Roll_RA | 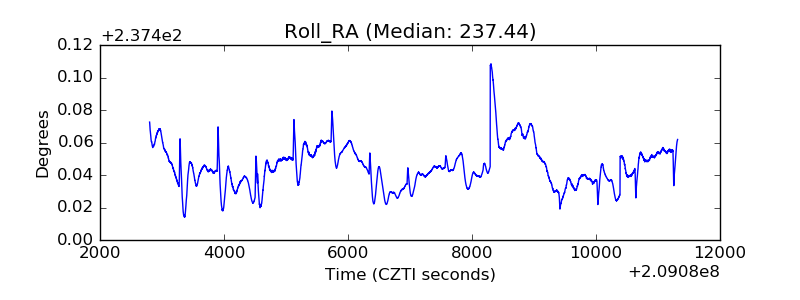 |
| Veto Counter | 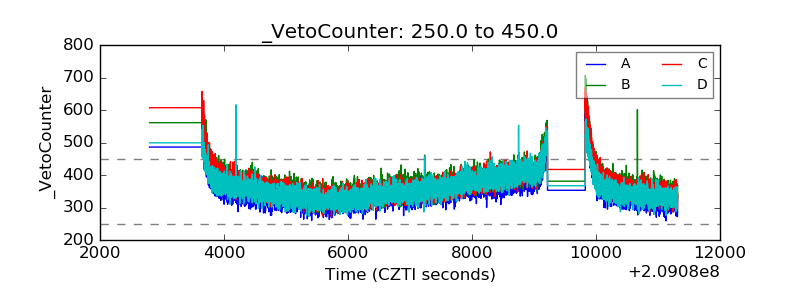 |