| Param | Original file | Final file |
|---|---|---|
| Filename | modeM0/AS1G05_156T09_9000000604_04795cztM0_level2.evt | modeM0/AS1G05_156T09_9000000604_04795cztM0_level2_quad_clean.evt |
| Size (bytes) | 587,413,440 | 88,142,400 |
| Size | 560.2 MB | 84.1 MB |
| Events in quadrant A | 4,571,166 | 530,466 |
| Events in quadrant B | 4,382,322 | 525,540 |
| Events in quadrant C | 3,801,174 | 524,532 |
| Events in quadrant D | 4,474,281 | 513,905 |
| Mode M9 | |||
|---|---|---|---|
| Quadrant | BADHDUFLAG | Total packets | Discarded packets |
| A | 0 | 10 | 0 |
| B | 0 | 10 | 0 |
| C | 0 | 10 | 0 |
| D | 0 | 10 | 0 |
| Mode M0 | |||
|---|---|---|---|
| Quadrant | BADHDUFLAG | Total packets | Discarded packets |
| A | 0 | 19353 | 3 |
| B | 0 | 18590 | 2 |
| C | 0 | 17227 | 2 |
| D | 0 | 19299 | 2 |
| Mode SS | |||
|---|---|---|---|
| Quadrant | BADHDUFLAG | Total packets | Discarded packets |
| A | 0 | 168 | 0 |
| B | 0 | 168 | 0 |
| C | 0 | 168 | 0 |
| D | 0 | 168 | 0 |
| Quadrant | Total seconds | Saturated seconds | Saturation percentage |
|---|---|---|---|
| A | 8272 | 240 | 2.901354% |
| B | 8272 | 173 | 2.091393% |
| C | 8272 | 55 | 0.664894% |
| D | 8272 | 162 | 1.958414% |
Noise dominated data is calculated using 1-second bins in cleaned event files. If a bin has >2000 counts, and if more than 50% of those come from <1% of pixels, then it is considered to be noise-dominated and hence unusable.
| Quadrant | # 1 sec bins | Bins with >0 counts | Bins with >2000 counts | High rate bins dominated by noise | Noise dominated (total time) | Noise dominated (detector-on time) | Marked lightcurve |
|---|---|---|---|---|---|---|---|
| A | 9187 | 8274 | 115 | 115 | 1.25% | 1.39% | 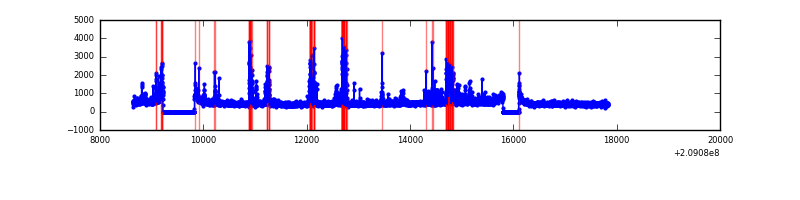 |
| B | 9187 | 8274 | 37 | 37 | 0.40% | 0.45% | 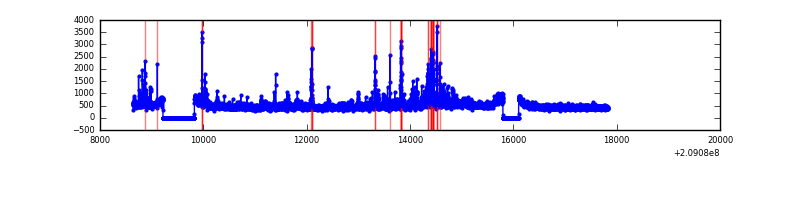 |
| C | 9187 | 8274 | 1 | 1 | 0.01% | 0.01% | 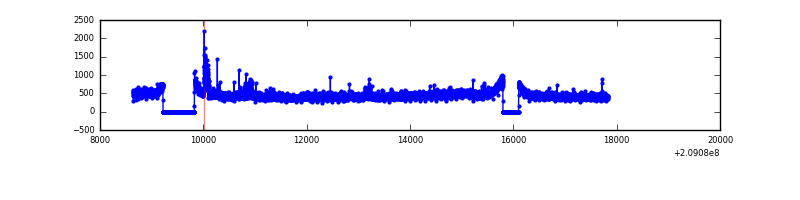 |
| D | 9187 | 8274 | 108 | 108 | 1.18% | 1.31% | 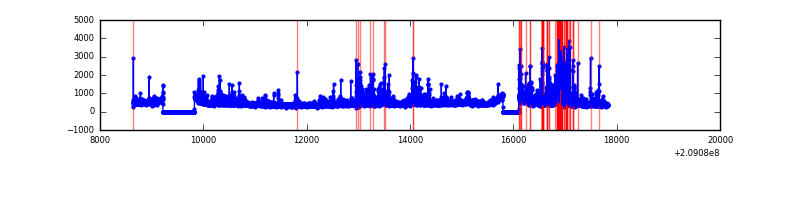 |
Top three noisy pixels from each quadrant. If the there are fewer than three noisy pixels in the level2.evt file, extra rows are filled as -1
| Pixel properties | Quadrant properties | ||||||
|---|---|---|---|---|---|---|---|
| Quadrant | DetID | PixID | Counts | Sigma | Mean | Median | Sigma |
| A | 0 | 50 | 359767 | 1858.22 | 943 | 921 | 193.1 |
| A | 8 | 15 | 185192 | 954.21 | 943 | 921 | 193.1 |
| A | 14 | 238 | 166788 | 858.91 | 943 | 921 | 193.1 |
| B | 8 | 3 | 235658 | 1264.36 | 962 | 937 | 185.6 |
| B | 14 | 167 | 137287 | 734.47 | 962 | 937 | 185.6 |
| B | 10 | 16 | 116926 | 624.79 | 962 | 937 | 185.6 |
| C | 8 | 208 | 110167 | 502.13 | 934 | 937 | 217.5 |
| C | 8 | 128 | 14256 | 61.23 | 934 | 937 | 217.5 |
| C | 12 | 4 | 12633 | 53.77 | 934 | 937 | 217.5 |
| D | 13 | 235 | 444335 | 1966.91 | 924 | 892 | 225.5 |
| D | 2 | 136 | 236067 | 1043.13 | 924 | 892 | 225.5 |
| D | 2 | 234 | 132813 | 585.14 | 924 | 892 | 225.5 |
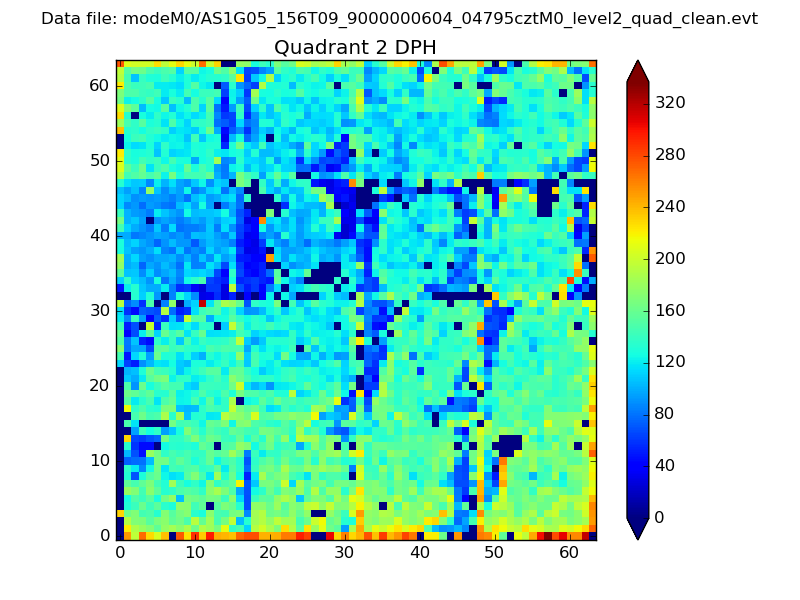
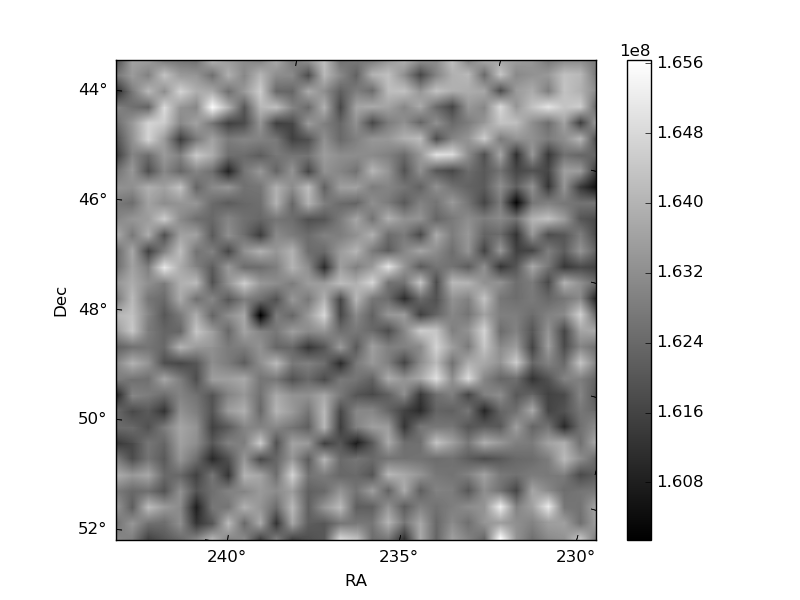
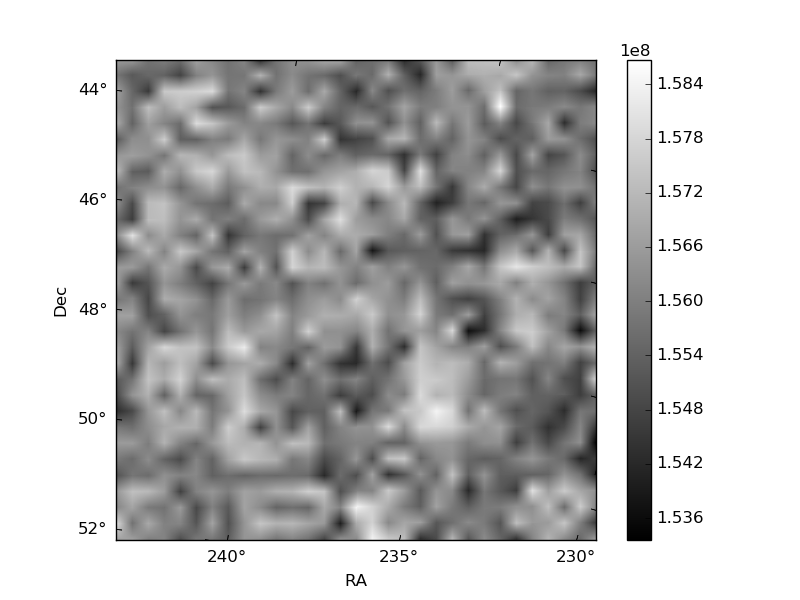
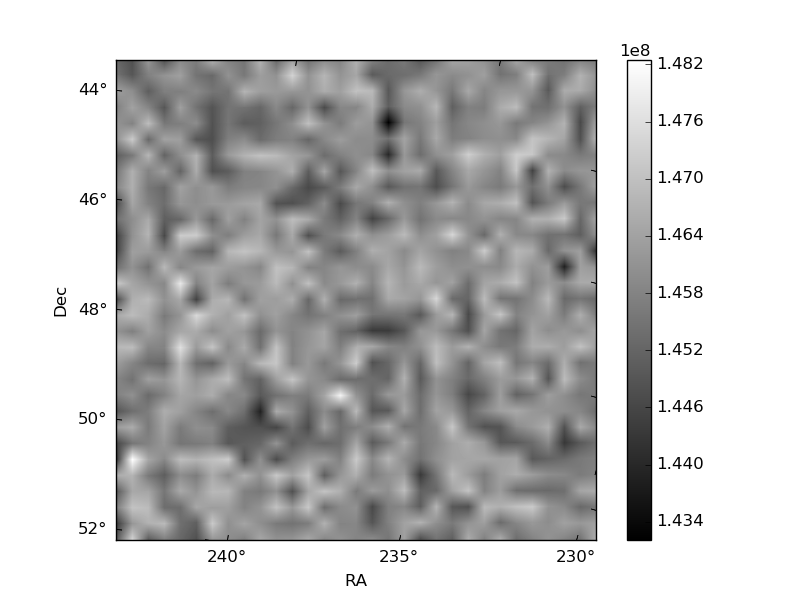
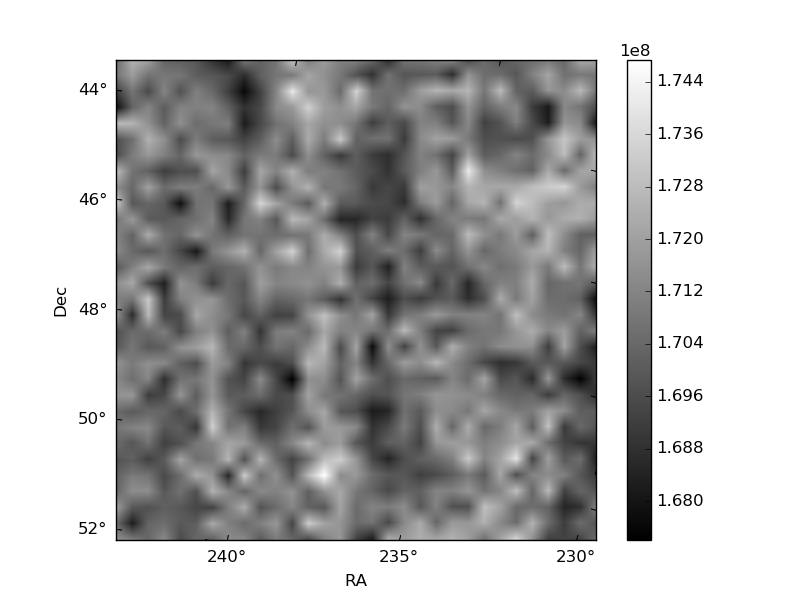
Histogram calculated using DETX and DETY for each event in the final _common_clean file
| Quadrant A | 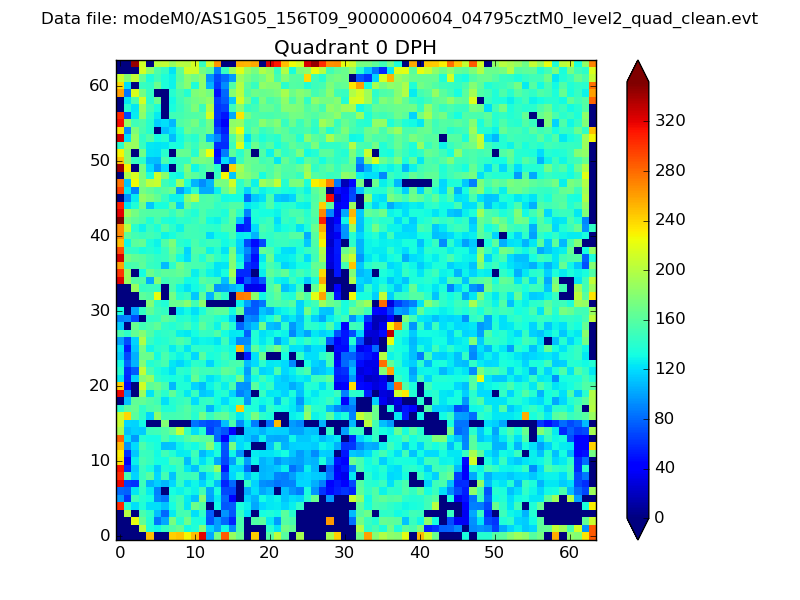 |
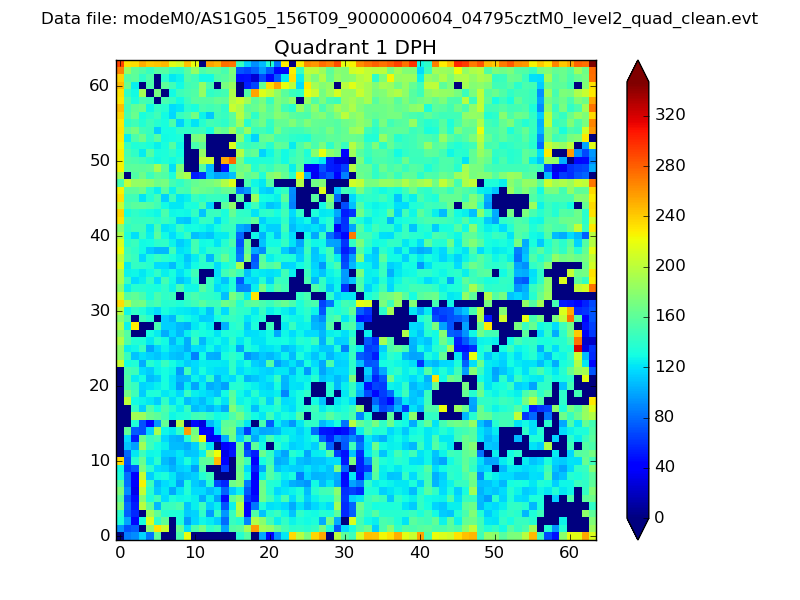 |
Quadrant B |
|---|---|---|---|
| Quadrant D | 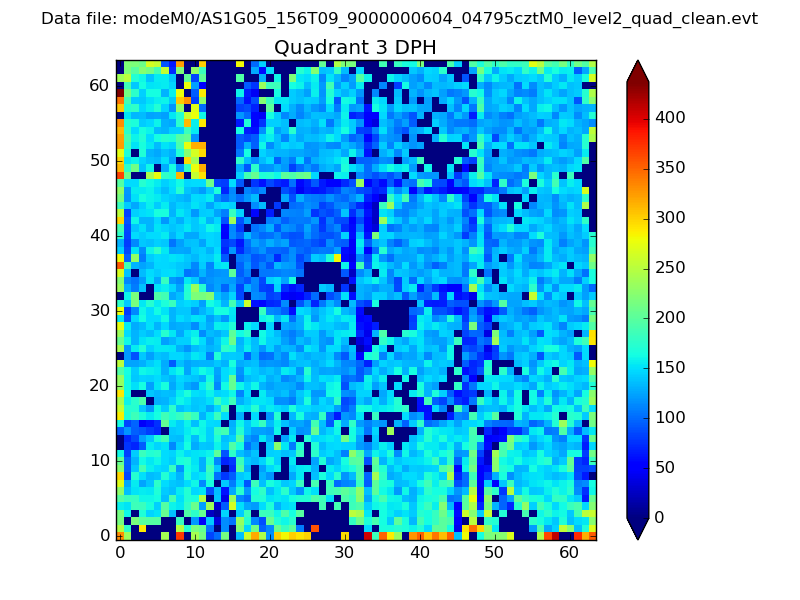 |
 |
Quadrant C |
| Plot type | Count rate plots | Images |
|---|---|---|
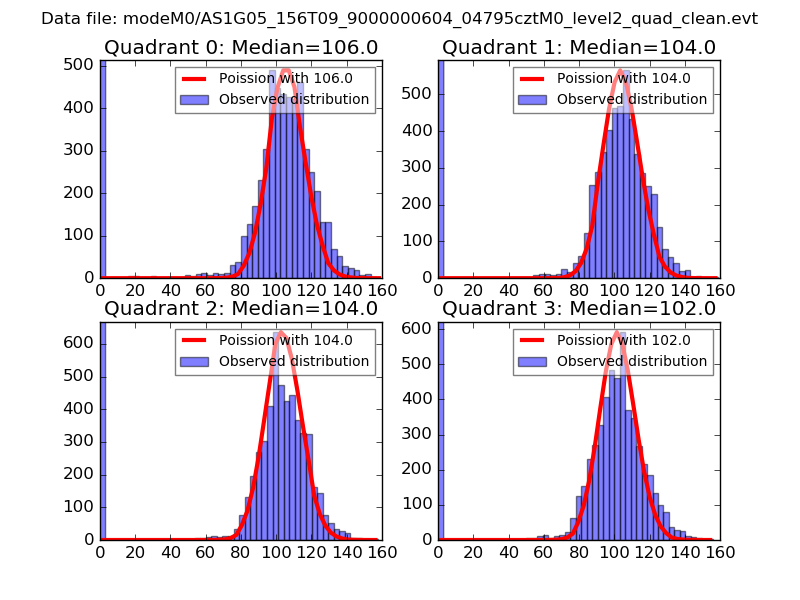
| Comparison with Poisson distribution Blue bars denote a histogram of data divided into 1 sec bins. Red curve is a Poisson curve with rate = median count rate of data. |
 |
 |
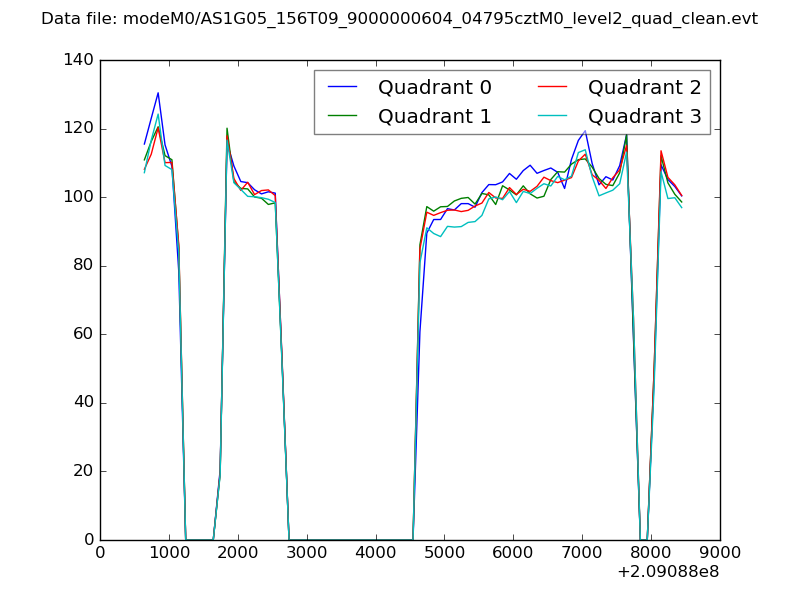
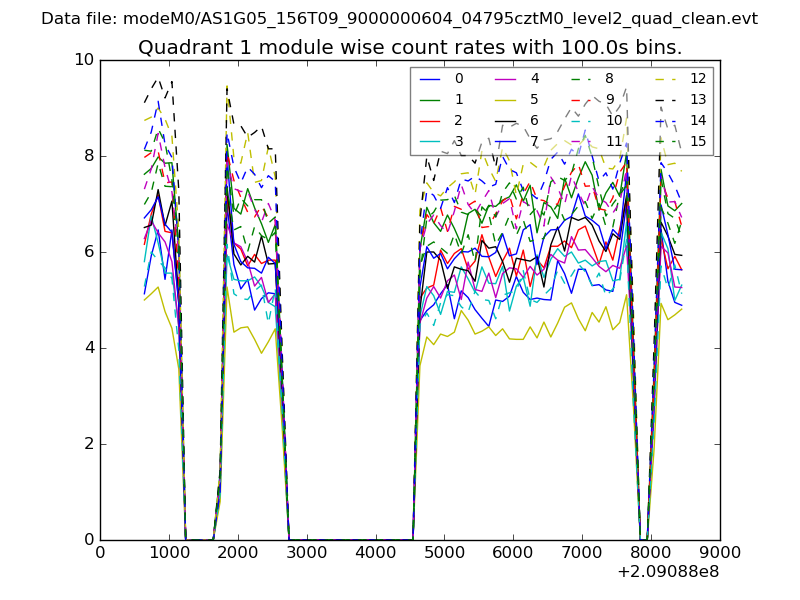
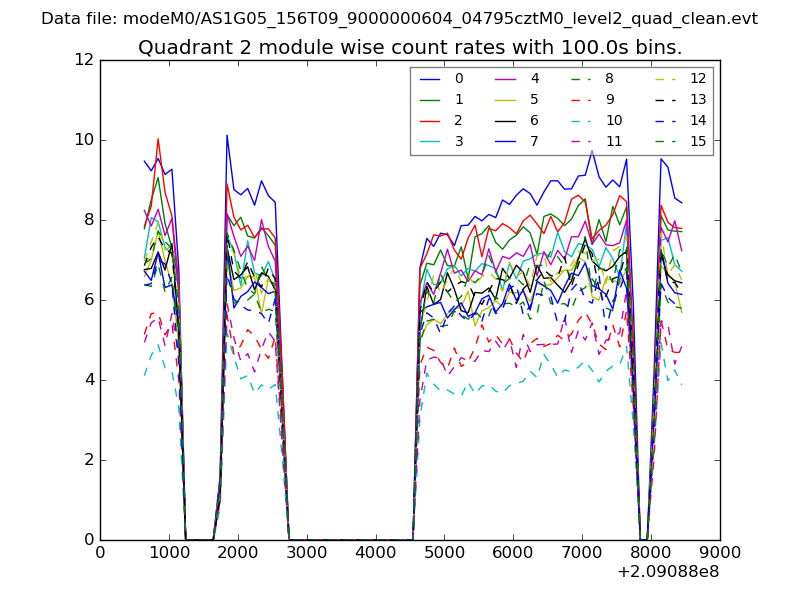
| Quadrant-wise count rates Data is divided into 100 sec bins |
 |
|
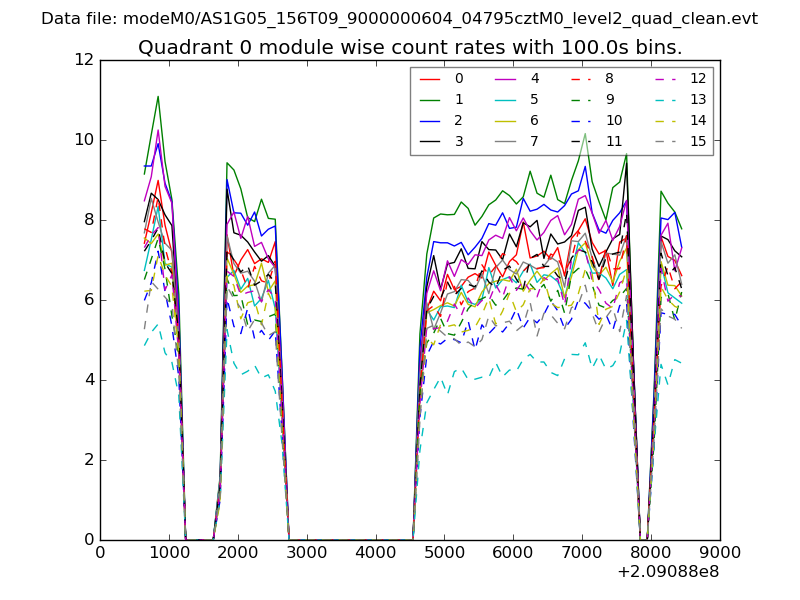
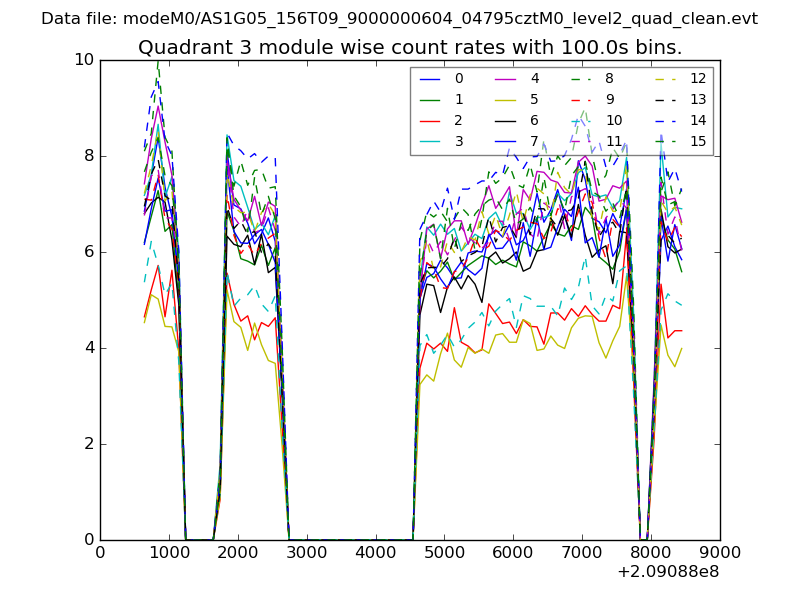
| Module-wise count rates for Quadrant A Data is divided into 100 sec bins |
 |
 |
| Module-wise count rates for Quadrant B Data is divided into 100 sec bins |
 |
 |
| Module-wise count rates for Quadrant C Data is divided into 100 sec bins |
 |
 |
| Module-wise count rates for Quadrant D Data is divided into 100 sec bins |
 |
 |
| Parameter | Plot |
|---|---|
| CZT HV Monitor | 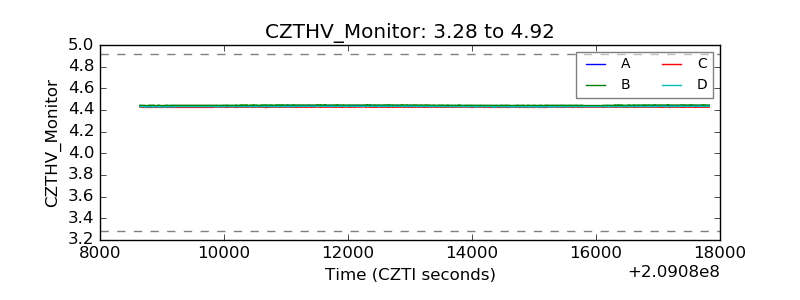 |
| D_VDD | 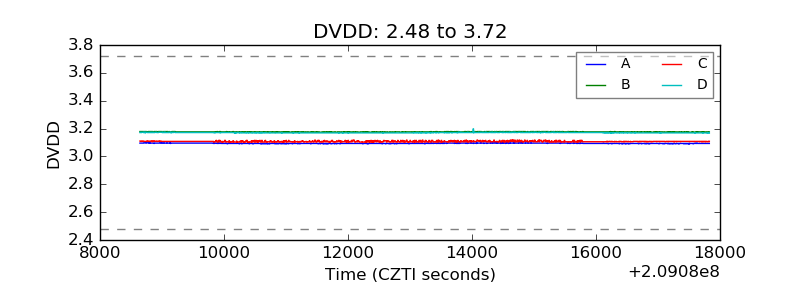 |
| Temperature 1 | 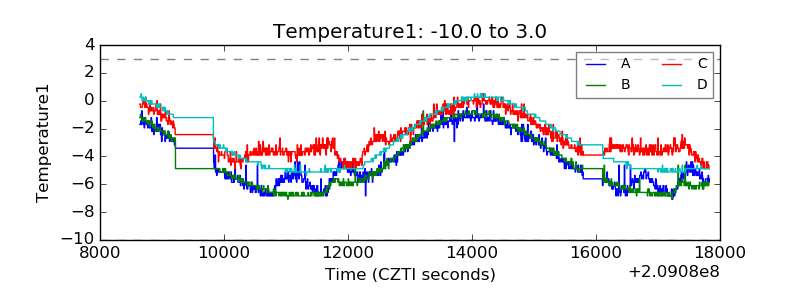 |
| Veto HV Monitor | 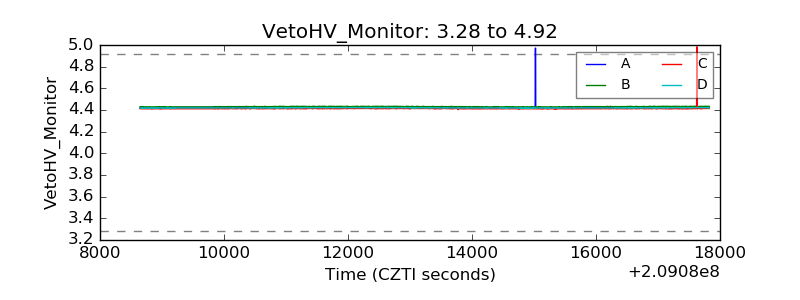 |
| Veto LLD | 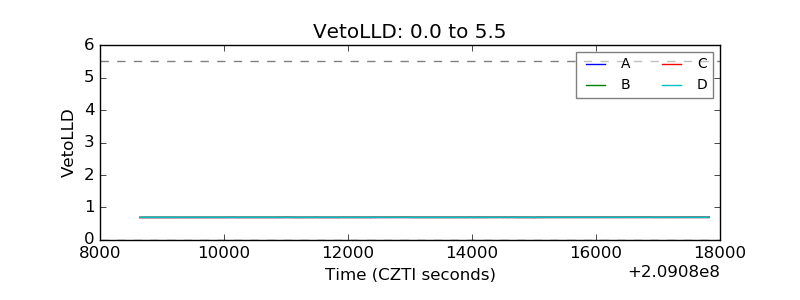 |
| Alpha Counter | 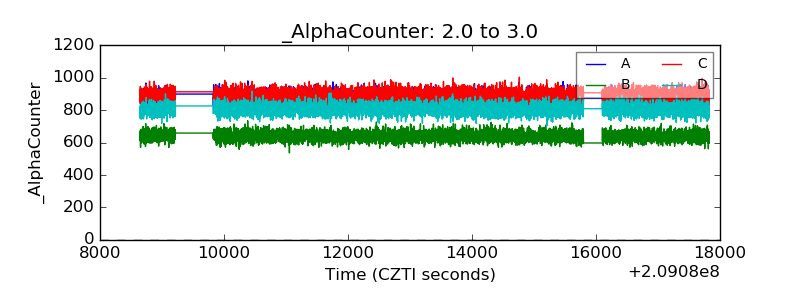 |
| _CPM_Rate | 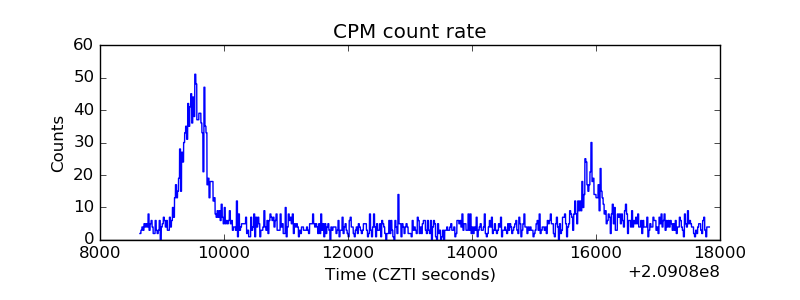 |
| CZT Counter | 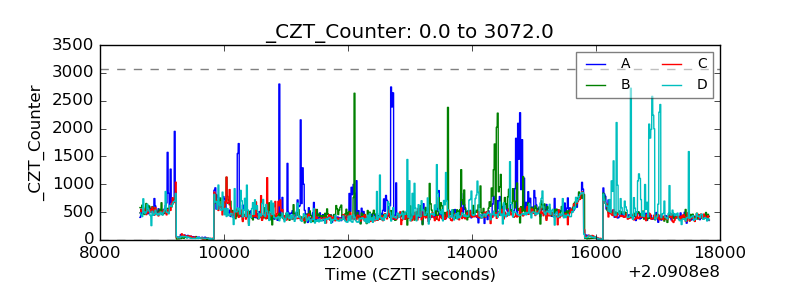 |
| +2.5 Volts monitor |  |
| +5 Volts monitor | 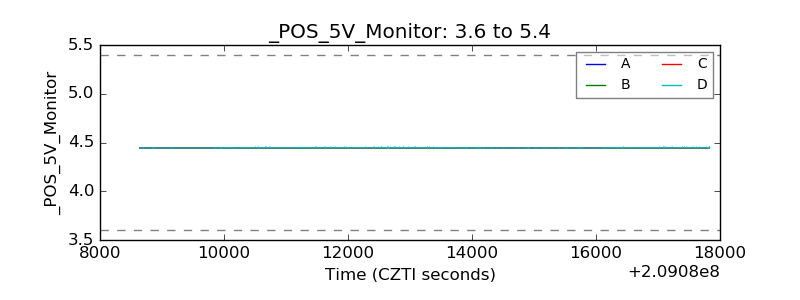 |
| _ROLL_ROT | 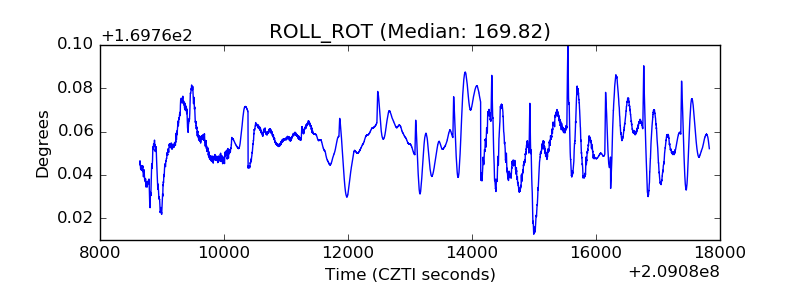 |
| _Roll_DEC | 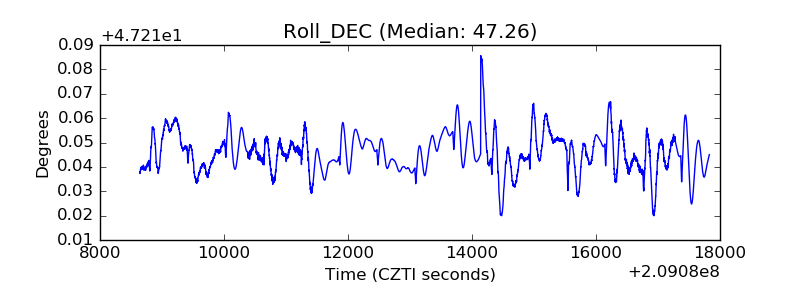 |
| _Roll_RA | 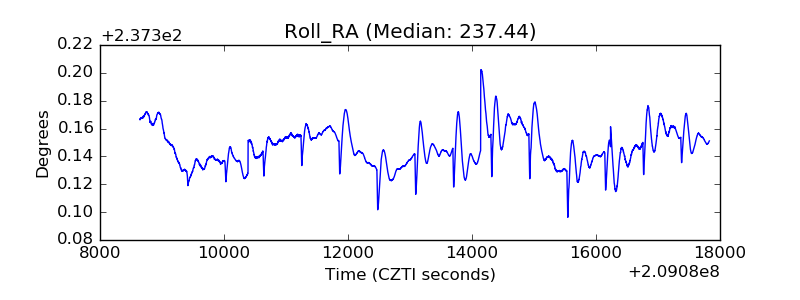 |
| Veto Counter | 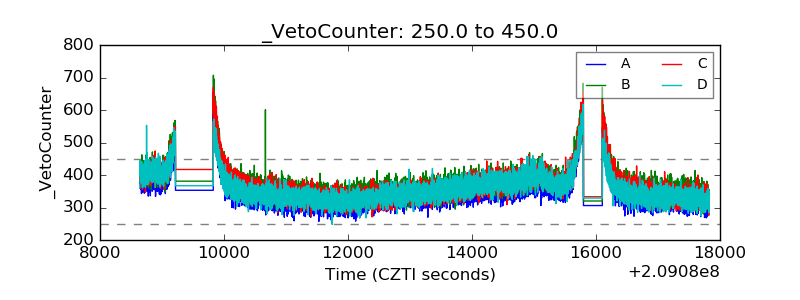 |