| Param | Original file | Final file |
|---|---|---|
| Filename | modeM0/AS1G05_002T03_9000000608cztM0_level2.fits | modeM0/AS1G05_002T03_9000000608cztM0_level2_quad_clean.evt |
| Size (bytes) | 339,367,680 | 312,701,760 |
| Size | 323.6 MB | 298.2 MB |
| Events in quadrant A | 2,065,612 | 1,820,911 |
| Events in quadrant B | 1,997,464 | 1,839,435 |
| Events in quadrant C | 2,033,624 | 1,787,381 |
| Events in quadrant D | 1,657,444 | 1,499,977 |
| Mode M0 | |||
|---|---|---|---|
| Quadrant | BADHDUFLAG | Total packets | Discarded packets |
| A | 0 | 79929 | 0 |
| B | 0 | 79471 | 0 |
| C | 0 | 79656 | 0 |
| D | 0 | 115697 | 0 |
| Mode SS | |||
|---|---|---|---|
| Quadrant | BADHDUFLAG | Total packets | Discarded packets |
| A | 0 | 746 | 0 |
| B | 0 | 746 | 0 |
| C | 0 | 746 | 0 |
| D | 0 | 746 | 0 |
| Mode M9 | |||
|---|---|---|---|
| Quadrant | BADHDUFLAG | Total packets | Discarded packets |
| A | 0 | 67 | 0 |
| B | 0 | 67 | 0 |
| C | 0 | 67 | 0 |
| D | 0 | 67 | 0 |
| Quadrant | Total seconds | Saturated seconds | Saturation percentage |
|---|---|---|---|
| A | 36713 | 689 | 1.876719% |
| B | 36713 | 381 | 1.037780% |
| C | 36712 | 524 | 1.427326% |
| D | 36714 | 4865 | 13.251076% |
Noise dominated data is calculated using 1-second bins in cleaned event files. If a bin has >2000 counts, and if more than 50% of those come from <1% of pixels, then it is considered to be noise-dominated and hence unusable.
| Quadrant | # 1 sec bins | Bins with >0 counts | Bins with >2000 counts | High rate bins dominated by noise | Noise dominated (total time) | Noise dominated (detector-on time) | Marked lightcurve |
|---|---|---|---|---|---|---|---|
| A | 48306 | 36656 | 0 | 0 | 0.00% | 0.00% | 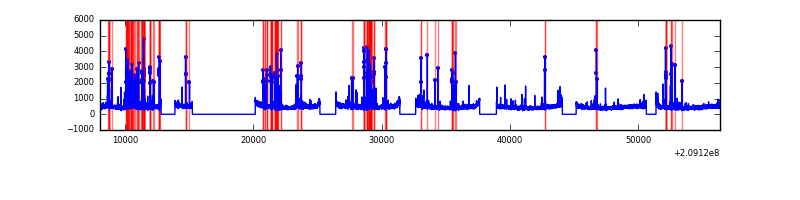 |
| B | 48306 | 36711 | 0 | 0 | 0.00% | 0.00% |  |
| C | 48306 | 36712 | 0 | 0 | 0.00% | 0.00% |  |
| D | 48306 | 36697 | 0 | 0 | 0.00% | 0.00% | 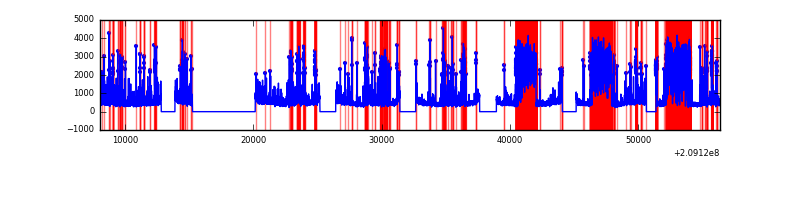 |
Top three noisy pixels from each quadrant. If the there are fewer than three noisy pixels in the level2.evt file, extra rows are filled as -1
| Pixel properties | Quadrant properties | ||||||
|---|---|---|---|---|---|---|---|
| Quadrant | DetID | PixID | Counts | Sigma | Mean | Median | Sigma |
| A | 0 | 29 | 2082 | 11.43 | 536 | 501 | 138.4 |
| A | 14 | 188 | 1992 | 10.78 | 536 | 501 | 138.4 |
| A | 14 | 204 | 1823 | 9.55 | 536 | 501 | 138.4 |
| B | 2 | 9 | 1807 | 11.87 | 528 | 502 | 110.0 |
| B | 12 | 226 | 1405 | 8.21 | 528 | 502 | 110.0 |
| B | 5 | 128 | 1371 | 7.9 | 528 | 502 | 110.0 |
| C | 1 | 80 | 1465 | 6.72 | 536 | 496 | 144.2 |
| C | 12 | 241 | 1420 | 6.41 | 536 | 496 | 144.2 |
| C | 1 | 81 | 1417 | 6.39 | 536 | 496 | 144.2 |
| D | 11 | 82 | 1363 | 7.32 | 473 | 431 | 127.3 |
| D | 6 | 231 | 1273 | 6.61 | 473 | 431 | 127.3 |
| D | 1 | 19 | 1229 | 6.27 | 473 | 431 | 127.3 |
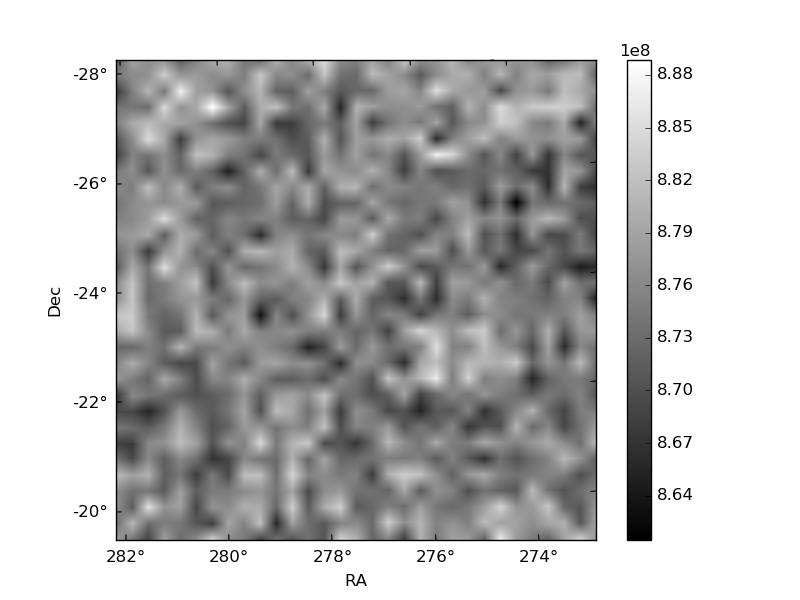
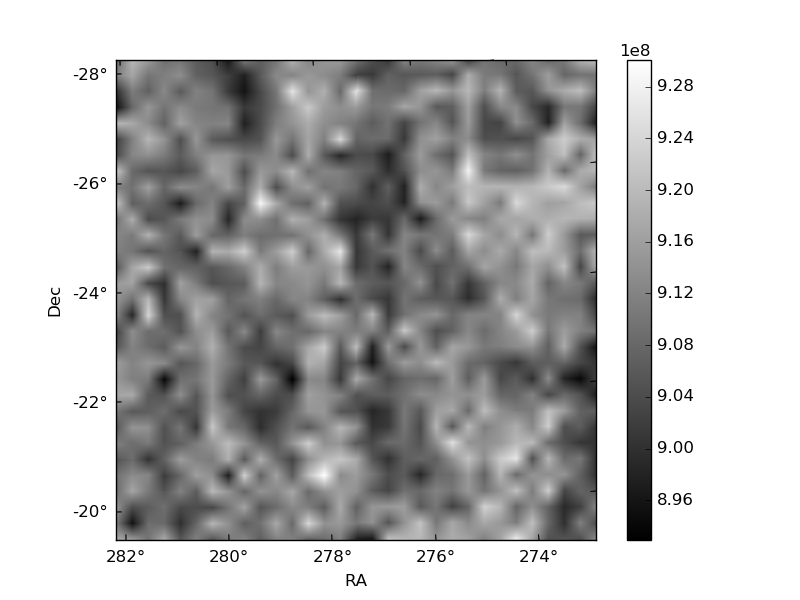
Histogram calculated using DETX and DETY for each event in the final _common_clean file
| Quadrant A |  |
 |
Quadrant B |
|---|---|---|---|
| Quadrant D |  |
 |
Quadrant C |
| Plot type | Count rate plots | Images |
|---|---|---|
| Comparison with Poisson distribution Blue bars denote a histogram of data divided into 1 sec bins. Red curve is a Poisson curve with rate = median count rate of data. |
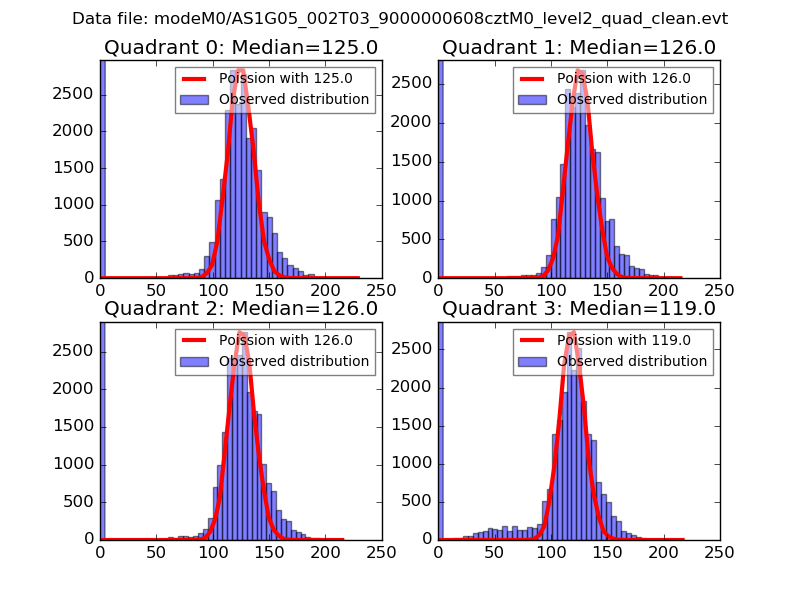 |
 |
| Quadrant-wise count rates Data is divided into 100 sec bins |
 |
|
| Module-wise count rates for Quadrant A Data is divided into 100 sec bins |
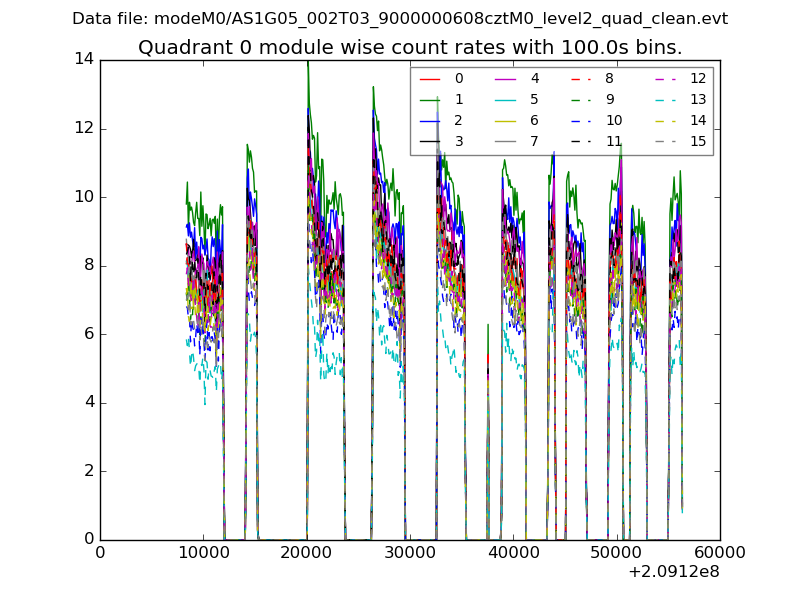 |
 |
| Module-wise count rates for Quadrant B Data is divided into 100 sec bins |
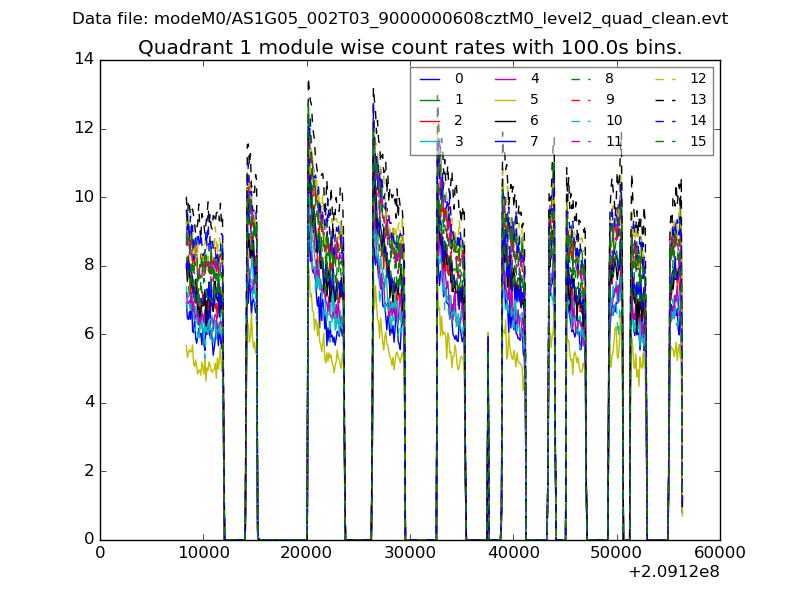 |
 |
| Module-wise count rates for Quadrant C Data is divided into 100 sec bins |
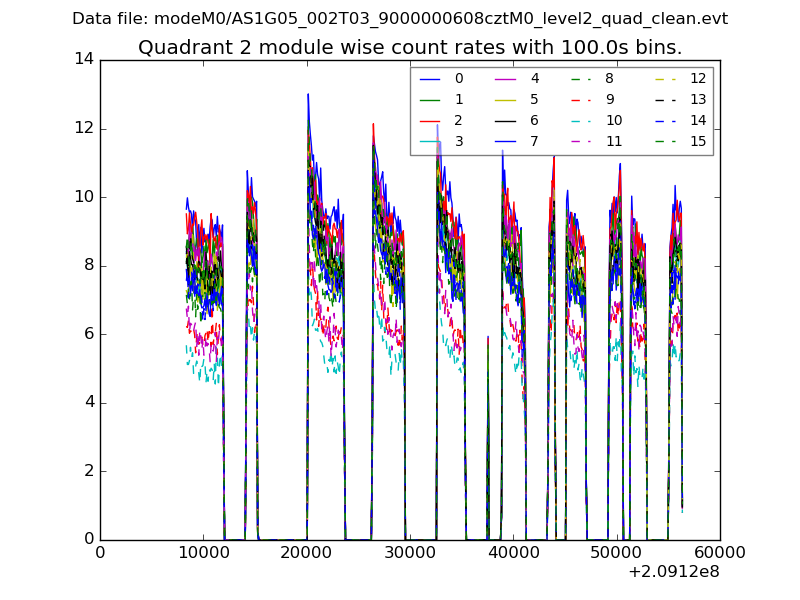 |
 |
| Module-wise count rates for Quadrant D Data is divided into 100 sec bins |
 |
 |
| Parameter | Plot |
|---|---|
| CZT HV Monitor |  |
| D_VDD |  |
| Temperature 1 |  |
| Veto HV Monitor | 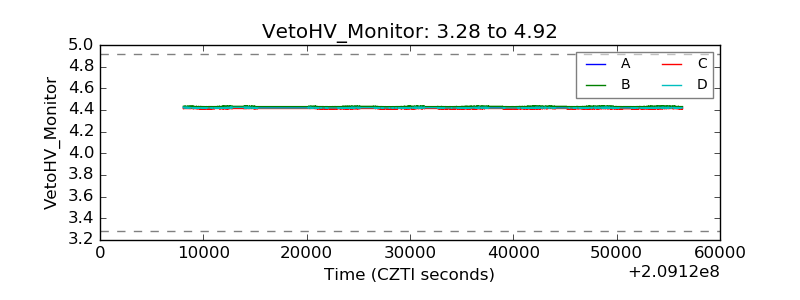 |
| Veto LLD |  |
| Alpha Counter |  |
| _CPM_Rate |  |
| CZT Counter |  |
| +2.5 Volts monitor |  |
| +5 Volts monitor |  |
| _ROLL_ROT | 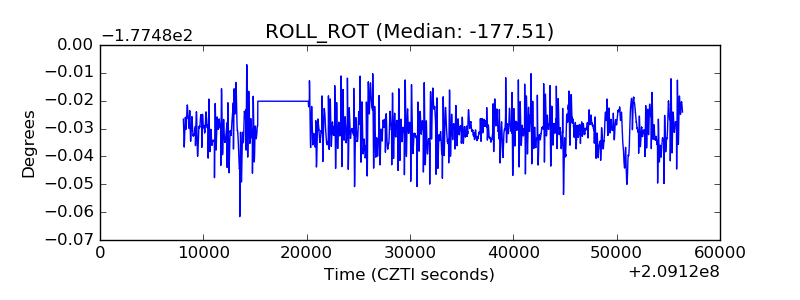 |
| _Roll_DEC | 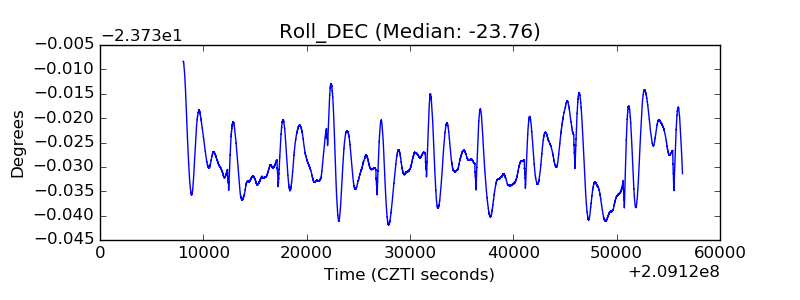 |
| _Roll_RA |  |
| Veto Counter |  |