| Param | Original file | Final file |
|---|---|---|
| Filename | modeM0/AS1G05_002T03_9000000608_04802cztM0_level2.evt | modeM0/AS1G05_002T03_9000000608_04802cztM0_level2_quad_clean.evt |
| Size (bytes) | 442,287,360 | 79,502,400 |
| Size | 421.8 MB | 75.8 MB |
| Events in quadrant A | 3,523,989 | 491,353 |
| Events in quadrant B | 3,084,614 | 502,665 |
| Events in quadrant C | 2,797,954 | 506,363 |
| Events in quadrant D | 3,572,185 | 479,718 |
| Mode M0 | |||
|---|---|---|---|
| Quadrant | BADHDUFLAG | Total packets | Discarded packets |
| A | 0 | 14434 | 2 |
| B | 0 | 13102 | 1 |
| C | 0 | 12526 | 1 |
| D | 0 | 14918 | 1 |
| Mode SS | |||
|---|---|---|---|
| Quadrant | BADHDUFLAG | Total packets | Discarded packets |
| A | 0 | 124 | 0 |
| B | 0 | 124 | 0 |
| C | 0 | 124 | 0 |
| D | 0 | 124 | 0 |
| Mode M9 | |||
|---|---|---|---|
| Quadrant | BADHDUFLAG | Total packets | Discarded packets |
| A | 0 | 11 | 0 |
| B | 0 | 11 | 0 |
| C | 0 | 11 | 0 |
| D | 0 | 11 | 0 |
| Quadrant | Total seconds | Saturated seconds | Saturation percentage |
|---|---|---|---|
| A | 6121 | 173 | 2.826336% |
| B | 6121 | 52 | 0.849534% |
| C | 6121 | 37 | 0.604476% |
| D | 6121 | 139 | 2.270871% |
Noise dominated data is calculated using 1-second bins in cleaned event files. If a bin has >2000 counts, and if more than 50% of those come from <1% of pixels, then it is considered to be noise-dominated and hence unusable.
| Quadrant | # 1 sec bins | Bins with >0 counts | Bins with >2000 counts | High rate bins dominated by noise | Noise dominated (total time) | Noise dominated (detector-on time) | Marked lightcurve |
|---|---|---|---|---|---|---|---|
| A | 7196 | 6121 | 79 | 79 | 1.10% | 1.29% | 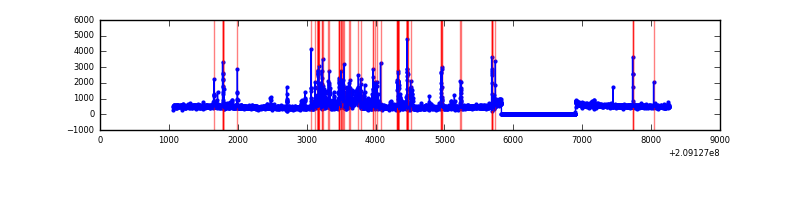 |
| B | 7196 | 6121 | 4 | 4 | 0.06% | 0.07% | 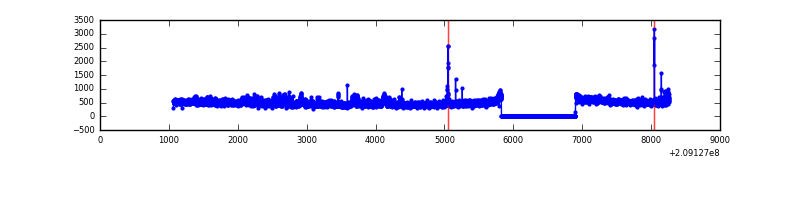 |
| C | 7196 | 6121 | 1 | 1 | 0.01% | 0.02% | 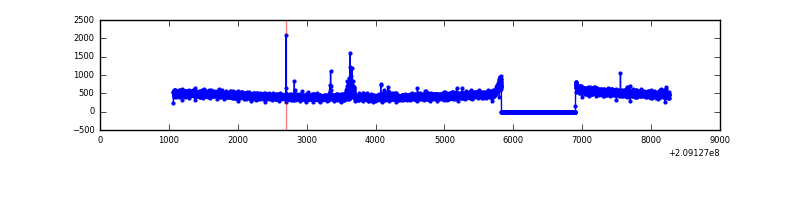 |
| D | 7196 | 6121 | 72 | 72 | 1.00% | 1.18% | 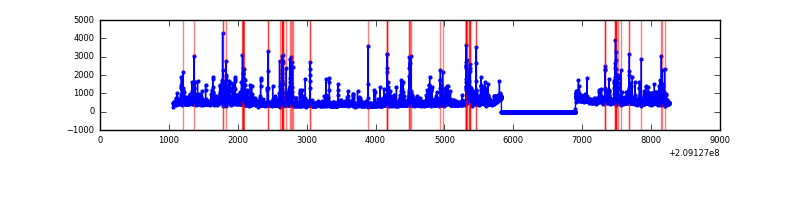 |
Top three noisy pixels from each quadrant. If the there are fewer than three noisy pixels in the level2.evt file, extra rows are filled as -1
| Pixel properties | Quadrant properties | ||||||
|---|---|---|---|---|---|---|---|
| Quadrant | DetID | PixID | Counts | Sigma | Mean | Median | Sigma |
| A | 0 | 50 | 528757 | 3516.81 | 729 | 712 | 150.1 |
| A | 13 | 251 | 118901 | 787.15 | 729 | 712 | 150.1 |
| A | 15 | 174 | 29020 | 188.53 | 729 | 712 | 150.1 |
| B | 15 | 204 | 119439 | 832.88 | 736 | 718 | 142.5 |
| B | 5 | 175 | 45864 | 316.72 | 736 | 718 | 142.5 |
| B | 10 | 16 | 36905 | 253.87 | 736 | 718 | 142.5 |
| C | 12 | 4 | 28300 | 167.28 | 708 | 711 | 164.9 |
| C | 13 | 61 | 5800 | 30.86 | 708 | 711 | 164.9 |
| C | 1 | 16 | 5071 | 26.44 | 708 | 711 | 164.9 |
| D | 13 | 235 | 272103 | 1596.13 | 706 | 687 | 170.0 |
| D | 2 | 234 | 172504 | 1010.41 | 706 | 687 | 170.0 |
| D | 2 | 136 | 157306 | 921.04 | 706 | 687 | 170.0 |
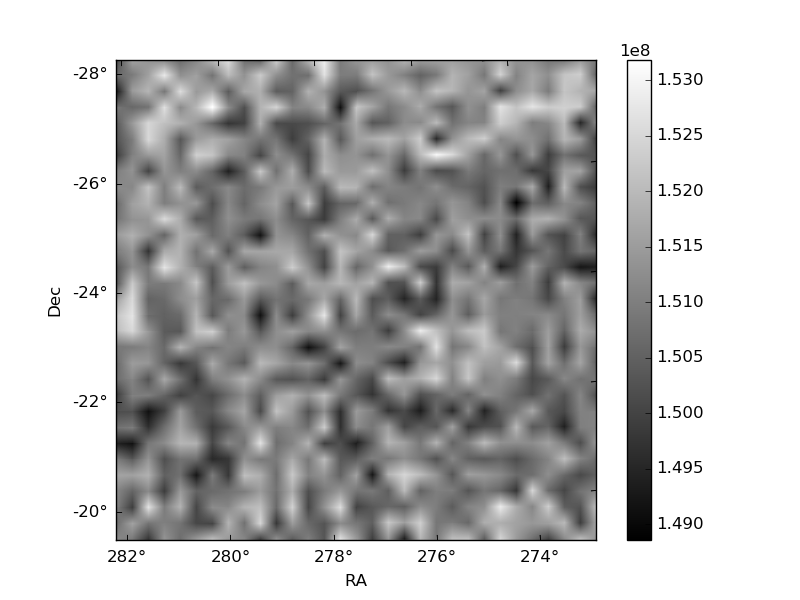
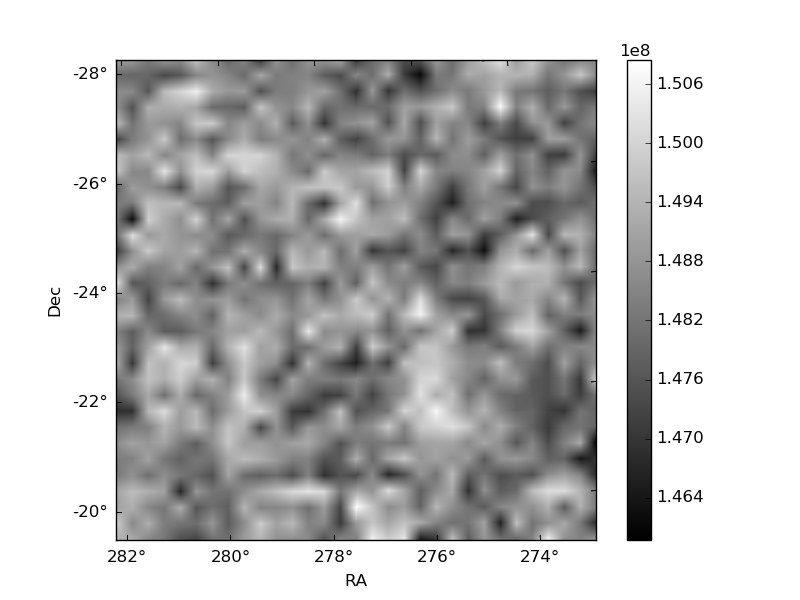
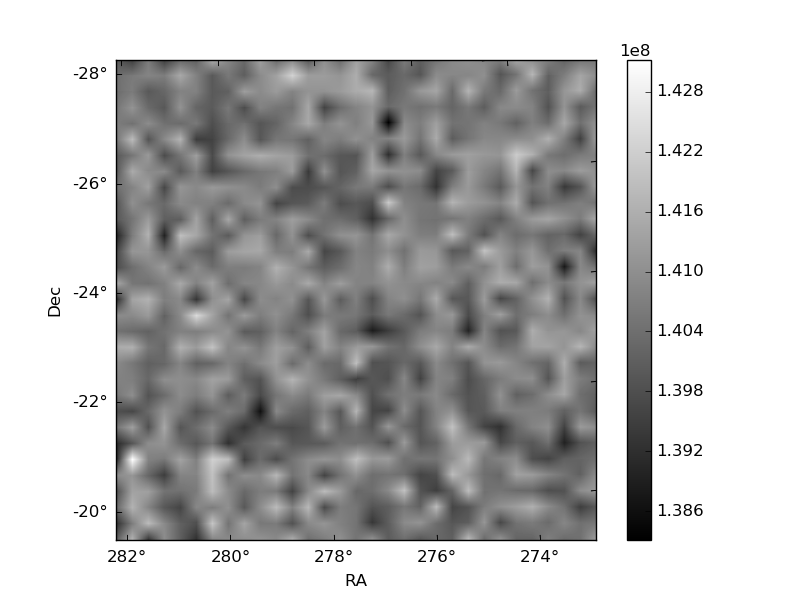
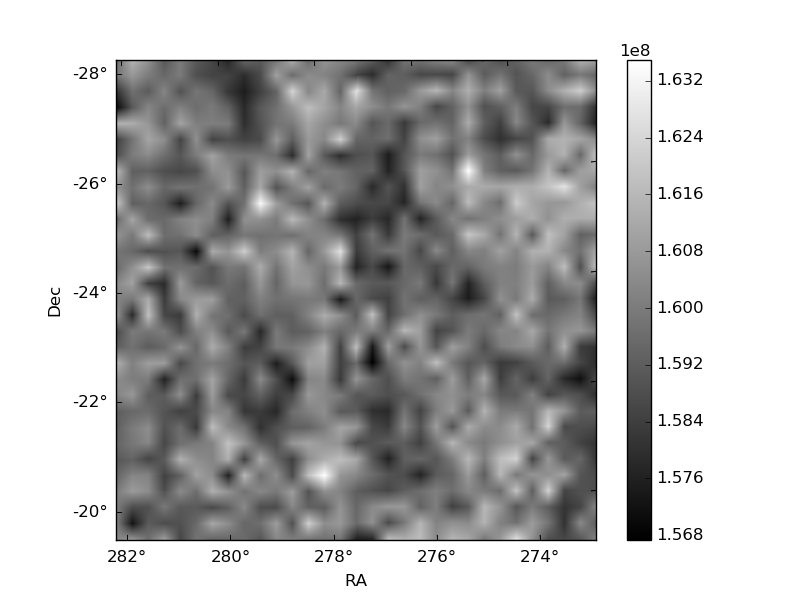
Histogram calculated using DETX and DETY for each event in the final _common_clean file
| Quadrant A | 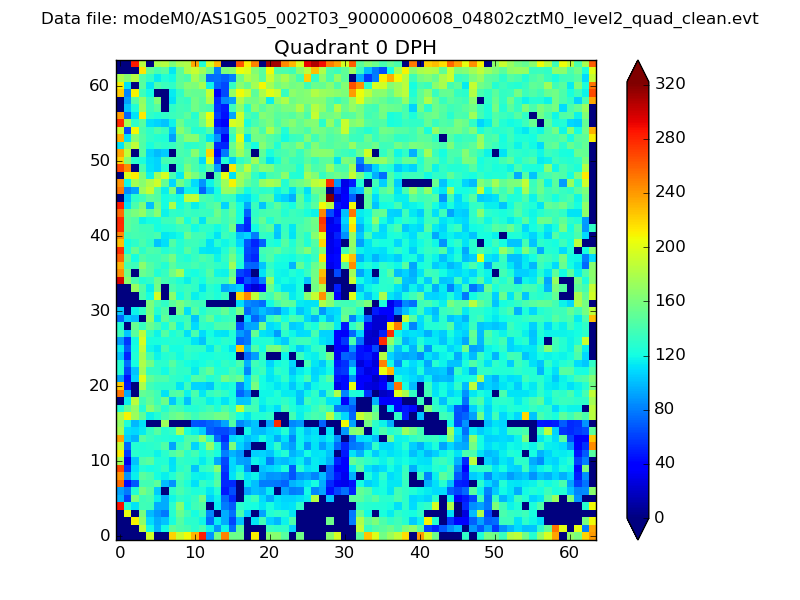 |
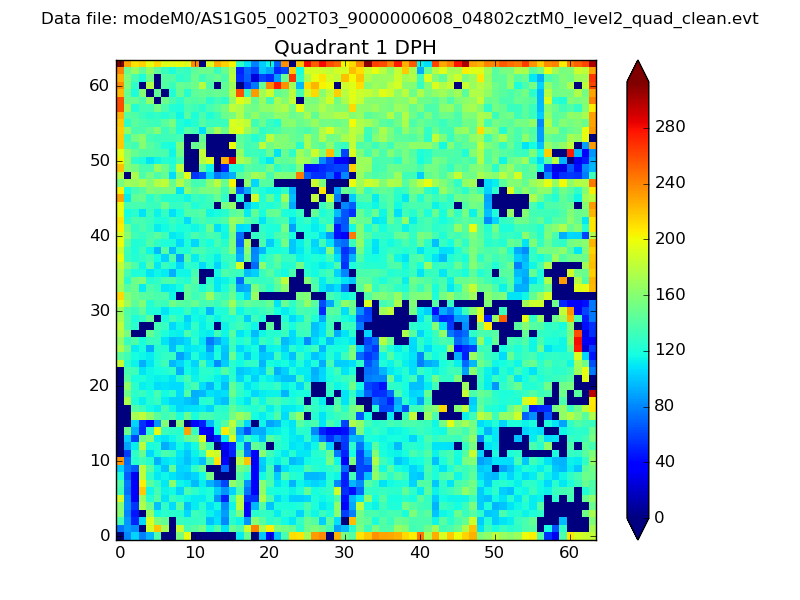 |
Quadrant B |
|---|---|---|---|
| Quadrant D | 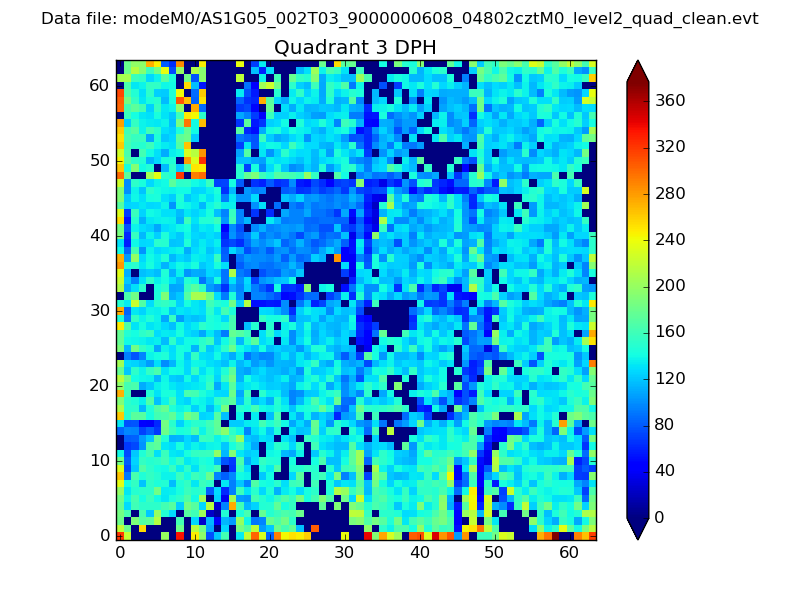 |
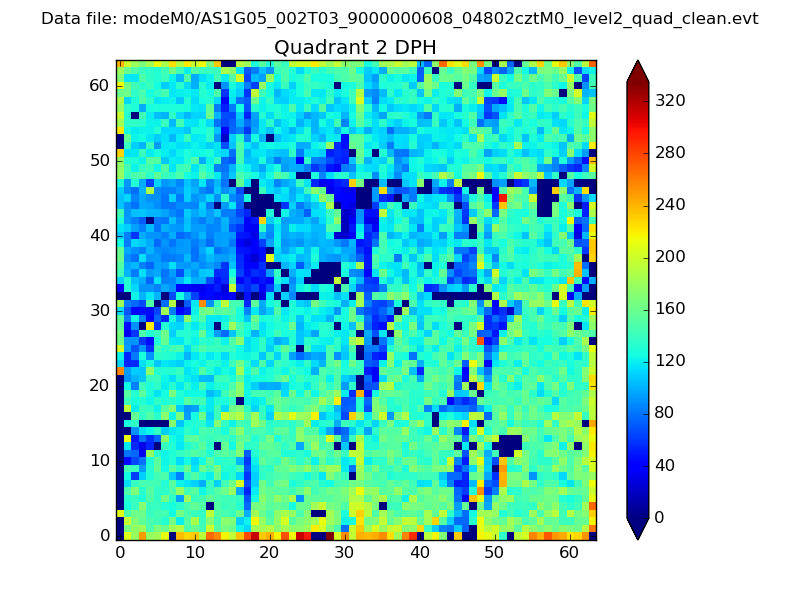 |
Quadrant C |
| Plot type | Count rate plots | Images |
|---|---|---|
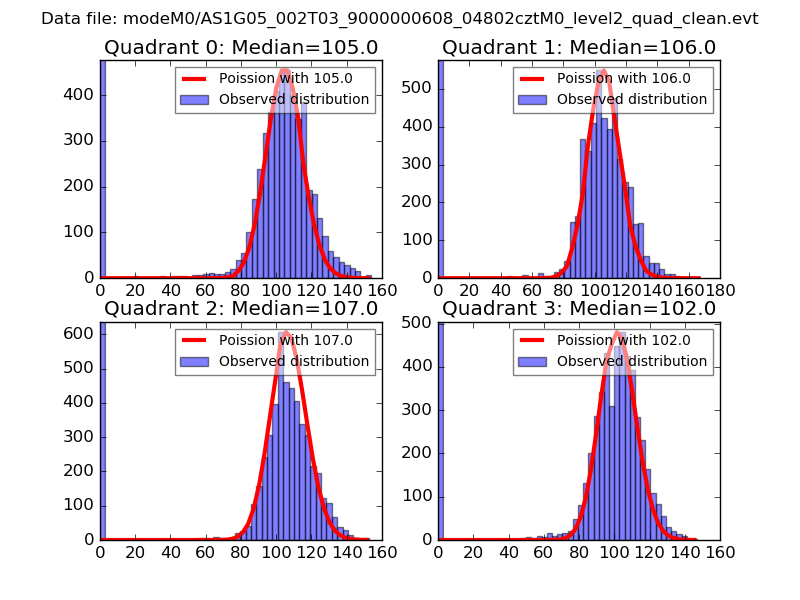
| Comparison with Poisson distribution Blue bars denote a histogram of data divided into 1 sec bins. Red curve is a Poisson curve with rate = median count rate of data. |
 |
 |
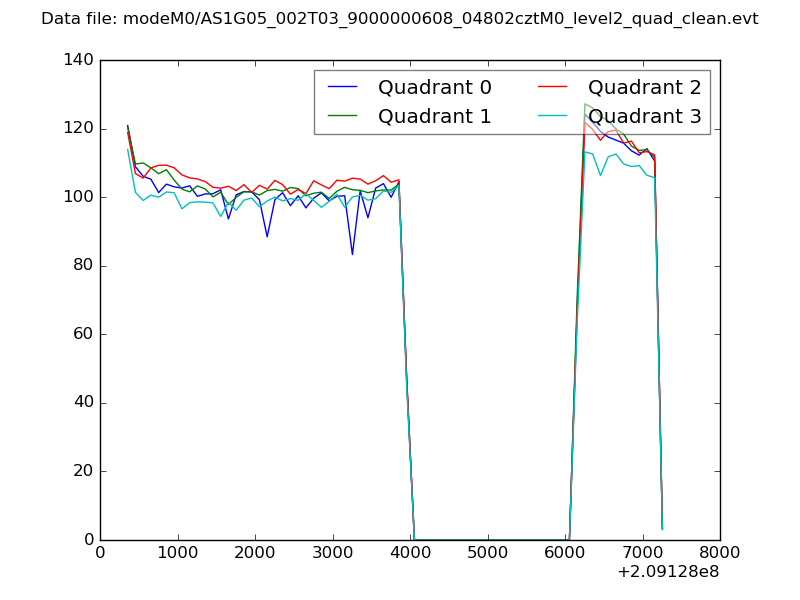
| Quadrant-wise count rates Data is divided into 100 sec bins |
 |
|
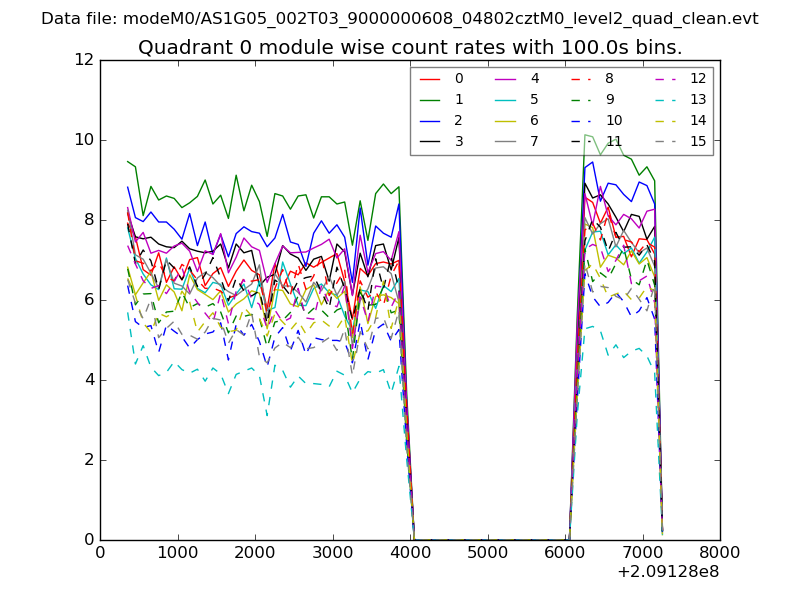
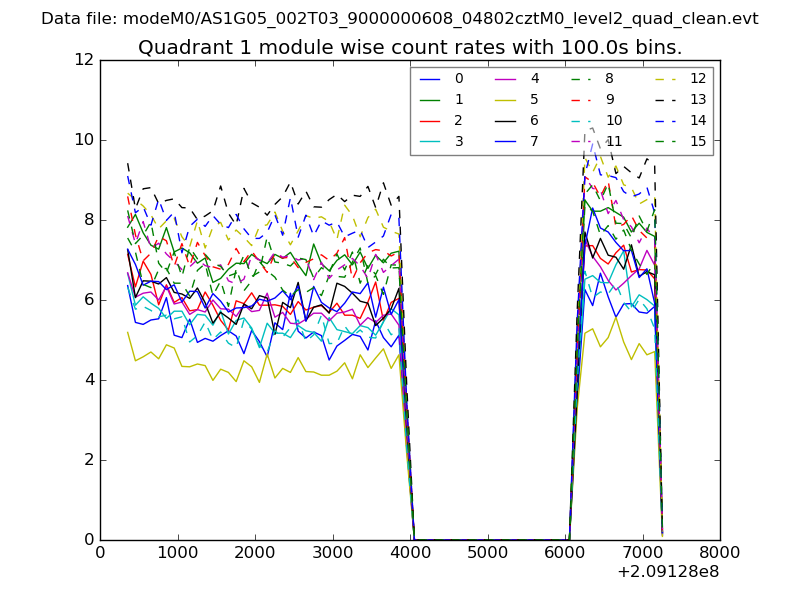
| Module-wise count rates for Quadrant A Data is divided into 100 sec bins |
 |
 |
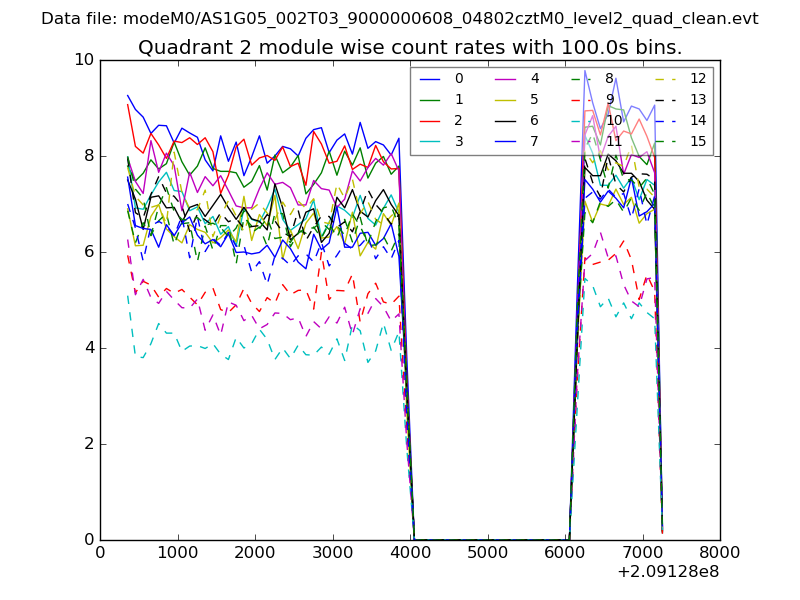
| Module-wise count rates for Quadrant B Data is divided into 100 sec bins |
 |
 |
| Module-wise count rates for Quadrant C Data is divided into 100 sec bins |
 |
 |
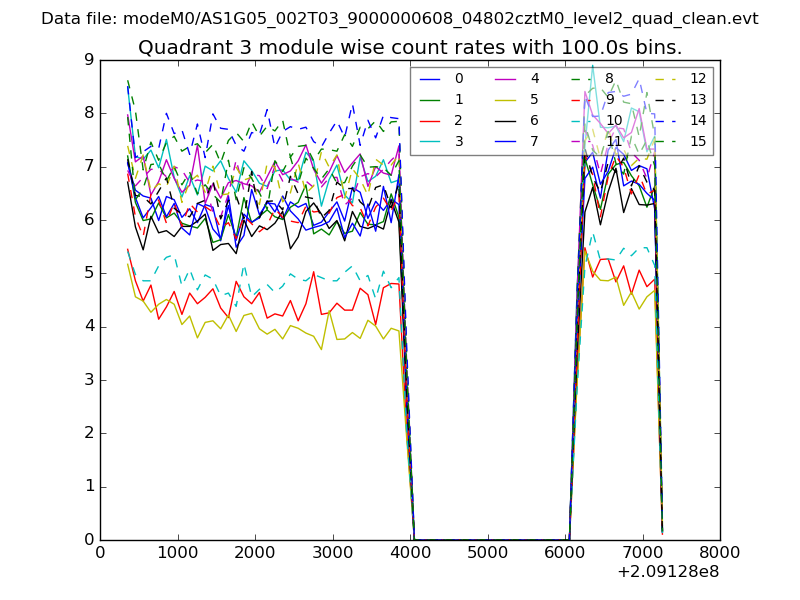
| Module-wise count rates for Quadrant D Data is divided into 100 sec bins |
 |
 |
| Parameter | Plot |
|---|---|
| CZT HV Monitor | 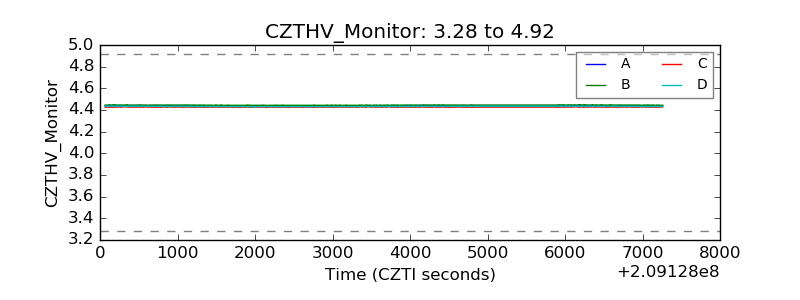 |
| D_VDD | 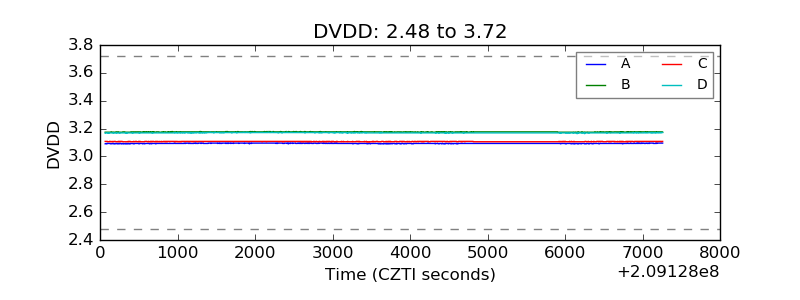 |
| Temperature 1 | 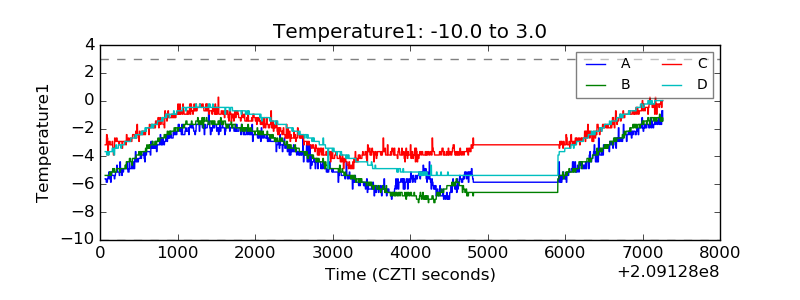 |
| Veto HV Monitor | 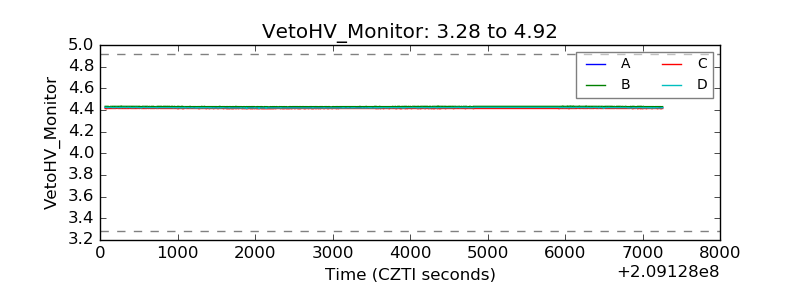 |
| Veto LLD | 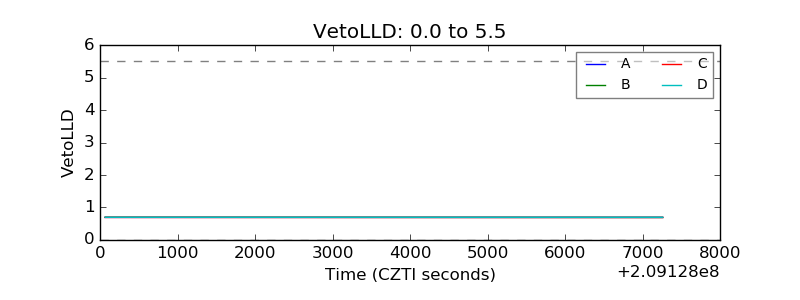 |
| Alpha Counter | 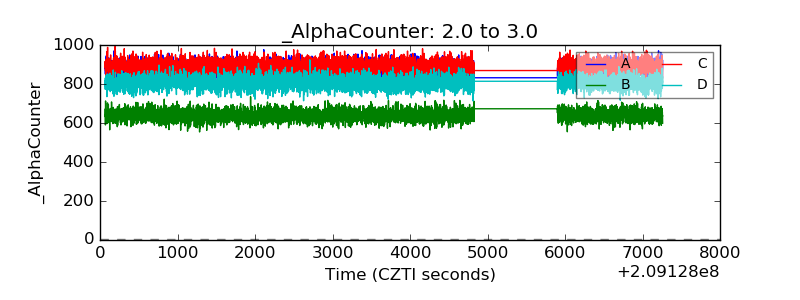 |
| _CPM_Rate | 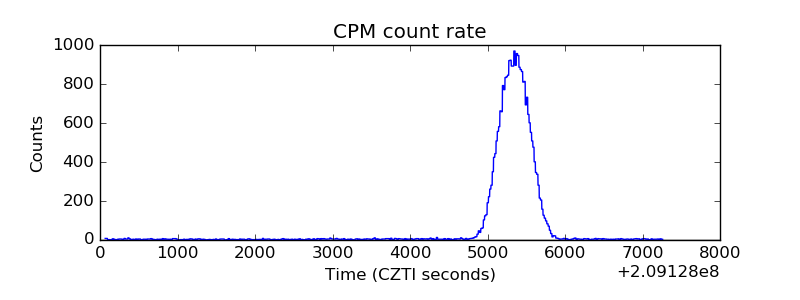 |
| CZT Counter | 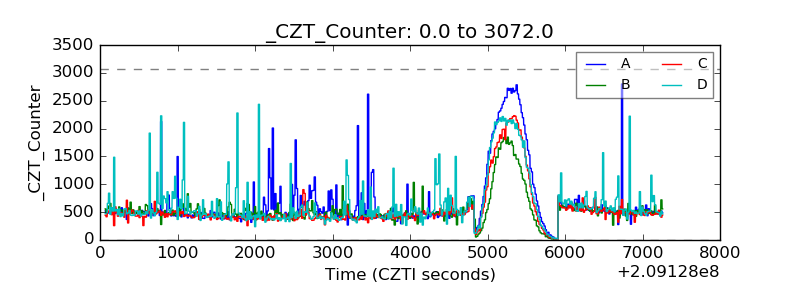 |
| +2.5 Volts monitor |  |
| +5 Volts monitor |  |
| _ROLL_ROT | 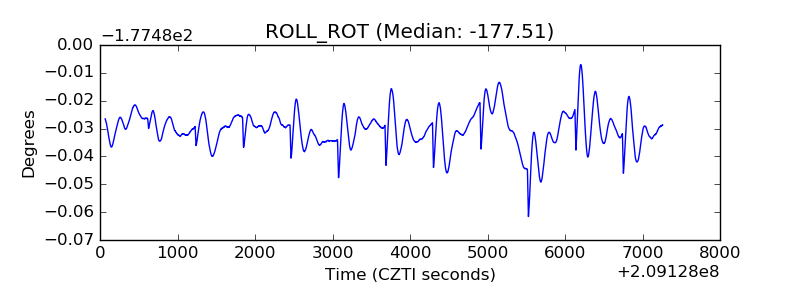 |
| _Roll_DEC | 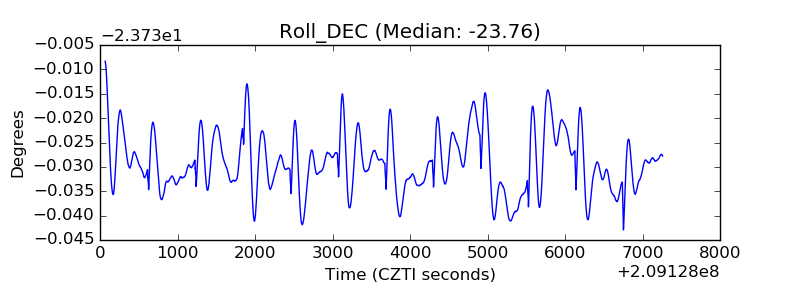 |
| _Roll_RA | 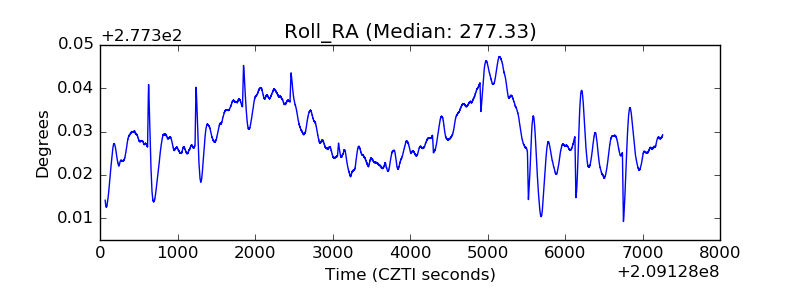 |
| Veto Counter | 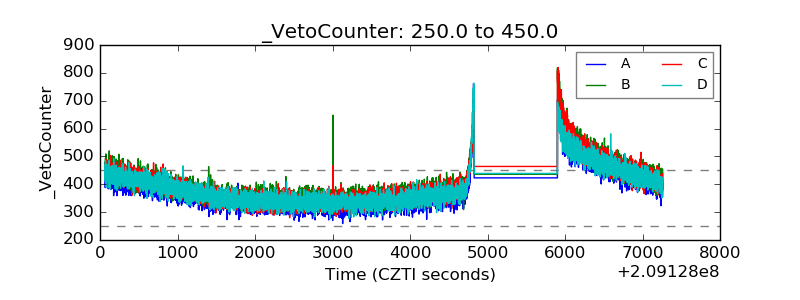 |