| Param | Original file | Final file |
|---|---|---|
| Filename | modeM0/AS1G05_002T03_9000000608_04806cztM0_level2.evt | modeM0/AS1G05_002T03_9000000608_04806cztM0_level2_quad_clean.evt |
| Size (bytes) | 434,874,240 | 75,582,720 |
| Size | 414.7 MB | 72.1 MB |
| Events in quadrant A | 3,072,270 | 466,020 |
| Events in quadrant B | 3,268,067 | 467,390 |
| Events in quadrant C | 2,865,128 | 469,250 |
| Events in quadrant D | 3,536,276 | 446,267 |
| Mode M0 | |||
|---|---|---|---|
| Quadrant | BADHDUFLAG | Total packets | Discarded packets |
| A | 0 | 13430 | 3 |
| B | 0 | 13917 | 2 |
| C | 0 | 12997 | 2 |
| D | 0 | 14838 | 2 |
| Mode SS | |||
|---|---|---|---|
| Quadrant | BADHDUFLAG | Total packets | Discarded packets |
| A | 0 | 128 | 0 |
| B | 0 | 128 | 0 |
| C | 0 | 128 | 0 |
| D | 0 | 128 | 0 |
| Mode M9 | |||
|---|---|---|---|
| Quadrant | BADHDUFLAG | Total packets | Discarded packets |
| A | 0 | 19 | 0 |
| B | 0 | 19 | 0 |
| C | 0 | 19 | 0 |
| D | 0 | 20 | 0 |
| Quadrant | Total seconds | Saturated seconds | Saturation percentage |
|---|---|---|---|
| A | 6301 | 52 | 0.825266% |
| B | 6301 | 47 | 0.745913% |
| C | 6301 | 7 | 0.111093% |
| D | 6301 | 180 | 2.856689% |
Noise dominated data is calculated using 1-second bins in cleaned event files. If a bin has >2000 counts, and if more than 50% of those come from <1% of pixels, then it is considered to be noise-dominated and hence unusable.
| Quadrant | # 1 sec bins | Bins with >0 counts | Bins with >2000 counts | High rate bins dominated by noise | Noise dominated (total time) | Noise dominated (detector-on time) | Marked lightcurve |
|---|---|---|---|---|---|---|---|
| A | 7611 | 6302 | 12 | 12 | 0.16% | 0.19% | 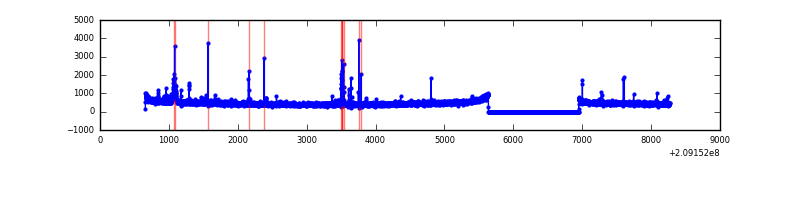 |
| B | 7611 | 6302 | 8 | 8 | 0.11% | 0.13% | 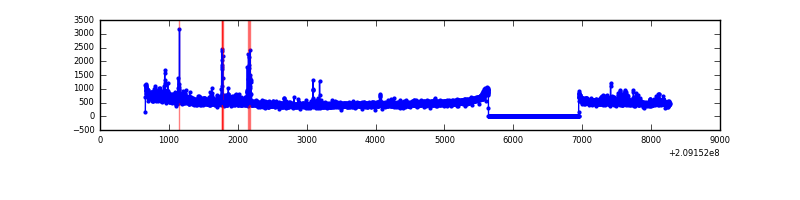 |
| C | 7611 | 6302 | 0 | 0 | 0.00% | 0.00% | 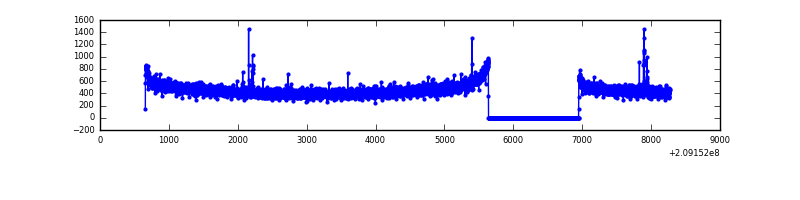 |
| D | 7611 | 6302 | 130 | 130 | 1.71% | 2.06% |  |
Top three noisy pixels from each quadrant. If the there are fewer than three noisy pixels in the level2.evt file, extra rows are filled as -1
| Pixel properties | Quadrant properties | ||||||
|---|---|---|---|---|---|---|---|
| Quadrant | DetID | PixID | Counts | Sigma | Mean | Median | Sigma |
| A | 0 | 50 | 76758 | 491.34 | 757 | 743 | 154.7 |
| A | 13 | 251 | 35507 | 224.7 | 757 | 743 | 154.7 |
| A | 8 | 15 | 27676 | 174.09 | 757 | 743 | 154.7 |
| B | 15 | 204 | 171342 | 1157.19 | 765 | 747 | 147.4 |
| B | 8 | 3 | 41150 | 274.06 | 765 | 747 | 147.4 |
| B | 15 | 54 | 25922 | 170.77 | 765 | 747 | 147.4 |
| C | 12 | 4 | 21851 | 124.61 | 728 | 733 | 169.5 |
| C | 13 | 61 | 6160 | 32.02 | 728 | 733 | 169.5 |
| C | 3 | 202 | 1842 | 6.54 | 728 | 733 | 169.5 |
| D | 13 | 235 | 542482 | 3124.63 | 717 | 698 | 173.4 |
| D | 2 | 136 | 142803 | 819.56 | 717 | 698 | 173.4 |
| D | 2 | 234 | 47420 | 269.46 | 717 | 698 | 173.4 |
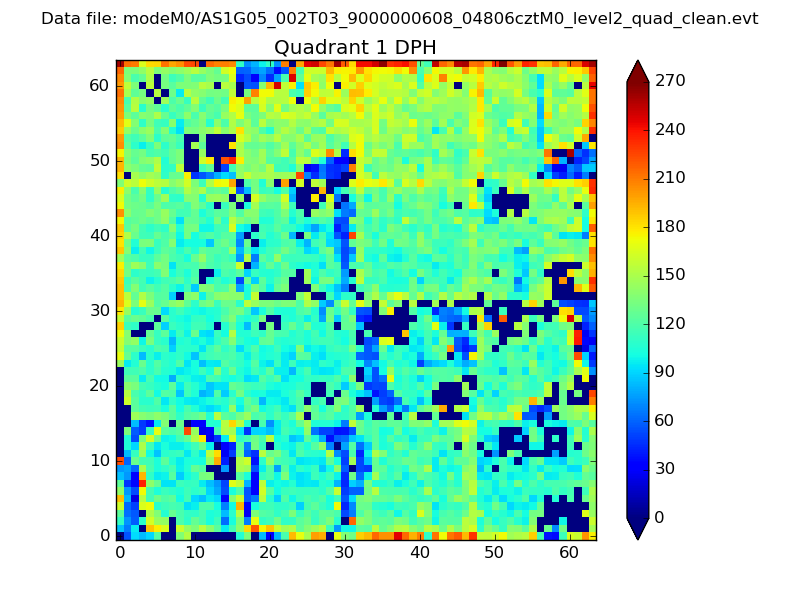
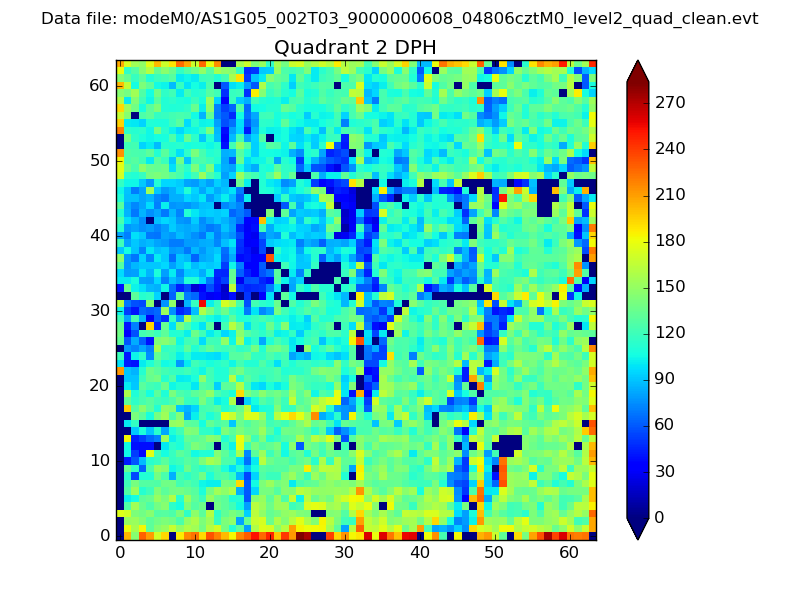
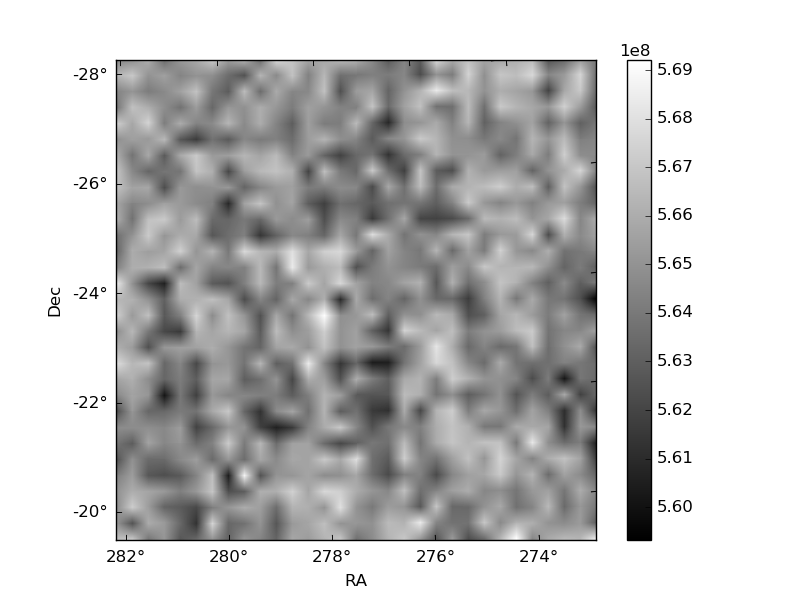
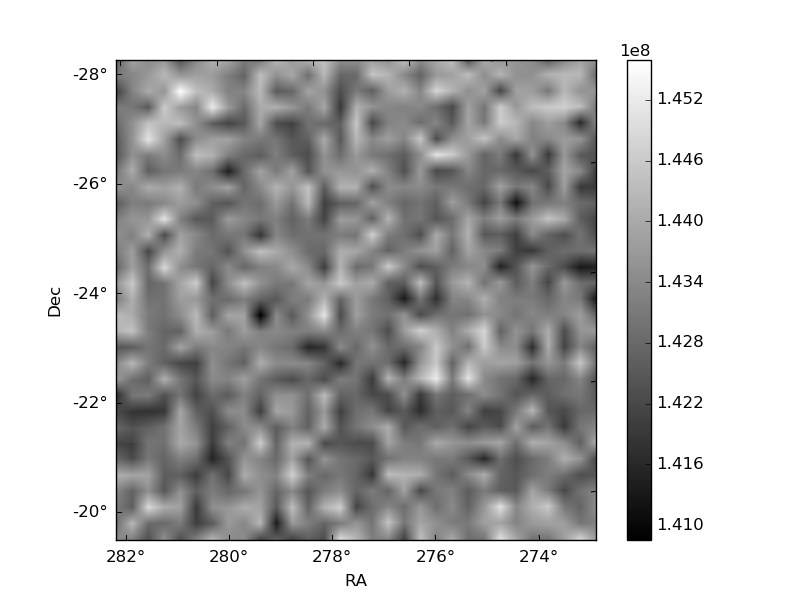
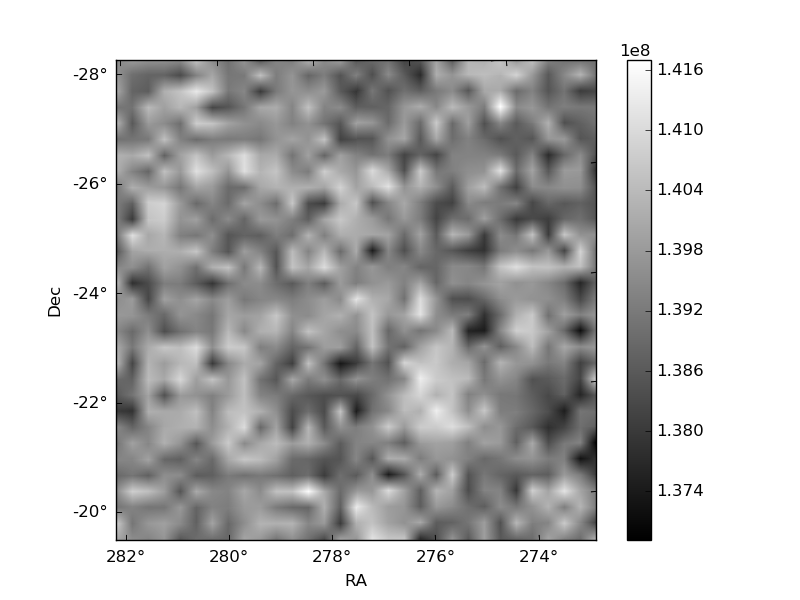
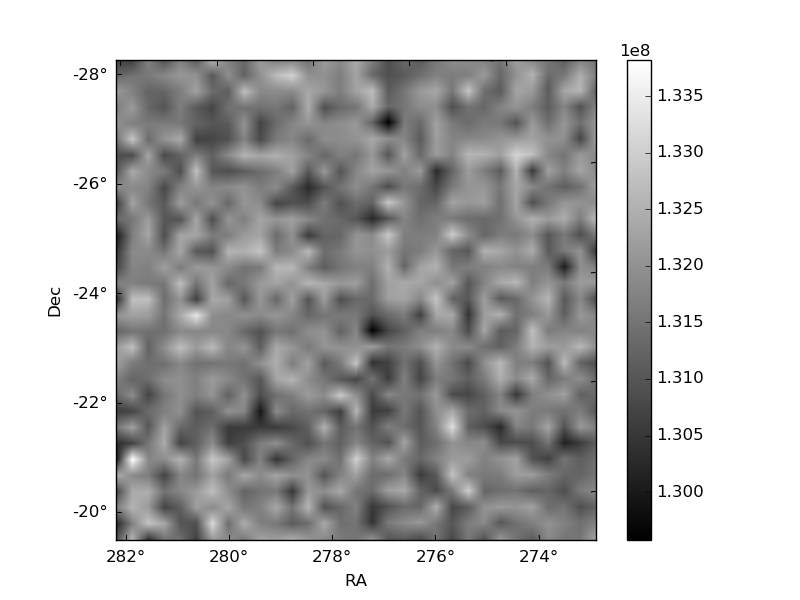
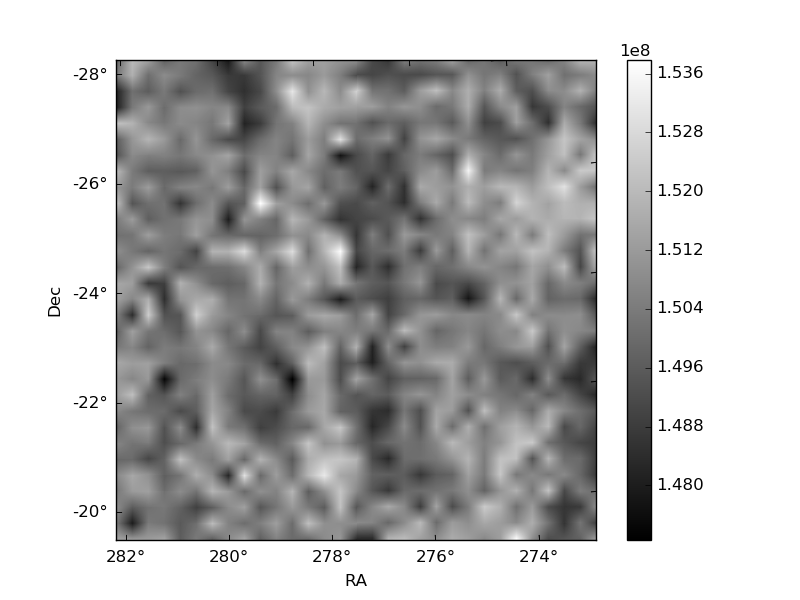
Histogram calculated using DETX and DETY for each event in the final _common_clean file
| Quadrant A | 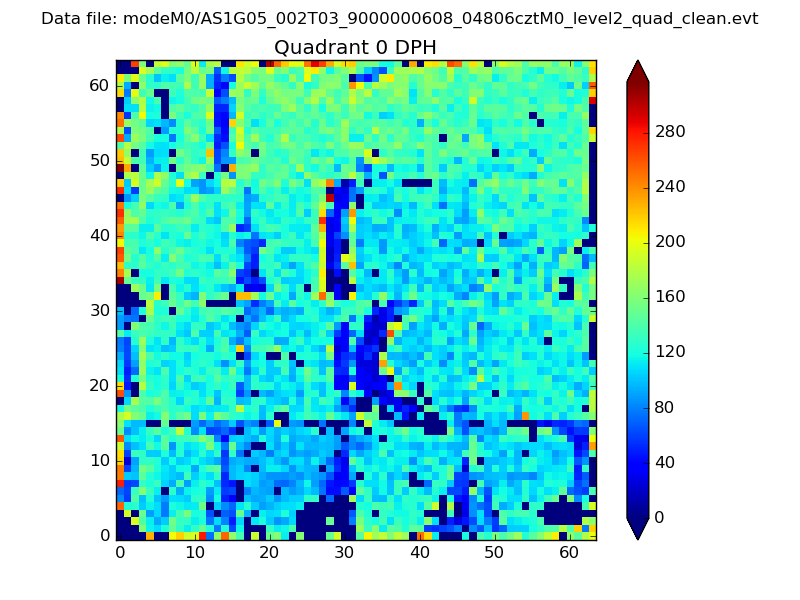 |
 |
Quadrant B |
|---|---|---|---|
| Quadrant D | 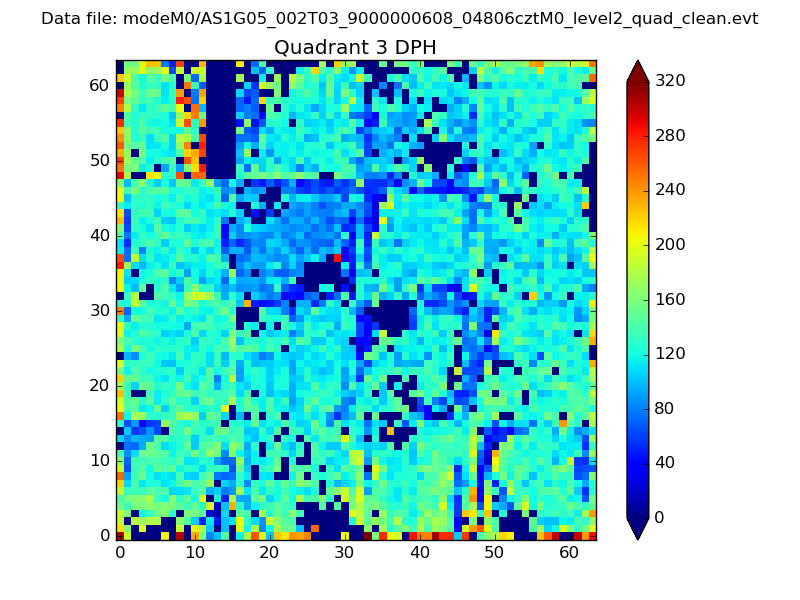 |
 |
Quadrant C |
| Plot type | Count rate plots | Images |
|---|---|---|
| Comparison with Poisson distribution Blue bars denote a histogram of data divided into 1 sec bins. Red curve is a Poisson curve with rate = median count rate of data. |
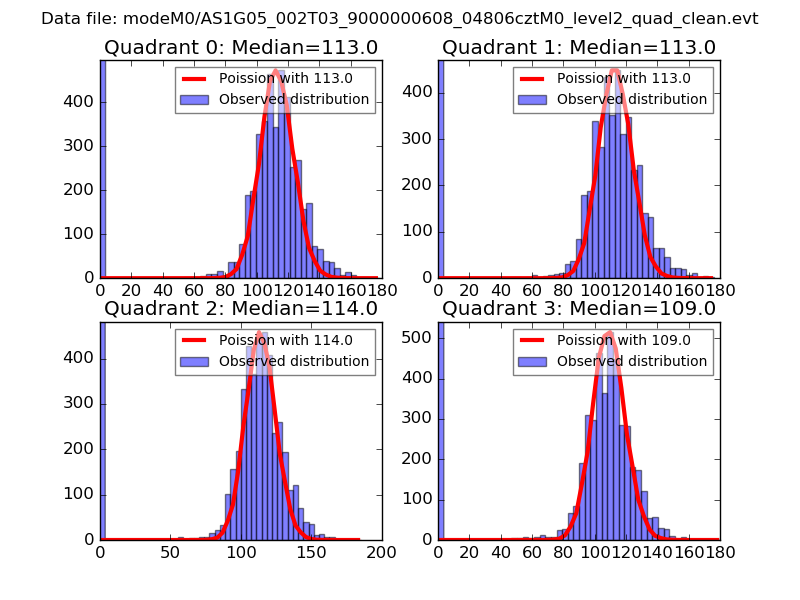 |
 |
| Quadrant-wise count rates Data is divided into 100 sec bins |
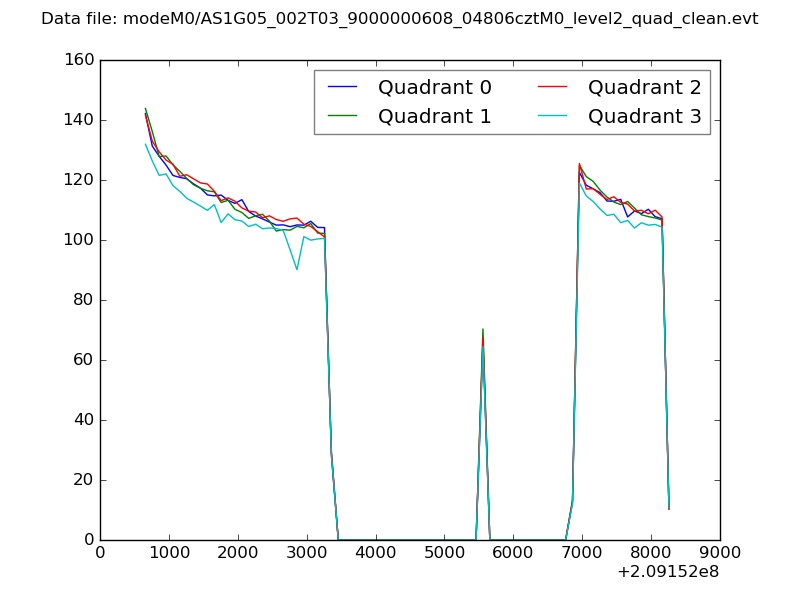 |
|
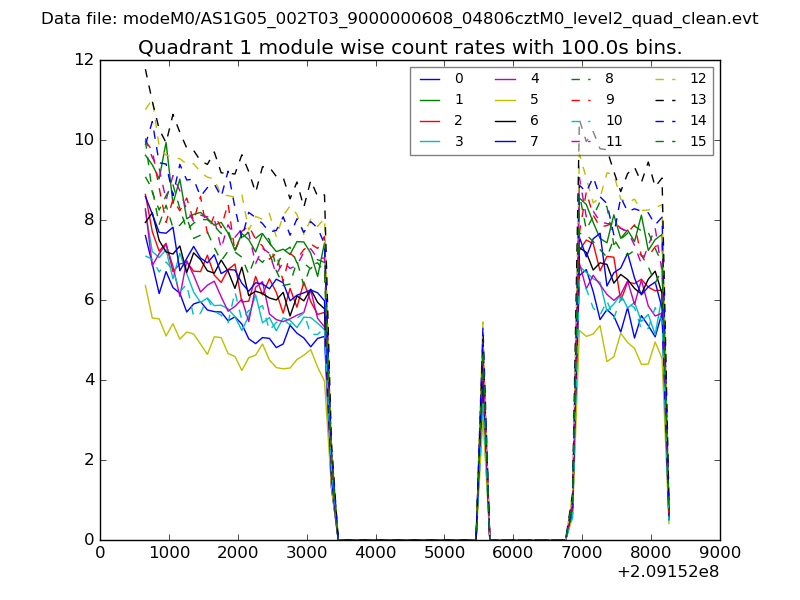
| Module-wise count rates for Quadrant A Data is divided into 100 sec bins |
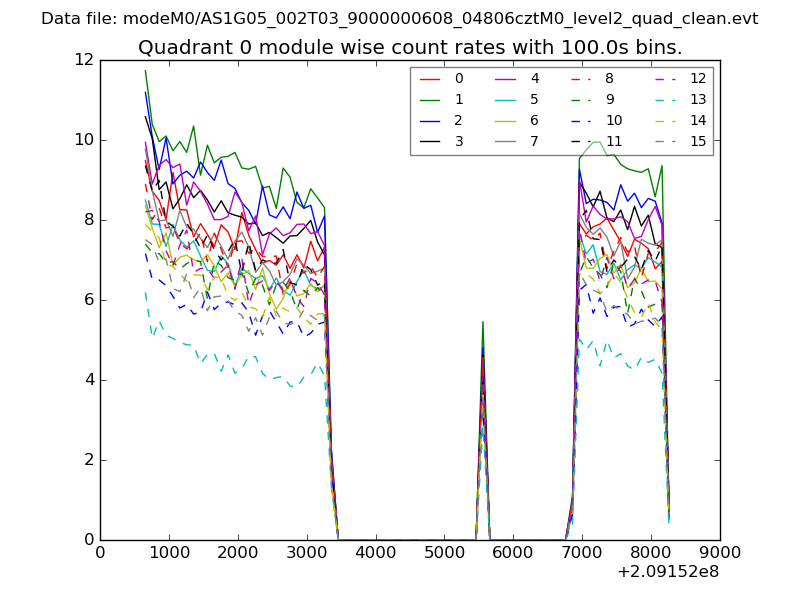 |
 |
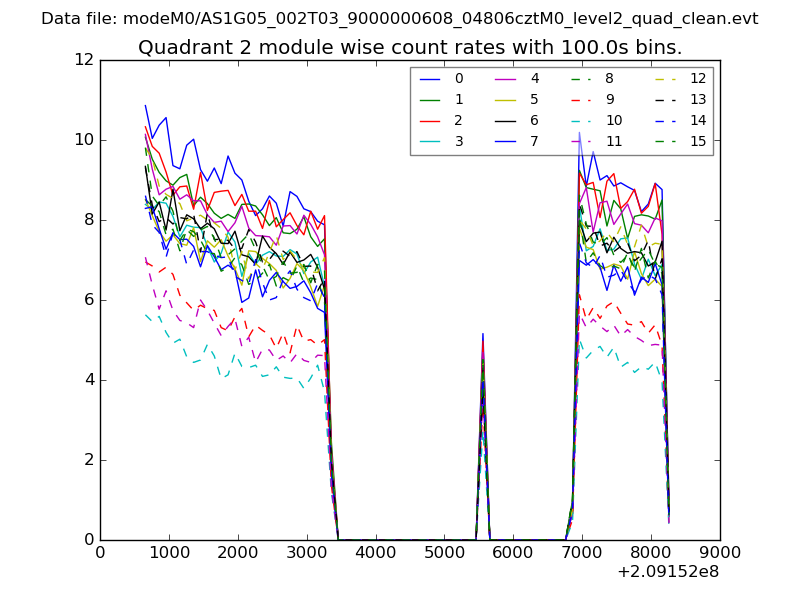
| Module-wise count rates for Quadrant B Data is divided into 100 sec bins |
 |
 |
| Module-wise count rates for Quadrant C Data is divided into 100 sec bins |
 |
 |
| Module-wise count rates for Quadrant D Data is divided into 100 sec bins |
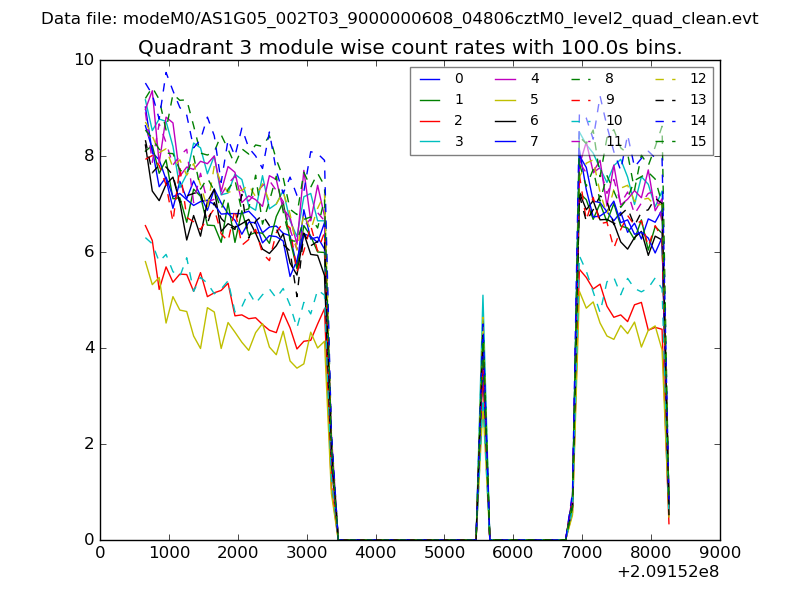 |
 |
| Parameter | Plot |
|---|---|
| CZT HV Monitor | 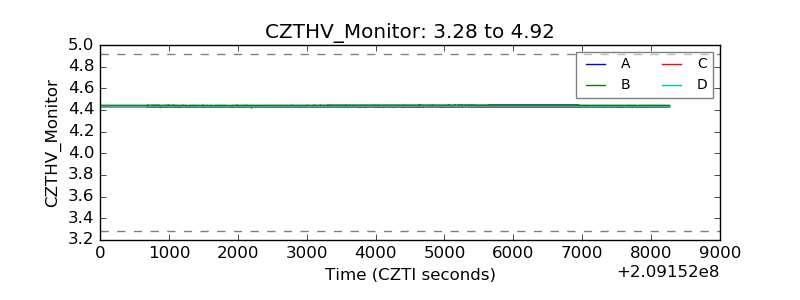 |
| D_VDD | 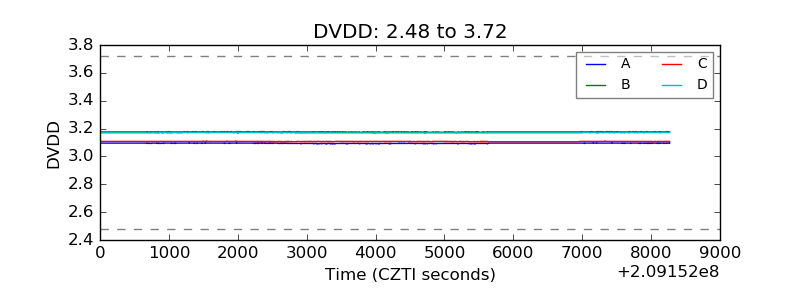 |
| Temperature 1 | 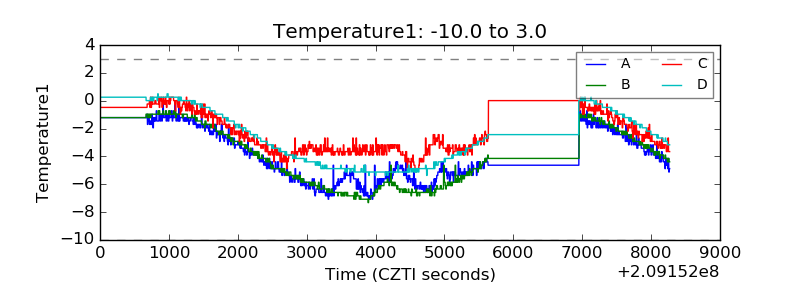 |
| Veto HV Monitor | 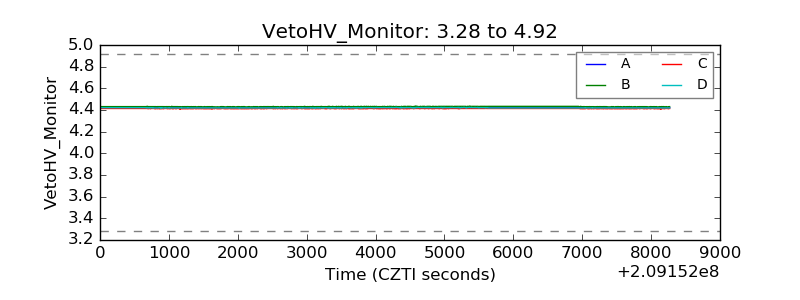 |
| Veto LLD |  |
| Alpha Counter | 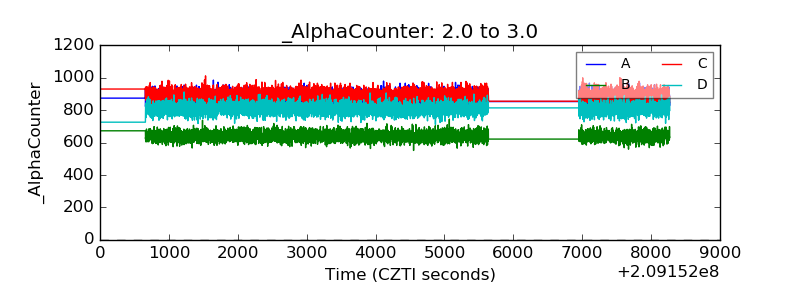 |
| _CPM_Rate | 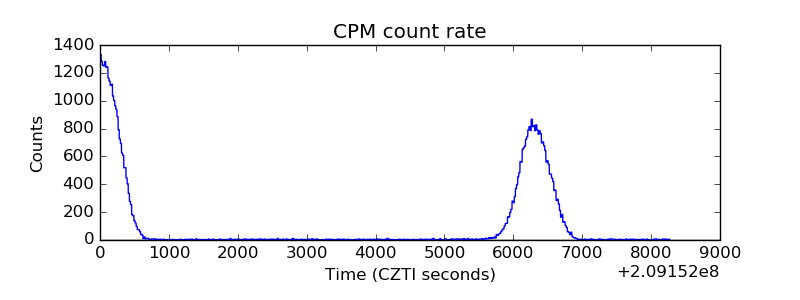 |
| CZT Counter | 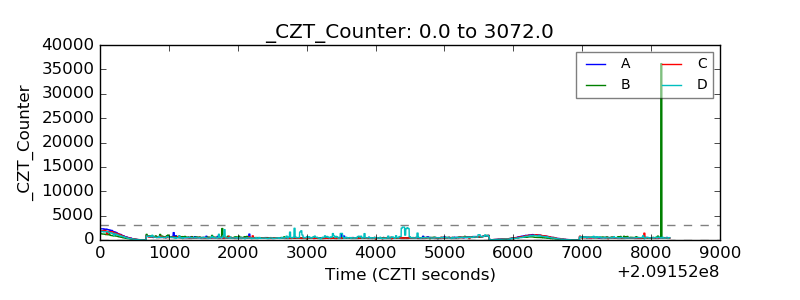 |
| +2.5 Volts monitor |  |
| +5 Volts monitor | 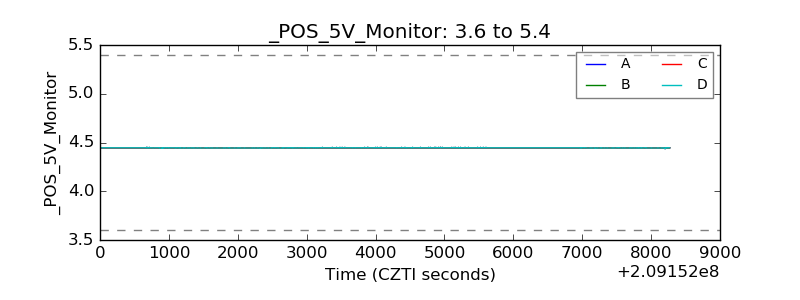 |
| _ROLL_ROT | 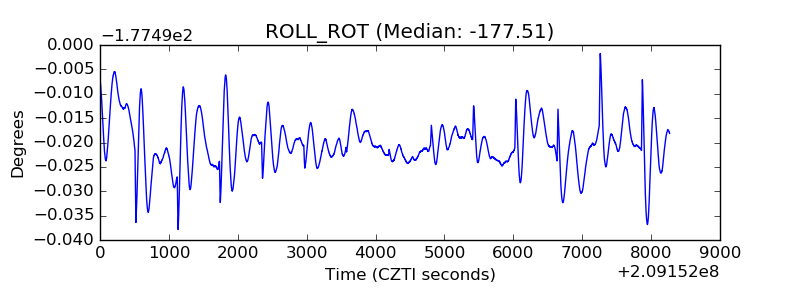 |
| _Roll_DEC | 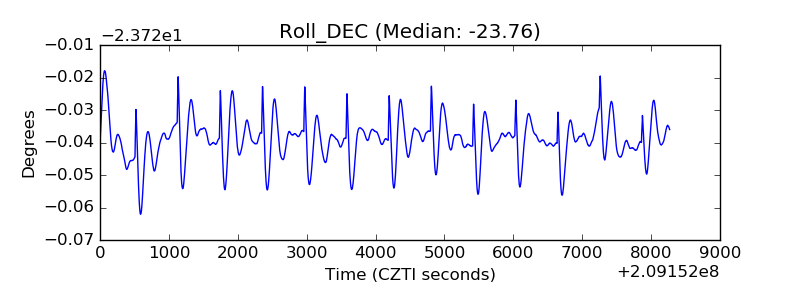 |
| _Roll_RA | 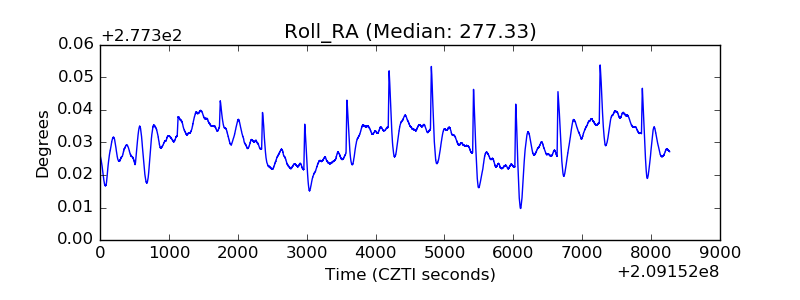 |
| Veto Counter | 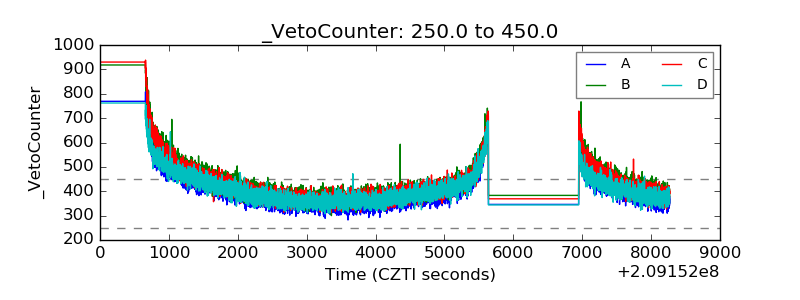 |