| Param | Original file | Final file |
|---|---|---|
| Filename | modeM0/AS1G05_002T03_9000000608_04808cztM0_level2.evt | modeM0/AS1G05_002T03_9000000608_04808cztM0_level2_quad_clean.evt |
| Size (bytes) | 615,104,640 | 79,879,680 |
| Size | 586.6 MB | 76.2 MB |
| Events in quadrant A | 3,204,058 | 501,266 |
| Events in quadrant B | 3,404,328 | 503,508 |
| Events in quadrant C | 3,355,708 | 505,499 |
| Events in quadrant D | 8,194,550 | 425,436 |
| Mode M0 | |||
|---|---|---|---|
| Quadrant | BADHDUFLAG | Total packets | Discarded packets |
| A | 0 | 14368 | 3 |
| B | 0 | 14816 | 2 |
| C | 0 | 15020 | 2 |
| D | 0 | 29173 | 2 |
| Mode SS | |||
|---|---|---|---|
| Quadrant | BADHDUFLAG | Total packets | Discarded packets |
| A | 0 | 142 | 0 |
| B | 0 | 142 | 0 |
| C | 0 | 142 | 0 |
| D | 0 | 142 | 0 |
| Mode M9 | |||
|---|---|---|---|
| Quadrant | BADHDUFLAG | Total packets | Discarded packets |
| A | 0 | 8 | 0 |
| B | 0 | 8 | 0 |
| C | 0 | 8 | 0 |
| D | 0 | 9 | 0 |
| Quadrant | Total seconds | Saturated seconds | Saturation percentage |
|---|---|---|---|
| A | 6921 | 41 | 0.592400% |
| B | 6921 | 48 | 0.693541% |
| C | 6921 | 109 | 1.574917% |
| D | 6921 | 2013 | 29.085392% |
Noise dominated data is calculated using 1-second bins in cleaned event files. If a bin has >2000 counts, and if more than 50% of those come from <1% of pixels, then it is considered to be noise-dominated and hence unusable.
| Quadrant | # 1 sec bins | Bins with >0 counts | Bins with >2000 counts | High rate bins dominated by noise | Noise dominated (total time) | Noise dominated (detector-on time) | Marked lightcurve |
|---|---|---|---|---|---|---|---|
| A | 7676 | 6922 | 11 | 11 | 0.14% | 0.16% | 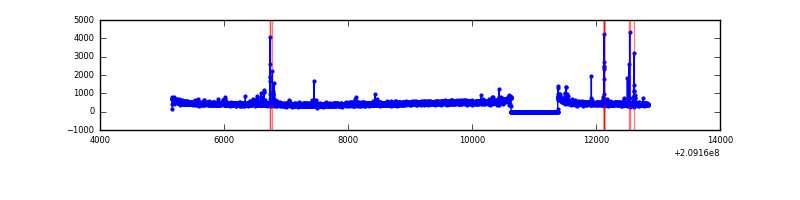 |
| B | 7676 | 6922 | 11 | 11 | 0.14% | 0.16% | 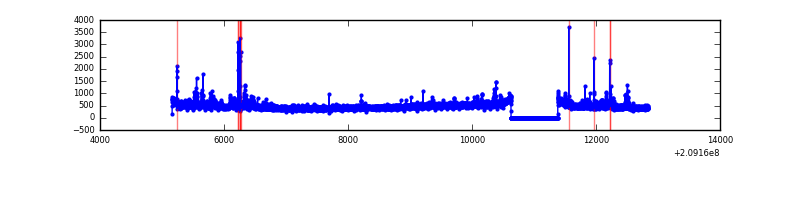 |
| C | 7676 | 6922 | 52 | 52 | 0.68% | 0.75% | 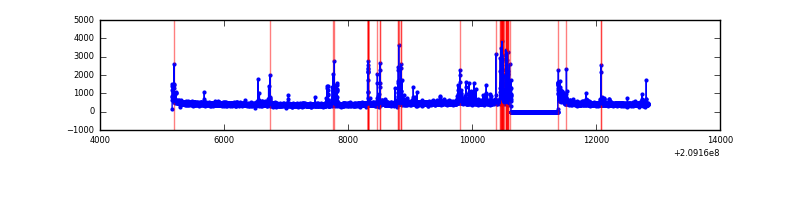 |
| D | 7676 | 6922 | 1951 | 1951 | 25.42% | 28.19% | 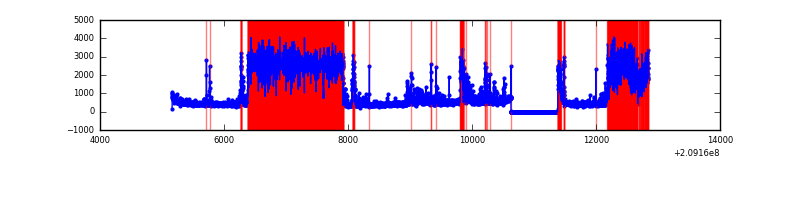 |
Top three noisy pixels from each quadrant. If the there are fewer than three noisy pixels in the level2.evt file, extra rows are filled as -1
| Pixel properties | Quadrant properties | ||||||
|---|---|---|---|---|---|---|---|
| Quadrant | DetID | PixID | Counts | Sigma | Mean | Median | Sigma |
| A | 13 | 251 | 75090 | 453.89 | 792 | 776 | 163.7 |
| A | 0 | 50 | 44939 | 269.74 | 792 | 776 | 163.7 |
| A | 13 | 6 | 12517 | 71.71 | 792 | 776 | 163.7 |
| B | 14 | 167 | 121829 | 781.4 | 803 | 783 | 154.9 |
| B | 8 | 3 | 34761 | 219.34 | 803 | 783 | 154.9 |
| B | 10 | 16 | 25164 | 157.39 | 803 | 783 | 154.9 |
| C | 9 | 247 | 358816 | 2003.69 | 764 | 767 | 178.7 |
| C | 13 | 61 | 6248 | 30.67 | 764 | 767 | 178.7 |
| C | 8 | 128 | 5557 | 26.8 | 764 | 767 | 178.7 |
| D | 13 | 235 | 4756542 | 28586.15 | 681 | 660 | 166.4 |
| D | 12 | 79 | 215256 | 1289.87 | 681 | 660 | 166.4 |
| D | 5 | 239 | 178960 | 1071.71 | 681 | 660 | 166.4 |
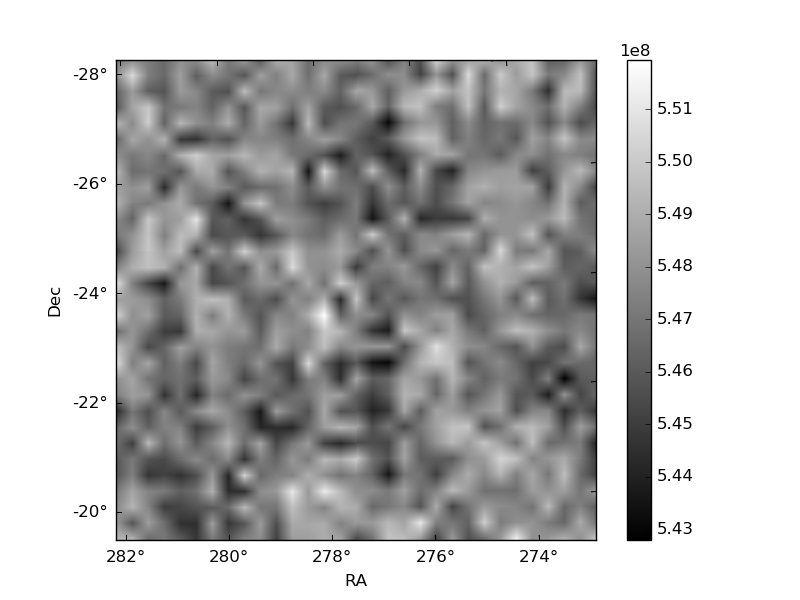
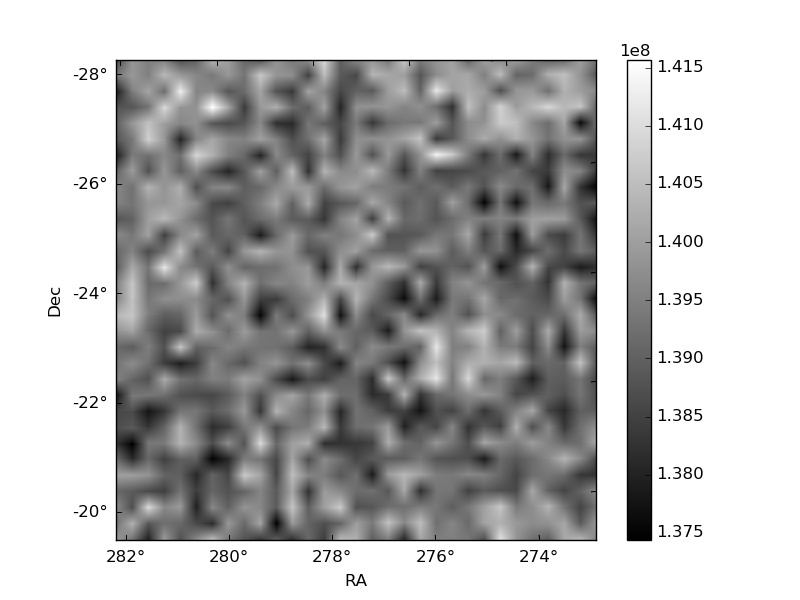
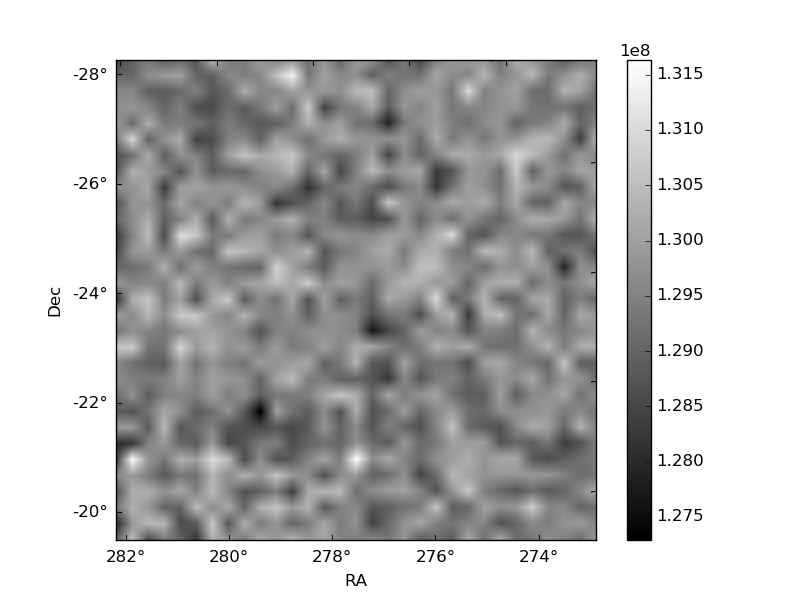
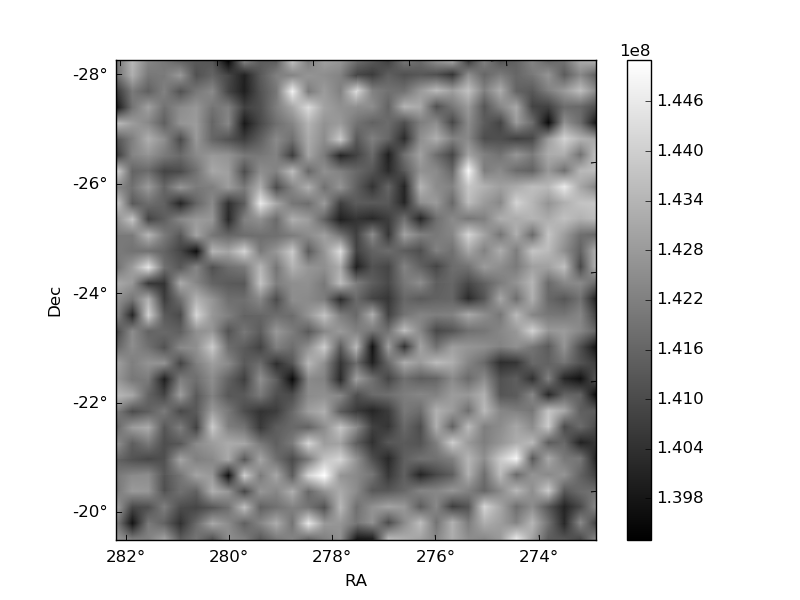
Histogram calculated using DETX and DETY for each event in the final _common_clean file
| Quadrant A | 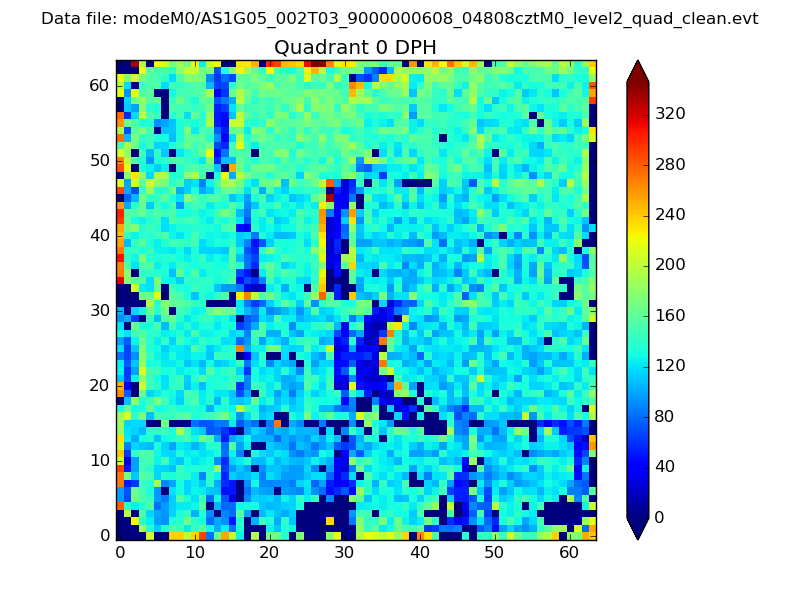 |
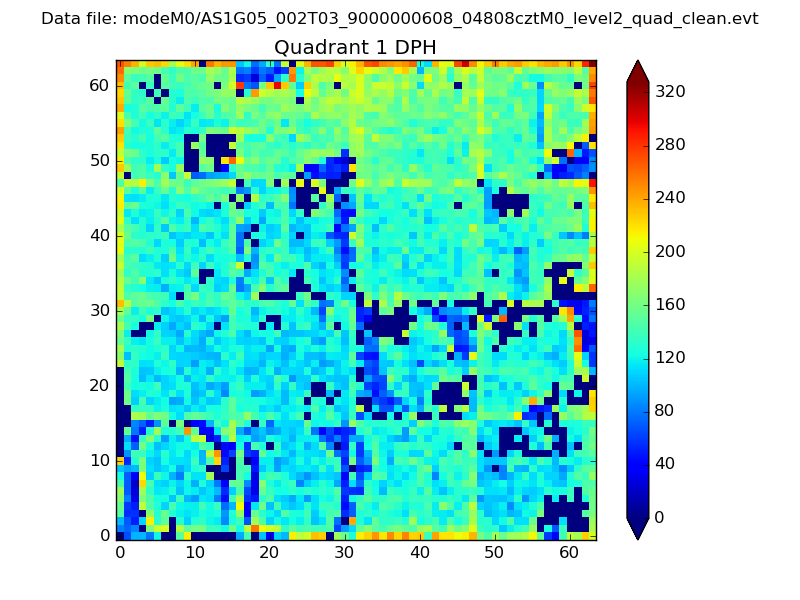 |
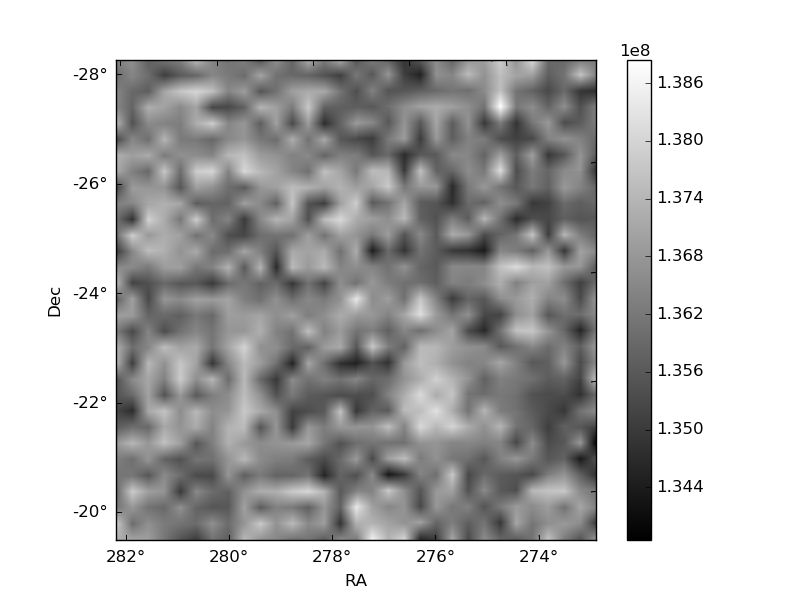
Quadrant B |
|---|---|---|---|
| Quadrant D | 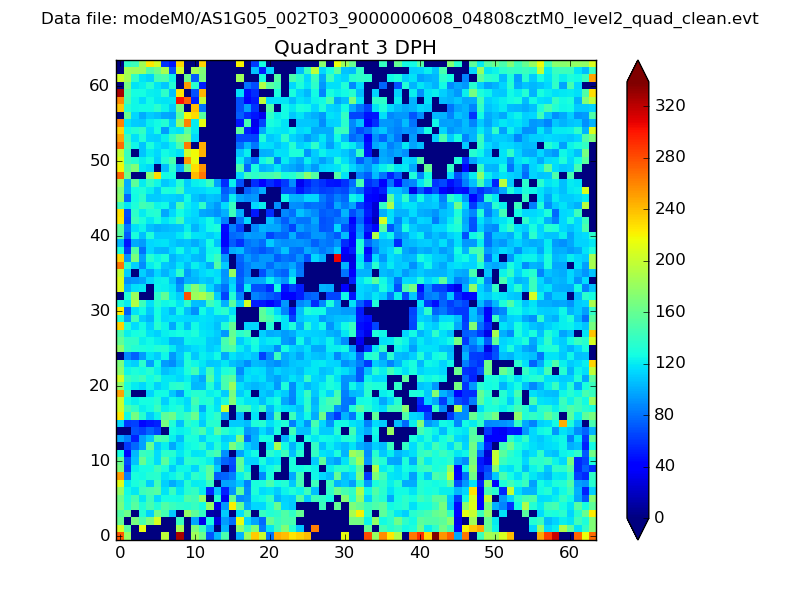 |
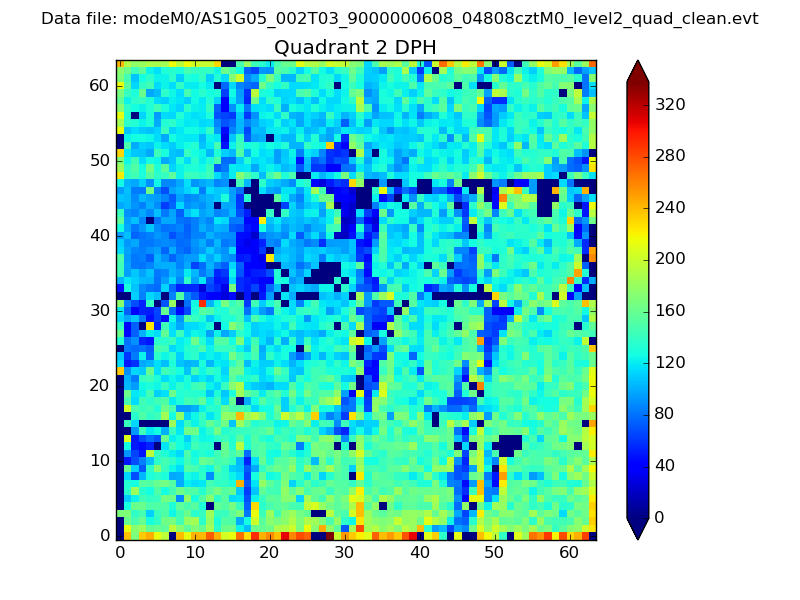 |
Quadrant C |
| Plot type | Count rate plots | Images |
|---|---|---|
| Comparison with Poisson distribution Blue bars denote a histogram of data divided into 1 sec bins. Red curve is a Poisson curve with rate = median count rate of data. |
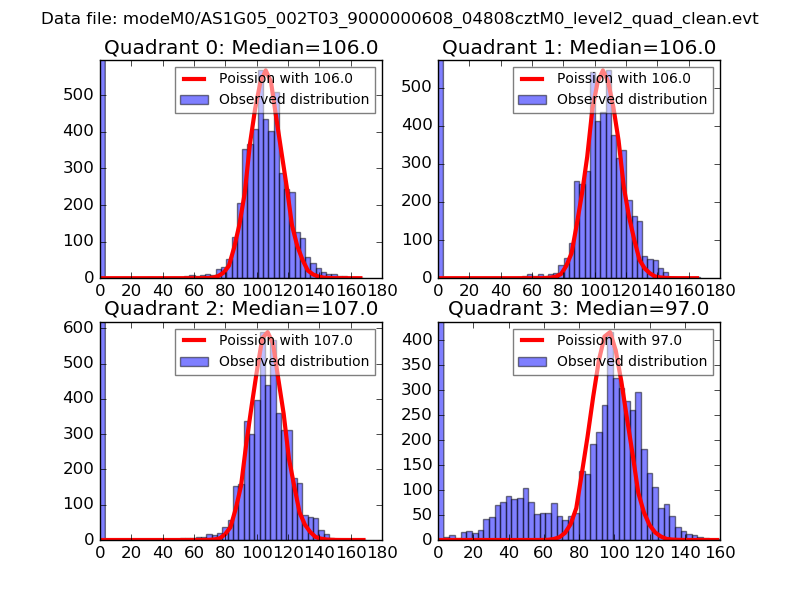 |
 |
| Quadrant-wise count rates Data is divided into 100 sec bins |
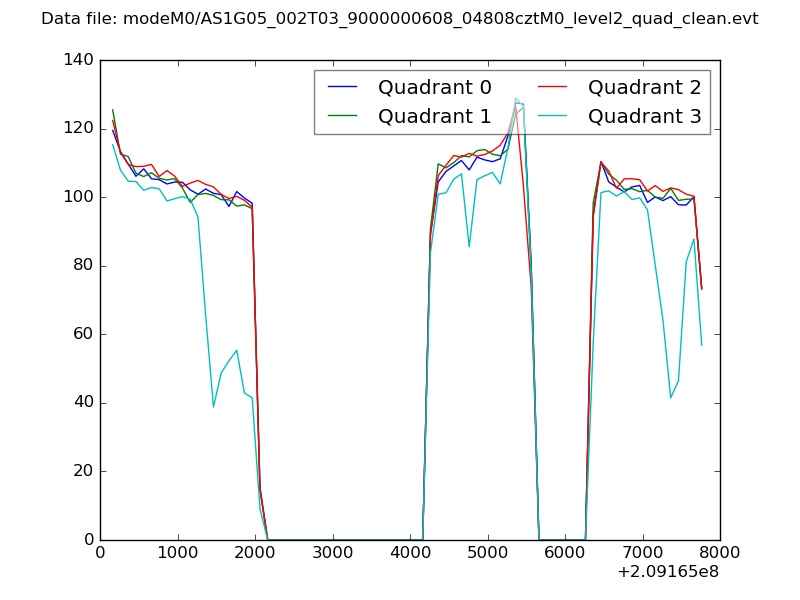 |
|
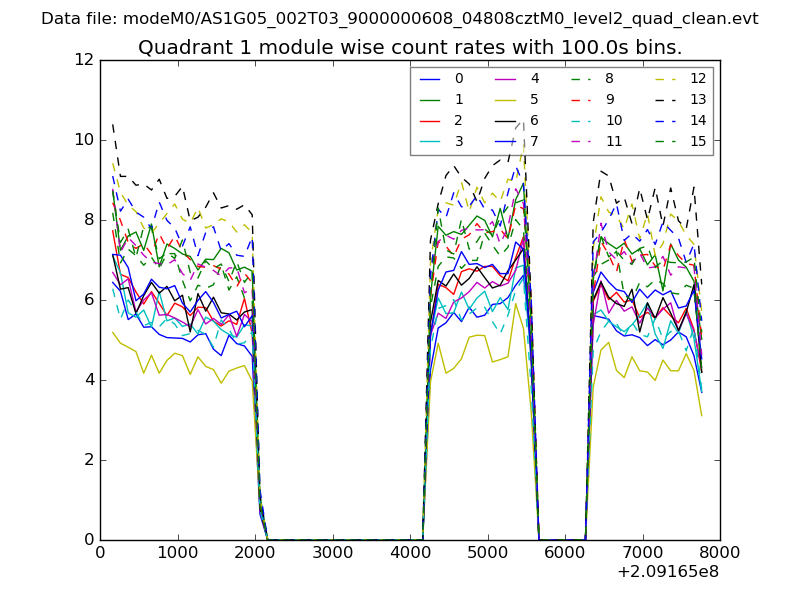
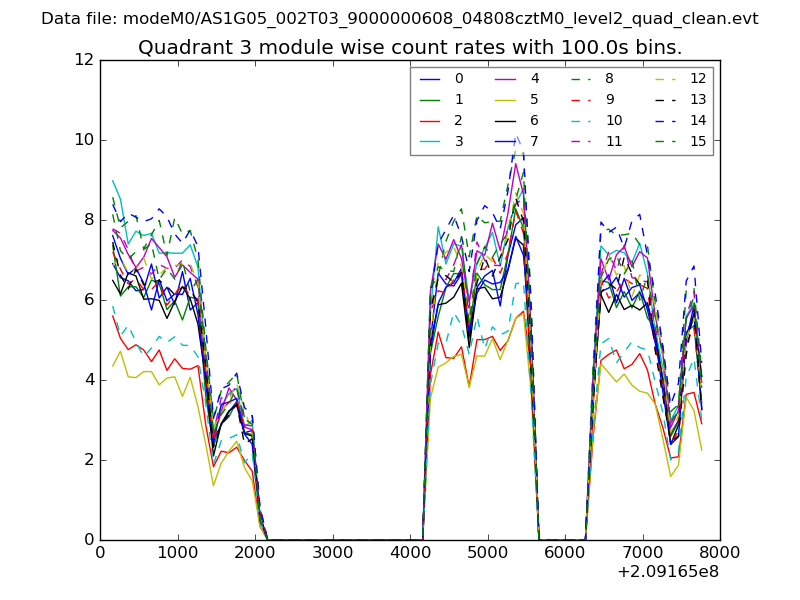
| Module-wise count rates for Quadrant A Data is divided into 100 sec bins |
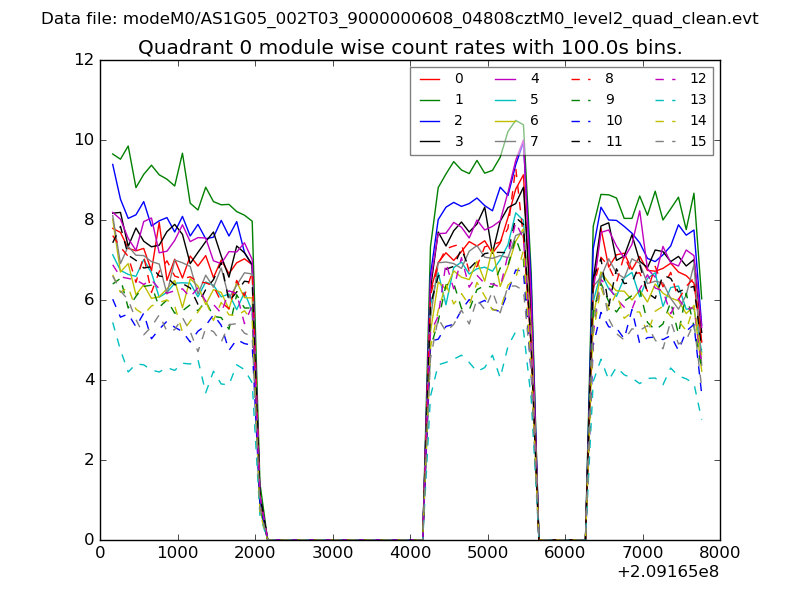 |
 |
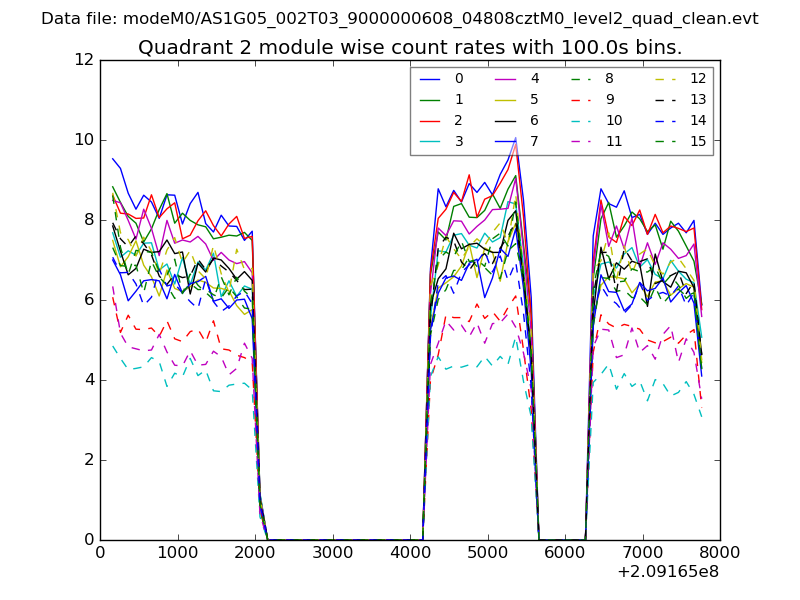
| Module-wise count rates for Quadrant B Data is divided into 100 sec bins |
 |
 |
| Module-wise count rates for Quadrant C Data is divided into 100 sec bins |
 |
 |
| Module-wise count rates for Quadrant D Data is divided into 100 sec bins |
 |
 |
| Parameter | Plot |
|---|---|
| CZT HV Monitor | 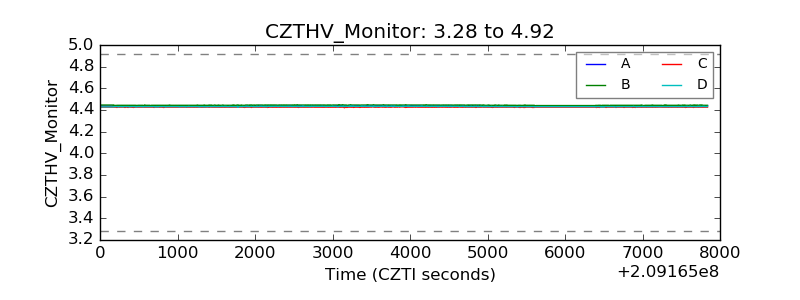 |
| D_VDD | 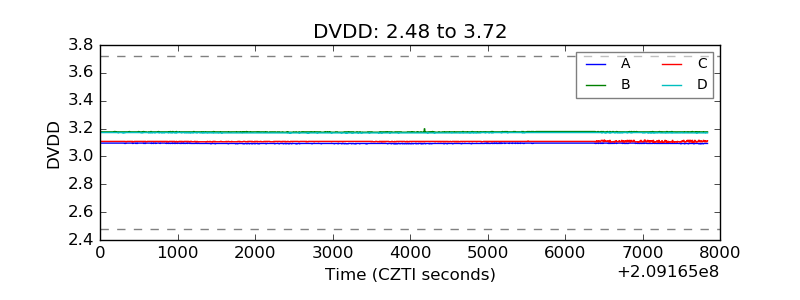 |
| Temperature 1 | 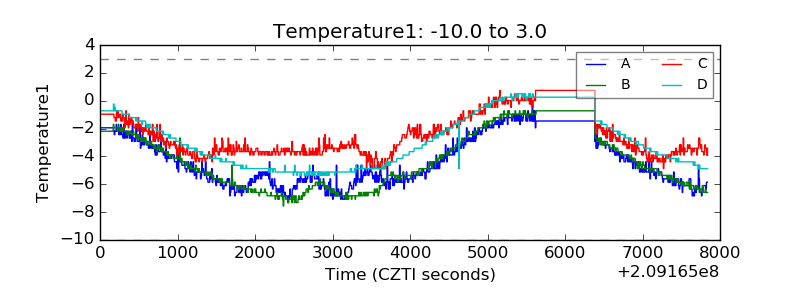 |
| Veto HV Monitor | 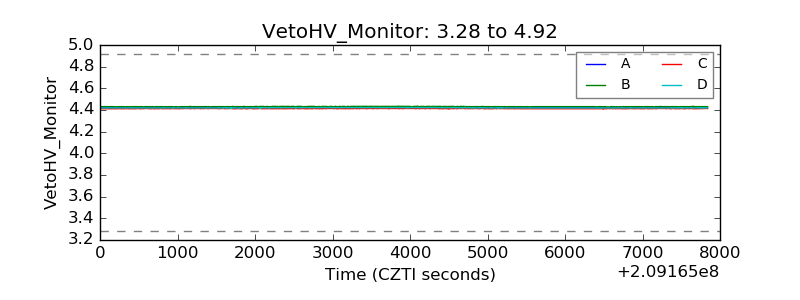 |
| Veto LLD | 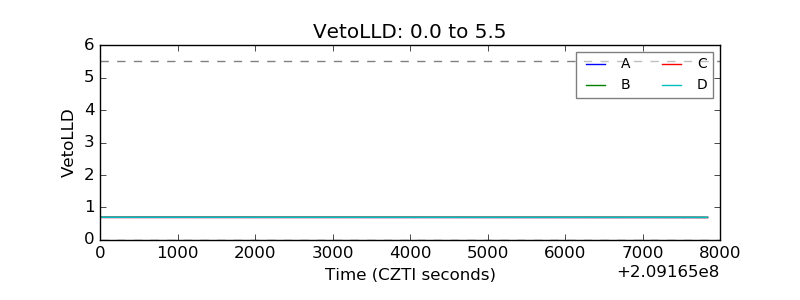 |
| Alpha Counter | 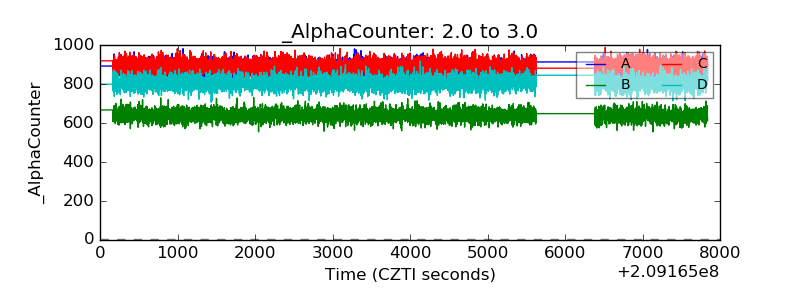 |
| _CPM_Rate | 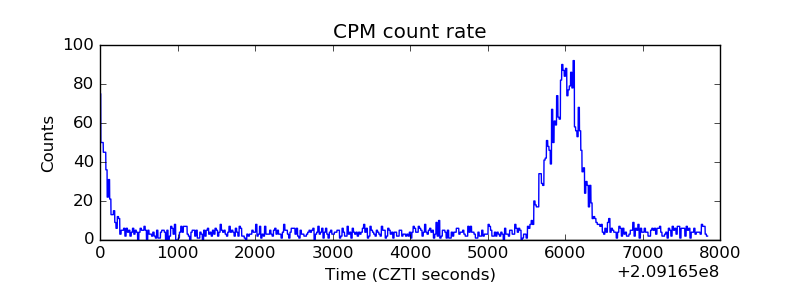 |
| CZT Counter | 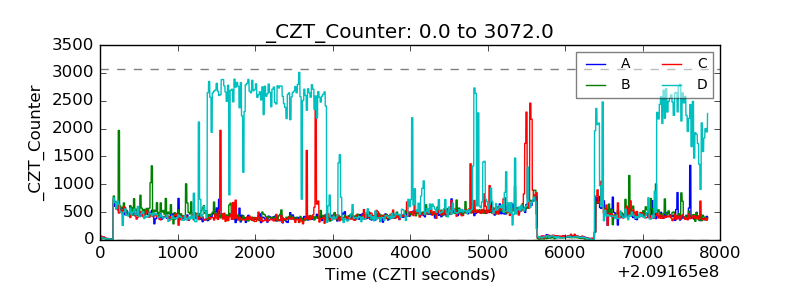 |
| +2.5 Volts monitor |  |
| +5 Volts monitor |  |
| _ROLL_ROT | 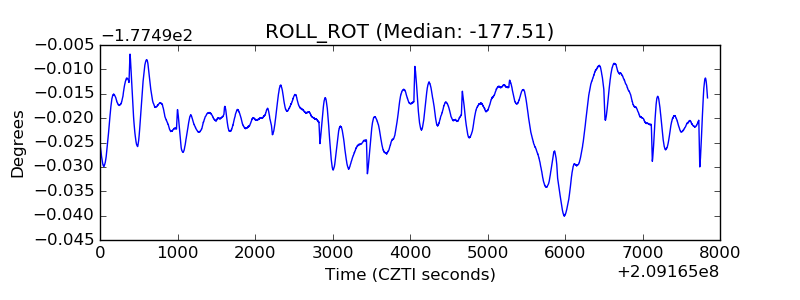 |
| _Roll_DEC | 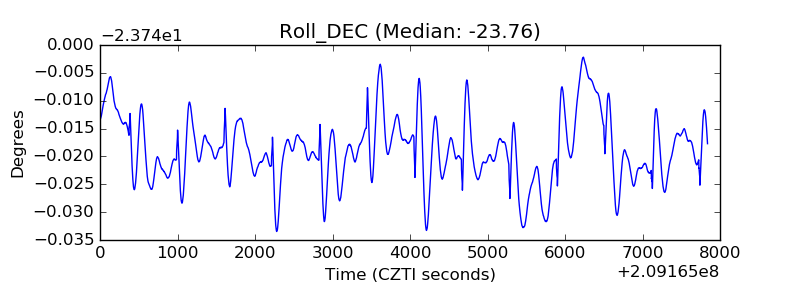 |
| _Roll_RA | 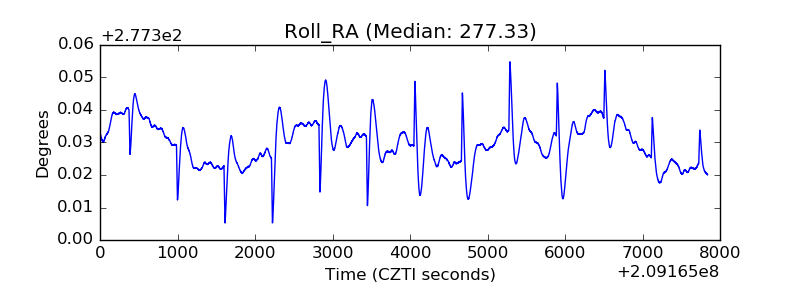 |
| Veto Counter | 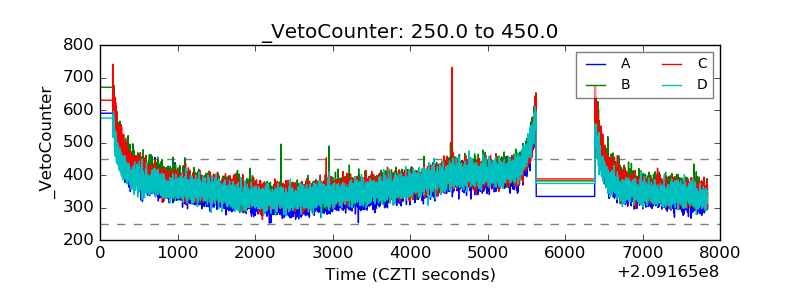 |