| Param | Original file | Final file |
|---|---|---|
| Filename | modeM0/AS1G05_002T03_9000000608_04809cztM0_level2.evt | modeM0/AS1G05_002T03_9000000608_04809cztM0_level2_quad_clean.evt |
| Size (bytes) | 442,344,960 | 50,788,800 |
| Size | 421.9 MB | 48.4 MB |
| Events in quadrant A | 2,323,368 | 302,352 |
| Events in quadrant B | 2,366,231 | 306,316 |
| Events in quadrant C | 2,427,928 | 306,471 |
| Events in quadrant D | 5,931,725 | 264,505 |
| Mode M0 | |||
|---|---|---|---|
| Quadrant | BADHDUFLAG | Total packets | Discarded packets |
| A | 0 | 10582 | 1 |
| B | 0 | 10636 | 1 |
| C | 0 | 10933 | 1 |
| D | 0 | 21202 | 1 |
| Mode SS | |||
|---|---|---|---|
| Quadrant | BADHDUFLAG | Total packets | Discarded packets |
| A | 0 | 104 | 0 |
| B | 0 | 104 | 0 |
| C | 0 | 104 | 0 |
| D | 0 | 104 | 0 |
| Mode M9 | |||
|---|---|---|---|
| Quadrant | BADHDUFLAG | Total packets | Discarded packets |
| A | 0 | 7 | 0 |
| B | 0 | 7 | 0 |
| C | 0 | 7 | 0 |
| D | 0 | 7 | 0 |
| Quadrant | Total seconds | Saturated seconds | Saturation percentage |
|---|---|---|---|
| A | 5102 | 33 | 0.646805% |
| B | 5102 | 29 | 0.568405% |
| C | 5102 | 78 | 1.528812% |
| D | 5102 | 1340 | 26.264210% |
Noise dominated data is calculated using 1-second bins in cleaned event files. If a bin has >2000 counts, and if more than 50% of those come from <1% of pixels, then it is considered to be noise-dominated and hence unusable.
| Quadrant | # 1 sec bins | Bins with >0 counts | Bins with >2000 counts | High rate bins dominated by noise | Noise dominated (total time) | Noise dominated (detector-on time) | Marked lightcurve |
|---|---|---|---|---|---|---|---|
| A | 5857 | 5103 | 10 | 10 | 0.17% | 0.20% | 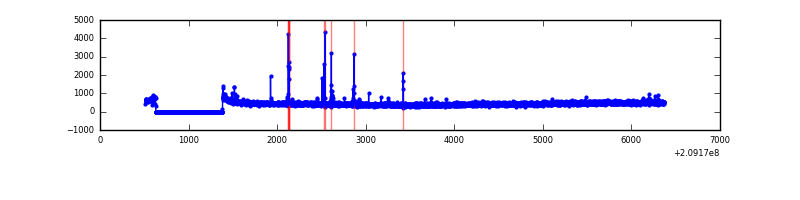 |
| B | 5857 | 5103 | 4 | 4 | 0.07% | 0.08% | 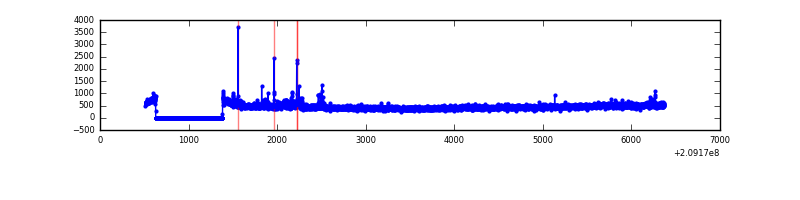 |
| C | 5857 | 5103 | 43 | 43 | 0.73% | 0.84% | 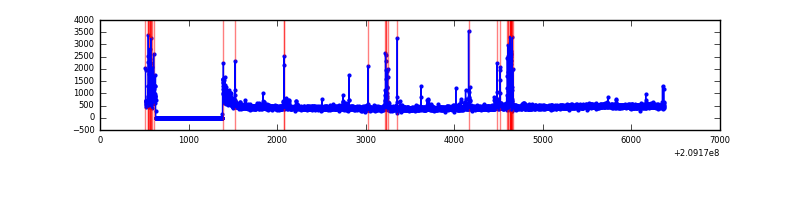 |
| D | 5857 | 5103 | 1344 | 1344 | 22.95% | 26.34% | 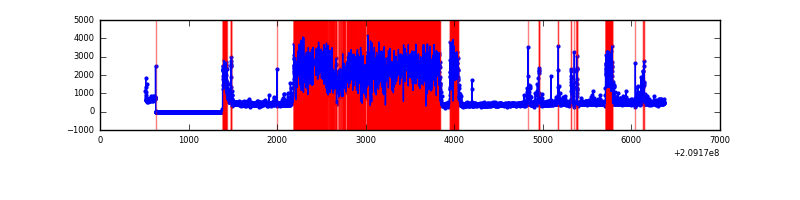 |
Top three noisy pixels from each quadrant. If the there are fewer than three noisy pixels in the level2.evt file, extra rows are filled as -1
| Pixel properties | Quadrant properties | ||||||
|---|---|---|---|---|---|---|---|
| Quadrant | DetID | PixID | Counts | Sigma | Mean | Median | Sigma |
| A | 13 | 251 | 67671 | 559.15 | 575 | 561 | 120.0 |
| A | 13 | 6 | 16198 | 130.29 | 575 | 561 | 120.0 |
| A | 0 | 50 | 12618 | 100.46 | 575 | 561 | 120.0 |
| B | 14 | 167 | 19844 | 168.18 | 583 | 569 | 114.6 |
| B | 10 | 246 | 18477 | 156.25 | 583 | 569 | 114.6 |
| B | 15 | 54 | 13728 | 114.81 | 583 | 569 | 114.6 |
| C | 9 | 247 | 226718 | 1731.44 | 555 | 559 | 130.6 |
| C | 8 | 128 | 14940 | 110.1 | 555 | 559 | 130.6 |
| C | 8 | 112 | 6768 | 47.53 | 555 | 559 | 130.6 |
| D | 13 | 235 | 3466363 | 27989.44 | 505 | 489 | 123.8 |
| D | 12 | 79 | 262214 | 2113.62 | 505 | 489 | 123.8 |
| D | 2 | 136 | 110407 | 887.67 | 505 | 489 | 123.8 |
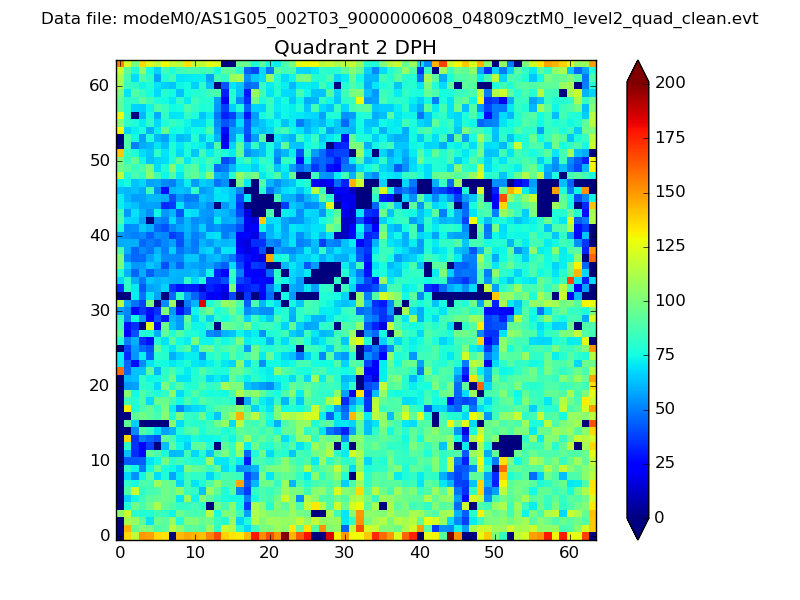
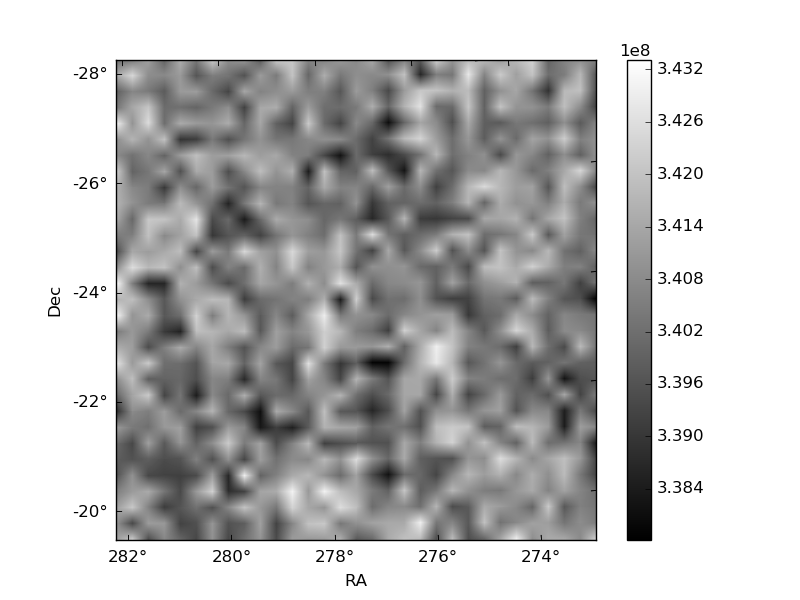
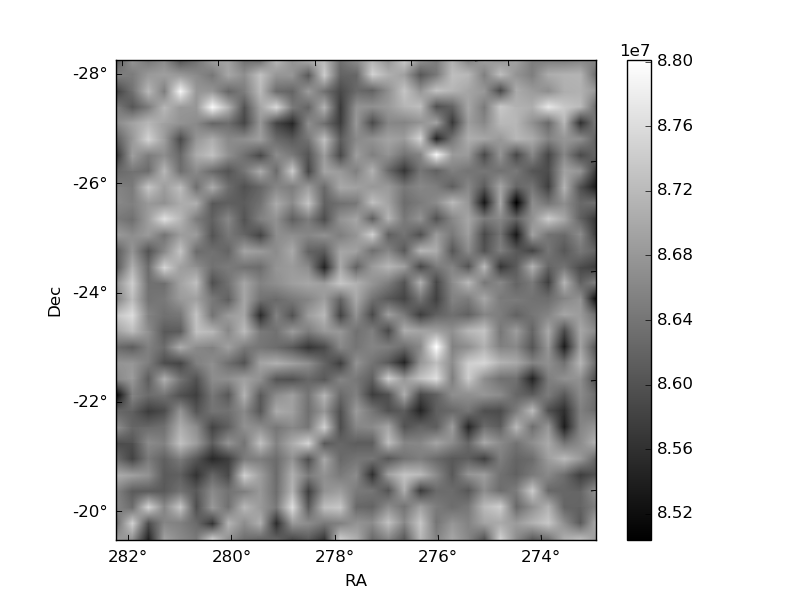
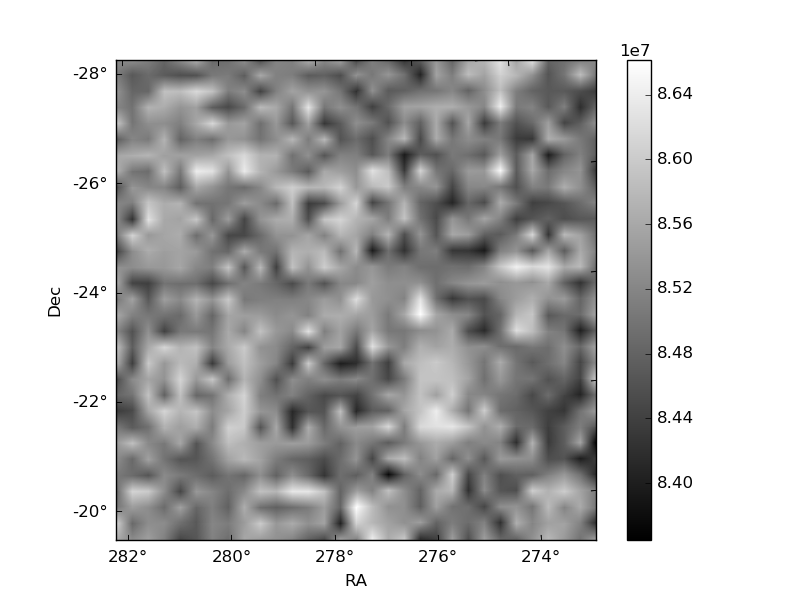
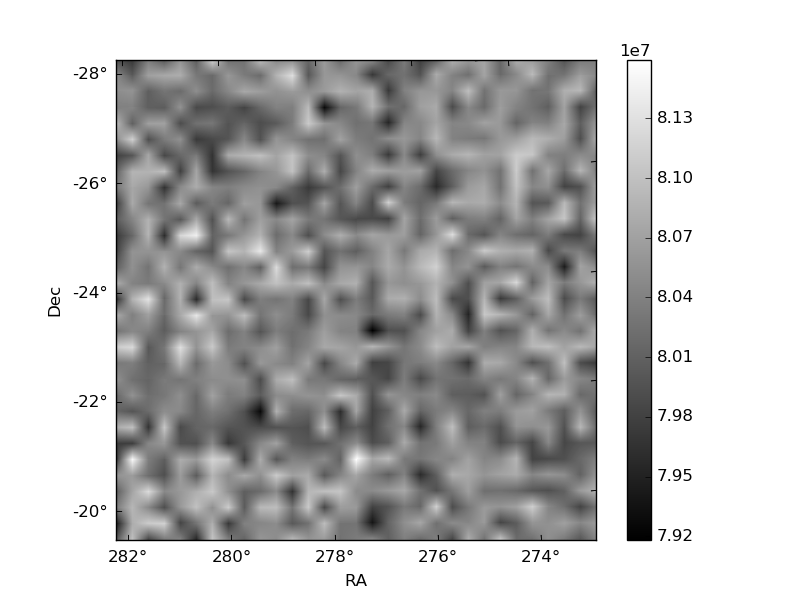
Histogram calculated using DETX and DETY for each event in the final _common_clean file
| Quadrant A | 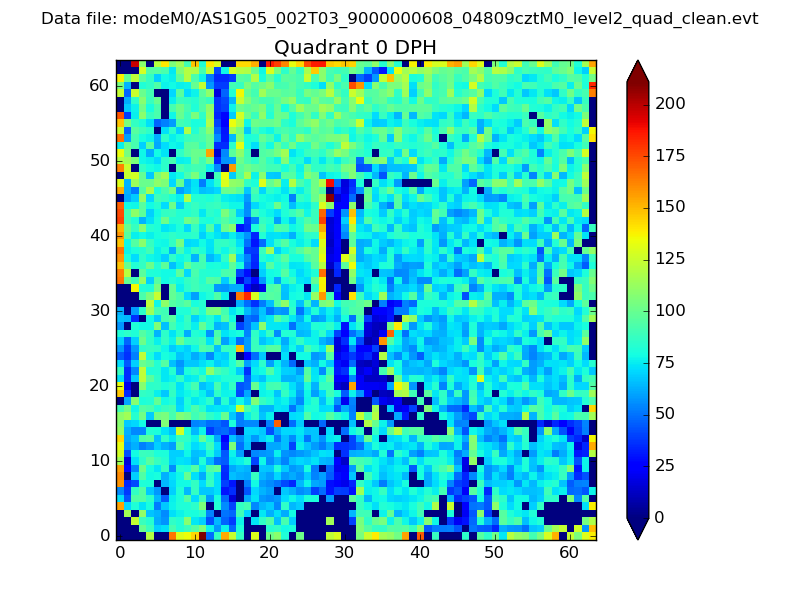 |
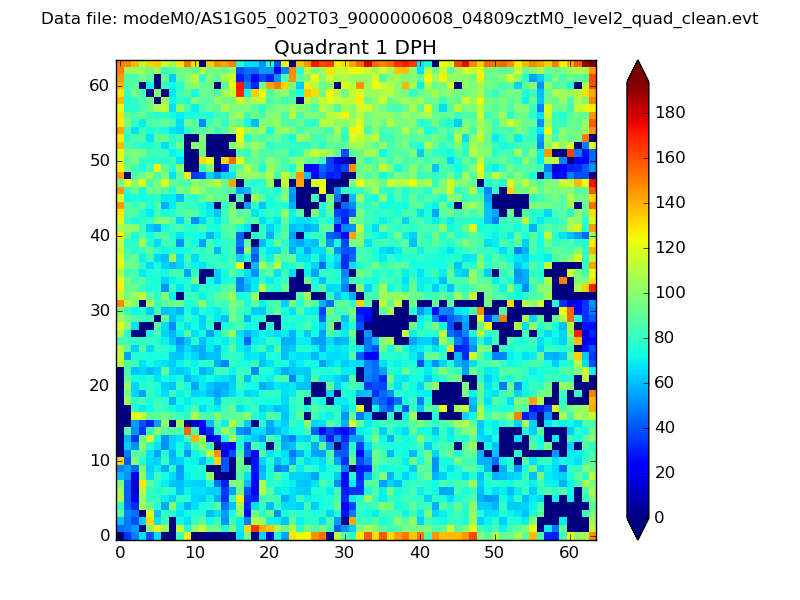 |
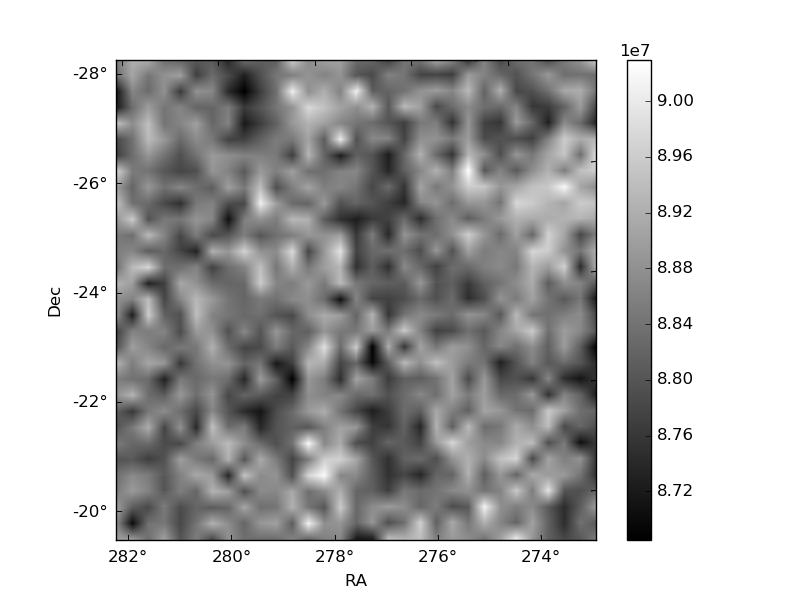
Quadrant B |
|---|---|---|---|
| Quadrant D | 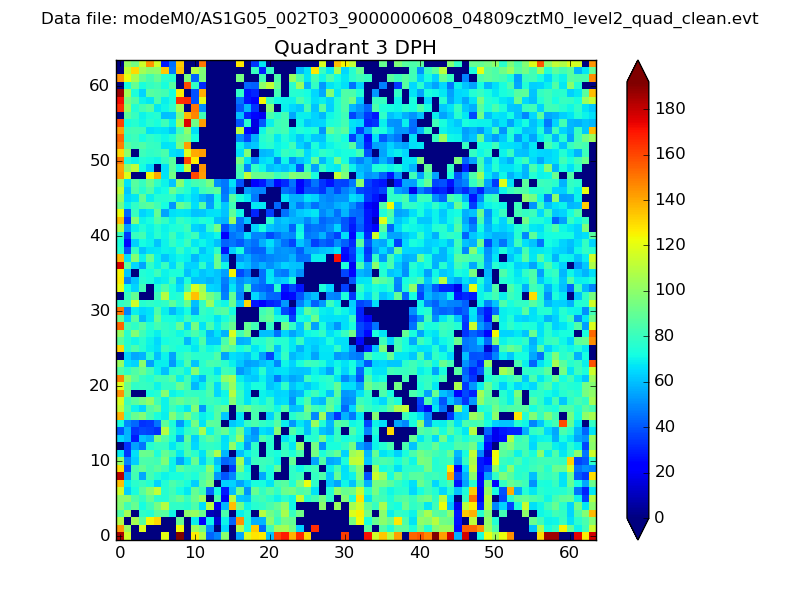 |
 |
Quadrant C |
| Plot type | Count rate plots | Images |
|---|---|---|
| Comparison with Poisson distribution Blue bars denote a histogram of data divided into 1 sec bins. Red curve is a Poisson curve with rate = median count rate of data. |
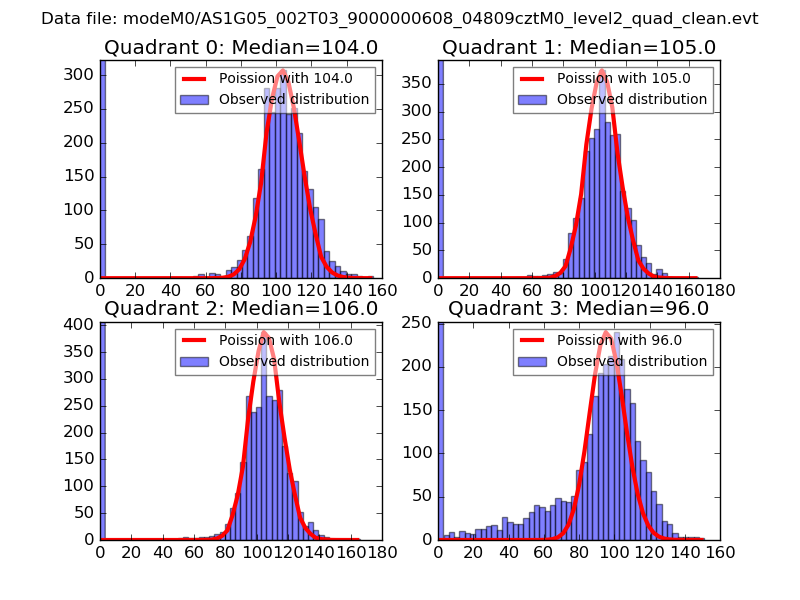 |
 |
| Quadrant-wise count rates Data is divided into 100 sec bins |
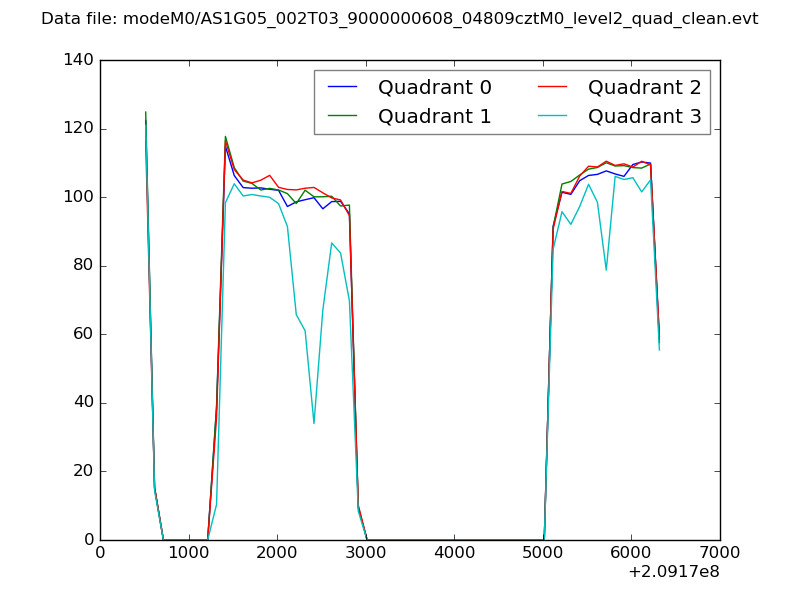 |
|
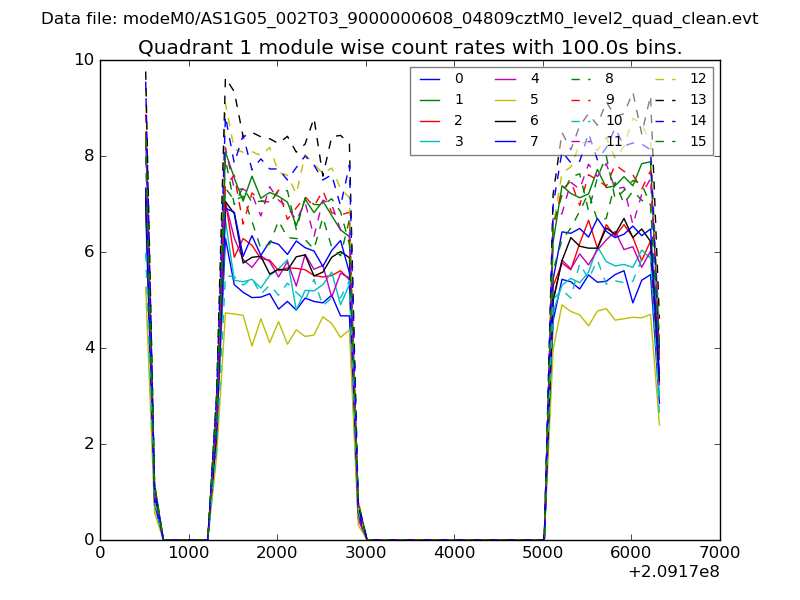
| Module-wise count rates for Quadrant A Data is divided into 100 sec bins |
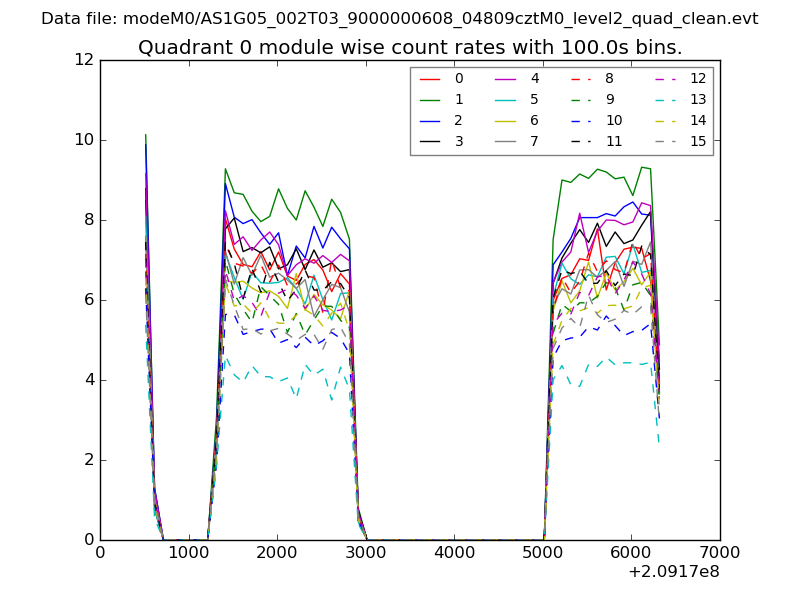 |
 |
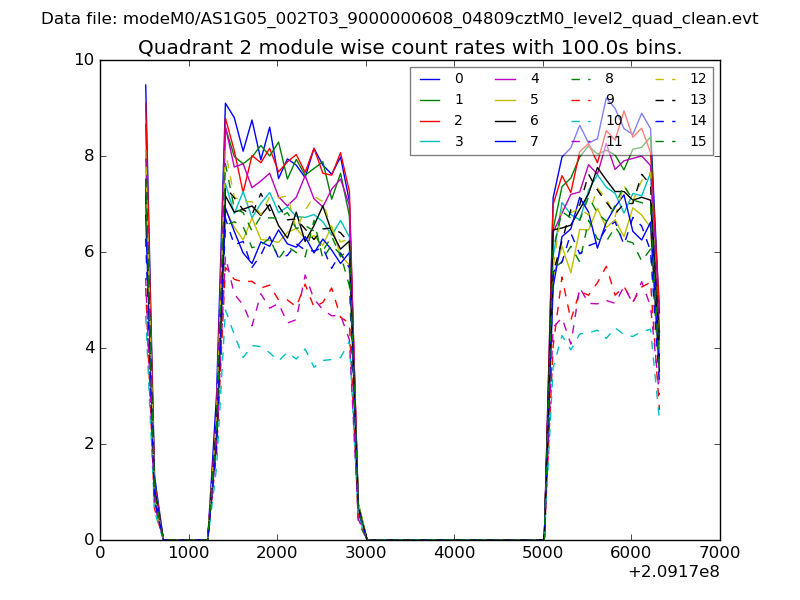
| Module-wise count rates for Quadrant B Data is divided into 100 sec bins |
 |
 |
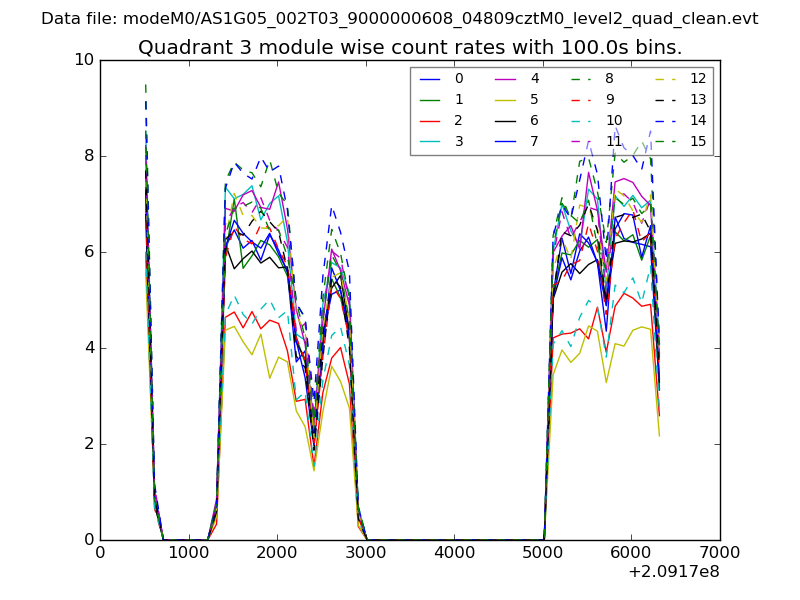
| Module-wise count rates for Quadrant C Data is divided into 100 sec bins |
 |
 |
| Module-wise count rates for Quadrant D Data is divided into 100 sec bins |
 |
 |
| Parameter | Plot |
|---|---|
| CZT HV Monitor | 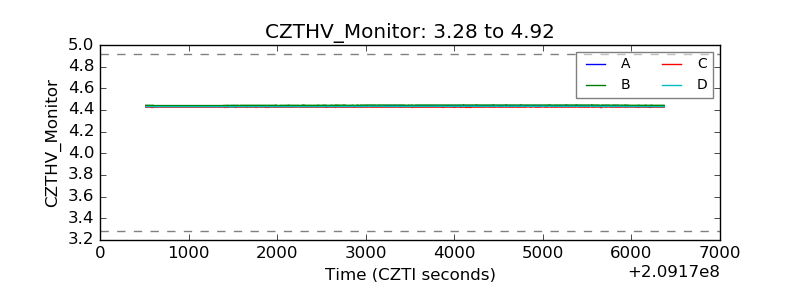 |
| D_VDD | 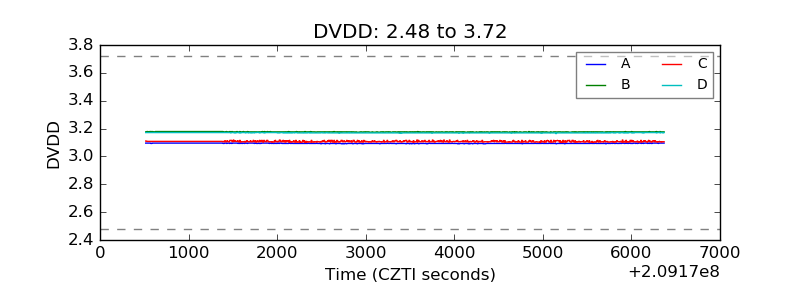 |
| Temperature 1 | 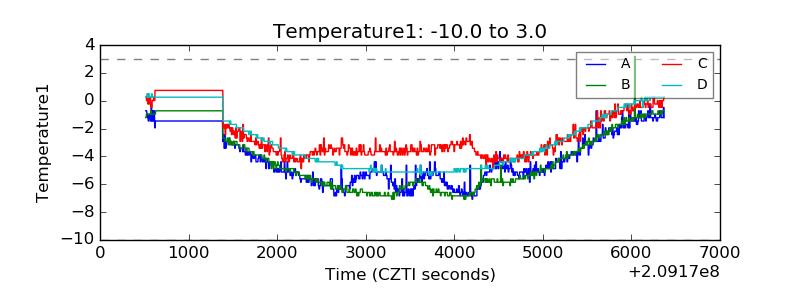 |
| Veto HV Monitor | 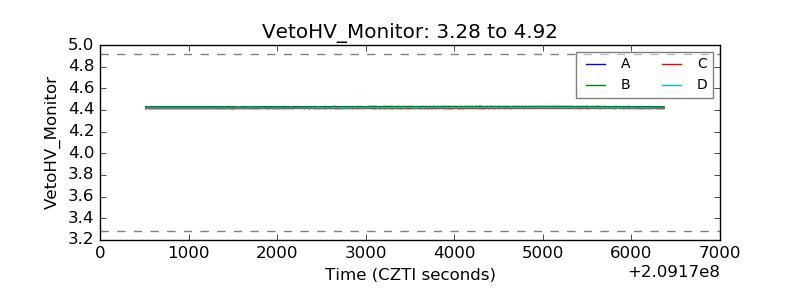 |
| Veto LLD | 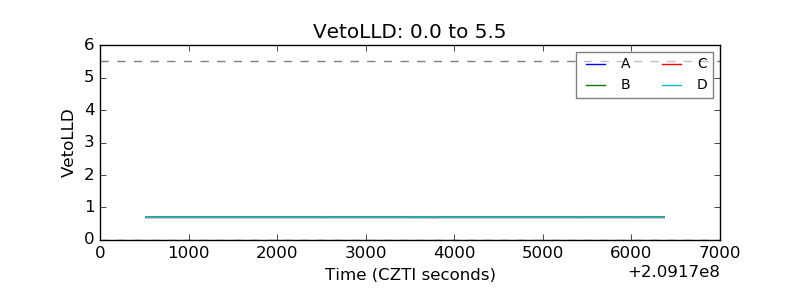 |
| Alpha Counter | 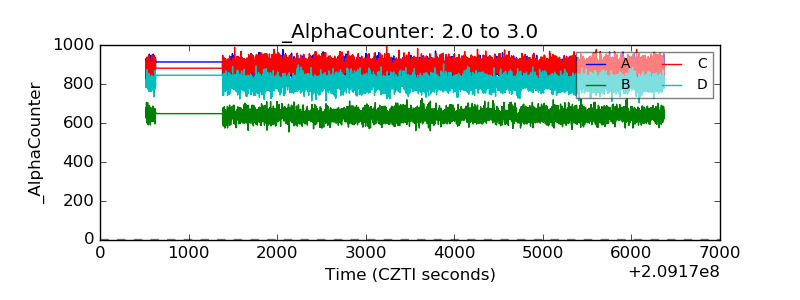 |
| _CPM_Rate | 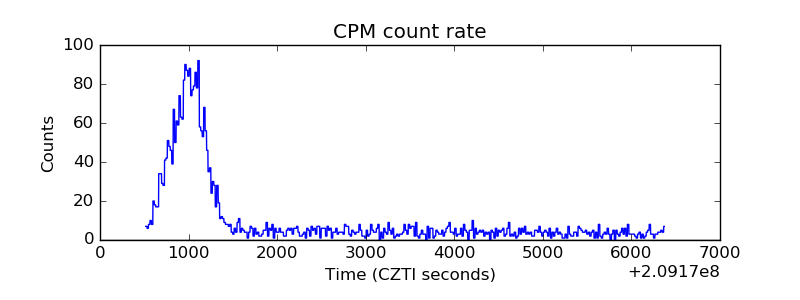 |
| CZT Counter | 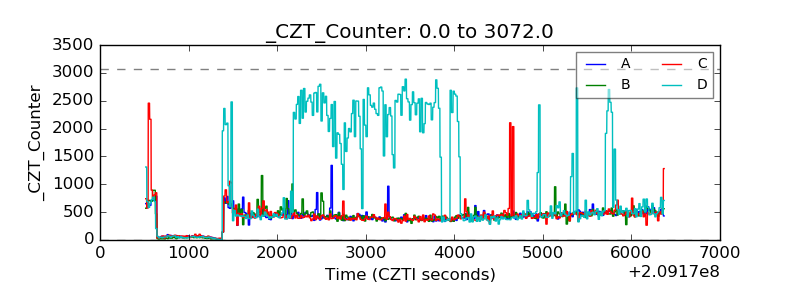 |
| +2.5 Volts monitor |  |
| +5 Volts monitor |  |
| _ROLL_ROT | 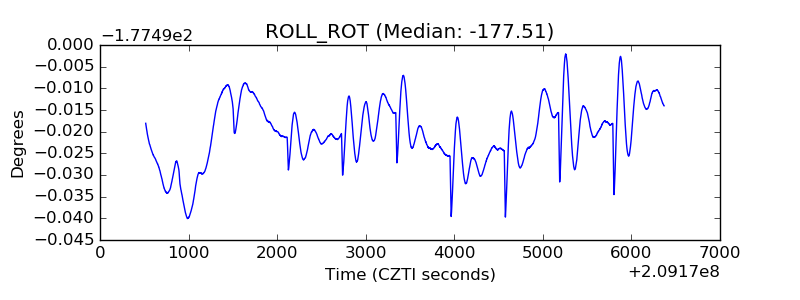 |
| _Roll_DEC |  |
| _Roll_RA | 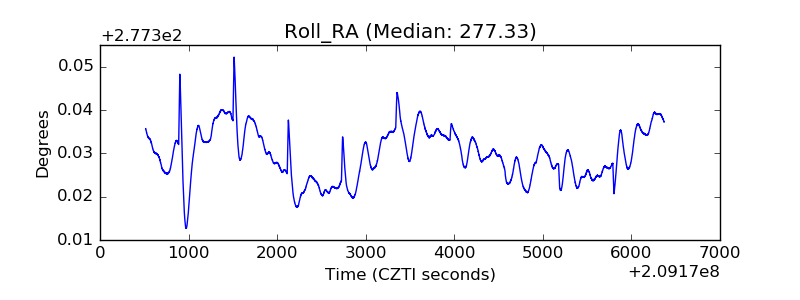 |
| Veto Counter | 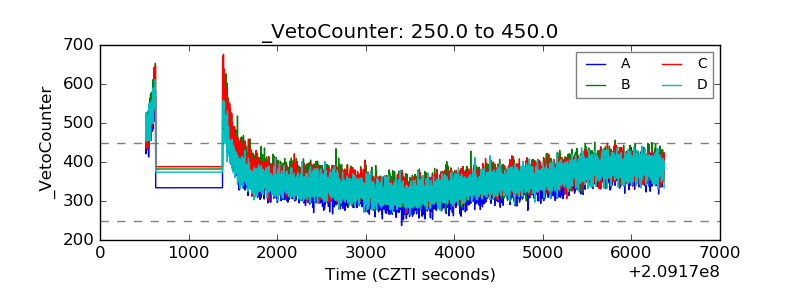 |