| Param | Original file | Final file |
|---|---|---|
| Filename | modeM0/AS1G05_245T01_9000000606cztM0_level2.fits | modeM0/AS1G05_245T01_9000000606cztM0_level2_quad_clean.evt |
| Size (bytes) | 96,966,720 | 77,760,000 |
| Size | 92.5 MB | 74.2 MB |
| Events in quadrant A | 578,364 | 424,802 |
| Events in quadrant B | 555,108 | 419,004 |
| Events in quadrant C | 576,018 | 407,064 |
| Events in quadrant D | 481,628 | 357,683 |
| Mode SS | |||
|---|---|---|---|
| Quadrant | BADHDUFLAG | Total packets | Discarded packets |
| A | 0 | 218 | 0 |
| B | 0 | 218 | 0 |
| C | 0 | 218 | 0 |
| D | 0 | 218 | 0 |
| Mode M9 | |||
|---|---|---|---|
| Quadrant | BADHDUFLAG | Total packets | Discarded packets |
| A | 0 | 14 | 0 |
| B | 0 | 14 | 0 |
| C | 0 | 14 | 0 |
| D | 0 | 14 | 0 |
| Mode M0 | |||
|---|---|---|---|
| Quadrant | BADHDUFLAG | Total packets | Discarded packets |
| A | 0 | 22333 | 0 |
| B | 0 | 24568 | 0 |
| C | 0 | 22456 | 0 |
| D | 0 | 25828 | 0 |
| Quadrant | Total seconds | Saturated seconds | Saturation percentage |
|---|---|---|---|
| A | 10769 | 193 | 1.792181% |
| B | 10769 | 264 | 2.451481% |
| C | 10767 | 116 | 1.077366% |
| D | 10768 | 465 | 4.318351% |
Noise dominated data is calculated using 1-second bins in cleaned event files. If a bin has >2000 counts, and if more than 50% of those come from <1% of pixels, then it is considered to be noise-dominated and hence unusable.
| Quadrant | # 1 sec bins | Bins with >0 counts | Bins with >2000 counts | High rate bins dominated by noise | Noise dominated (total time) | Noise dominated (detector-on time) | Marked lightcurve |
|---|---|---|---|---|---|---|---|
| A | 12140 | 10758 | 0 | 0 | 0.00% | 0.00% |  |
| B | 12140 | 10756 | 0 | 0 | 0.00% | 0.00% |  |
| C | 12140 | 10768 | 0 | 0 | 0.00% | 0.00% |  |
| D | 12140 | 10722 | 0 | 0 | 0.00% | 0.00% |  |
Top three noisy pixels from each quadrant. If the there are fewer than three noisy pixels in the level2.evt file, extra rows are filled as -1
| Pixel properties | Quadrant properties | ||||||
|---|---|---|---|---|---|---|---|
| Quadrant | DetID | PixID | Counts | Sigma | Mean | Median | Sigma |
| A | 0 | 29 | 602 | 11.15 | 150 | 140 | 41.4 |
| A | 14 | 188 | 561 | 10.16 | 150 | 140 | 41.4 |
| A | 7 | 110 | 494 | 8.55 | 150 | 140 | 41.4 |
| B | 2 | 9 | 521 | 11.75 | 146 | 139 | 32.5 |
| B | 5 | 225 | 412 | 8.39 | 146 | 139 | 32.5 |
| B | 14 | 254 | 401 | 8.06 | 146 | 139 | 32.5 |
| C | 1 | 80 | 449 | 7.2 | 151 | 140 | 42.9 |
| C | 1 | 81 | 438 | 6.94 | 151 | 140 | 42.9 |
| C | 9 | 242 | 418 | 6.48 | 151 | 140 | 42.9 |
| D | 4 | 160 | 391 | 6.89 | 137 | 125 | 38.6 |
| D | 11 | 82 | 386 | 6.76 | 137 | 125 | 38.6 |
| D | 6 | 44 | 376 | 6.5 | 137 | 125 | 38.6 |
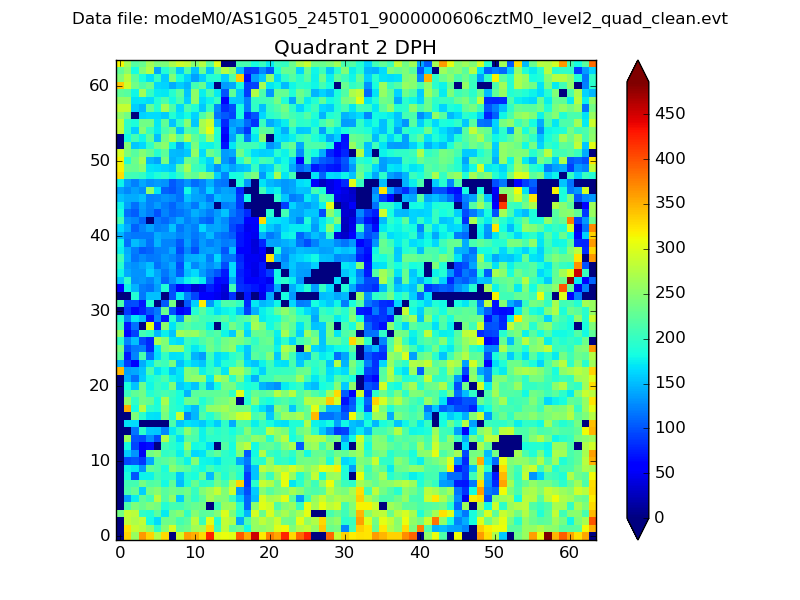
Histogram calculated using DETX and DETY for each event in the final _common_clean file
| Quadrant A |  |
 |
Quadrant B |
|---|---|---|---|
| Quadrant D |  |
 |
Quadrant C |
| Plot type | Count rate plots | Images |
|---|---|---|
| Comparison with Poisson distribution Blue bars denote a histogram of data divided into 1 sec bins. Red curve is a Poisson curve with rate = median count rate of data. |
 |
 |
| Quadrant-wise count rates Data is divided into 100 sec bins |
 |
|
| Module-wise count rates for Quadrant A Data is divided into 100 sec bins |
 |
 |
| Module-wise count rates for Quadrant B Data is divided into 100 sec bins |
 |
 |
| Module-wise count rates for Quadrant C Data is divided into 100 sec bins |
 |
 |
| Module-wise count rates for Quadrant D Data is divided into 100 sec bins |
 |
 |
| Parameter | Plot |
|---|---|
| CZT HV Monitor |  |
| D_VDD |  |
| Temperature 1 |  |
| Veto HV Monitor |  |
| Veto LLD |  |
| Alpha Counter |  |
| _CPM_Rate |  |
| CZT Counter |  |
| +2.5 Volts monitor |  |
| +5 Volts monitor |  |
| _ROLL_ROT |  |
| _Roll_DEC |  |
| _Roll_RA |  |
| Veto Counter |  |