| Param | Original file | Final file |
|---|---|---|
| Filename | modeM0/AS1G05_245T01_9000000606_04799cztM0_level2.evt | modeM0/AS1G05_245T01_9000000606_04799cztM0_level2_quad_clean.evt |
| Size (bytes) | 766,929,600 | 128,329,920 |
| Size | 731.4 MB | 122.4 MB |
| Events in quadrant A | 5,191,833 | 804,438 |
| Events in quadrant B | 5,991,691 | 799,501 |
| Events in quadrant C | 5,088,046 | 796,160 |
| Events in quadrant D | 6,225,608 | 740,809 |
| Mode SS | |||
|---|---|---|---|
| Quadrant | BADHDUFLAG | Total packets | Discarded packets |
| A | 0 | 218 | 0 |
| B | 0 | 218 | 0 |
| C | 0 | 218 | 0 |
| D | 0 | 218 | 0 |
| Mode M9 | |||
|---|---|---|---|
| Quadrant | BADHDUFLAG | Total packets | Discarded packets |
| A | 0 | 14 | 0 |
| B | 0 | 14 | 0 |
| C | 0 | 14 | 0 |
| D | 0 | 14 | 0 |
| Mode M0 | |||
|---|---|---|---|
| Quadrant | BADHDUFLAG | Total packets | Discarded packets |
| A | 0 | 22338 | 5 |
| B | 0 | 24572 | 4 |
| C | 0 | 22464 | 8 |
| D | 0 | 25833 | 5 |
| Quadrant | Total seconds | Saturated seconds | Saturation percentage |
|---|---|---|---|
| A | 10769 | 193 | 1.792181% |
| B | 10769 | 264 | 2.451481% |
| C | 10767 | 116 | 1.077366% |
| D | 10768 | 465 | 4.318351% |
Noise dominated data is calculated using 1-second bins in cleaned event files. If a bin has >2000 counts, and if more than 50% of those come from <1% of pixels, then it is considered to be noise-dominated and hence unusable.
| Quadrant | # 1 sec bins | Bins with >0 counts | Bins with >2000 counts | High rate bins dominated by noise | Noise dominated (total time) | Noise dominated (detector-on time) | Marked lightcurve |
|---|---|---|---|---|---|---|---|
| A | 12140 | 10772 | 33 | 33 | 0.27% | 0.31% | 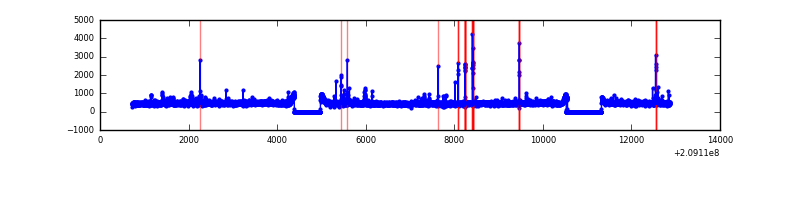 |
| B | 12140 | 10771 | 95 | 95 | 0.78% | 0.88% | 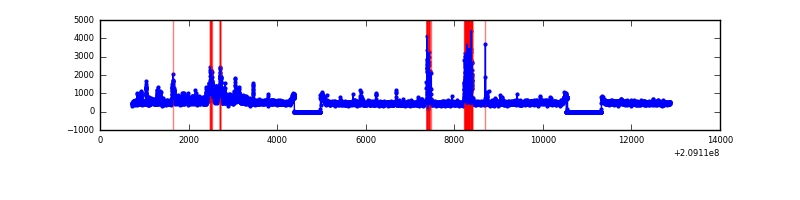 |
| C | 12140 | 10772 | 7 | 7 | 0.06% | 0.06% | 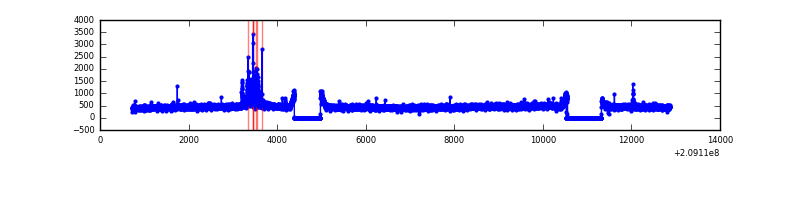 |
| D | 12140 | 10772 | 220 | 220 | 1.81% | 2.04% | 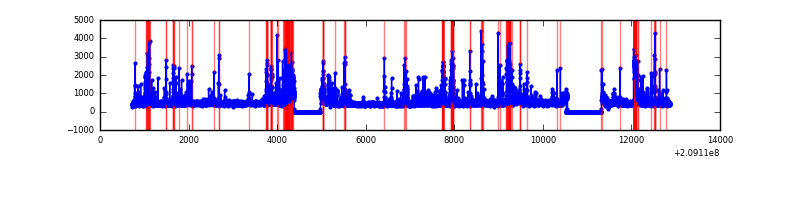 |
Top three noisy pixels from each quadrant. If the there are fewer than three noisy pixels in the level2.evt file, extra rows are filled as -1
| Pixel properties | Quadrant properties | ||||||
|---|---|---|---|---|---|---|---|
| Quadrant | DetID | PixID | Counts | Sigma | Mean | Median | Sigma |
| A | 13 | 251 | 103893 | 389.05 | 1289 | 1261 | 263.8 |
| A | 14 | 238 | 64314 | 239.02 | 1289 | 1261 | 263.8 |
| A | 0 | 50 | 22443 | 80.3 | 1289 | 1261 | 263.8 |
| B | 15 | 204 | 339276 | 1365.84 | 1298 | 1271 | 247.5 |
| B | 10 | 16 | 299118 | 1203.57 | 1298 | 1271 | 247.5 |
| B | 14 | 167 | 201625 | 809.61 | 1298 | 1271 | 247.5 |
| C | 12 | 4 | 177328 | 605.14 | 1256 | 1265 | 290.9 |
| C | 1 | 16 | 12570 | 38.86 | 1256 | 1265 | 290.9 |
| C | 13 | 61 | 10207 | 30.73 | 1256 | 1265 | 290.9 |
| D | 13 | 235 | 719178 | 2444.92 | 1224 | 1190 | 293.7 |
| D | 2 | 136 | 277553 | 941.08 | 1224 | 1190 | 293.7 |
| D | 13 | 239 | 220157 | 745.63 | 1224 | 1190 | 293.7 |
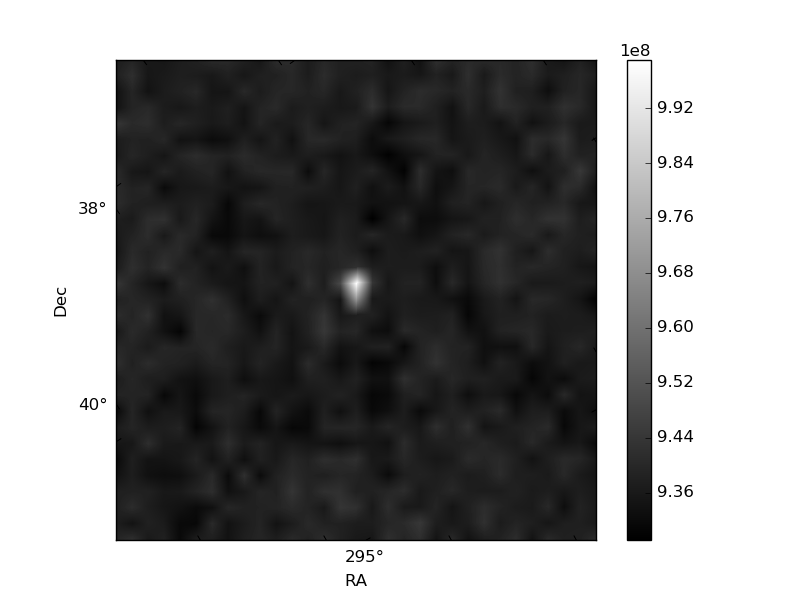
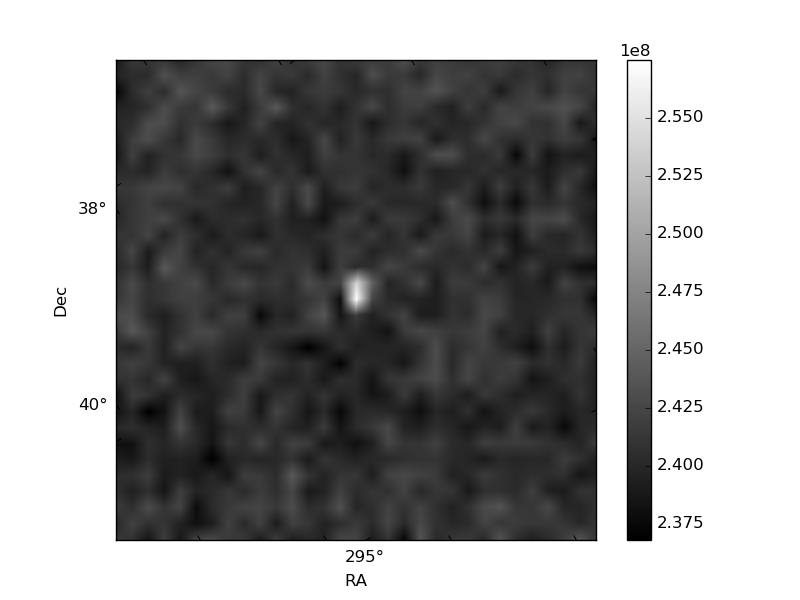
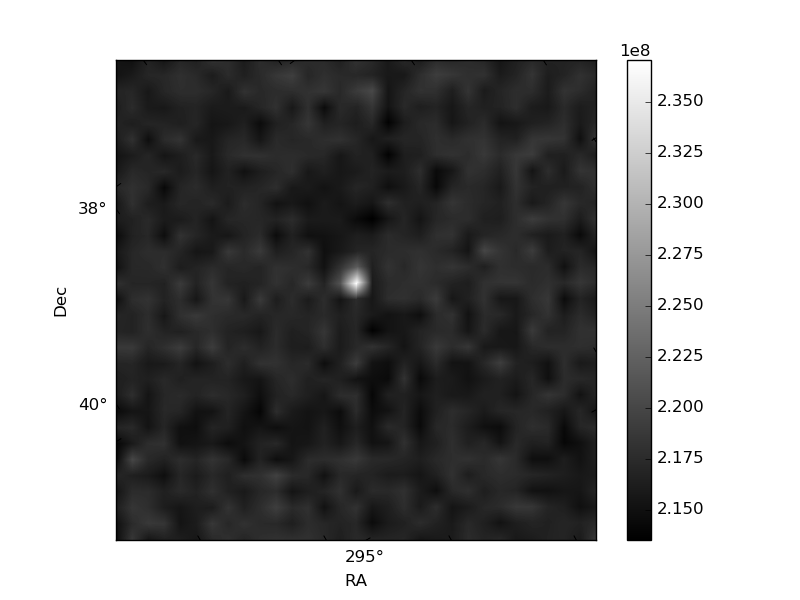
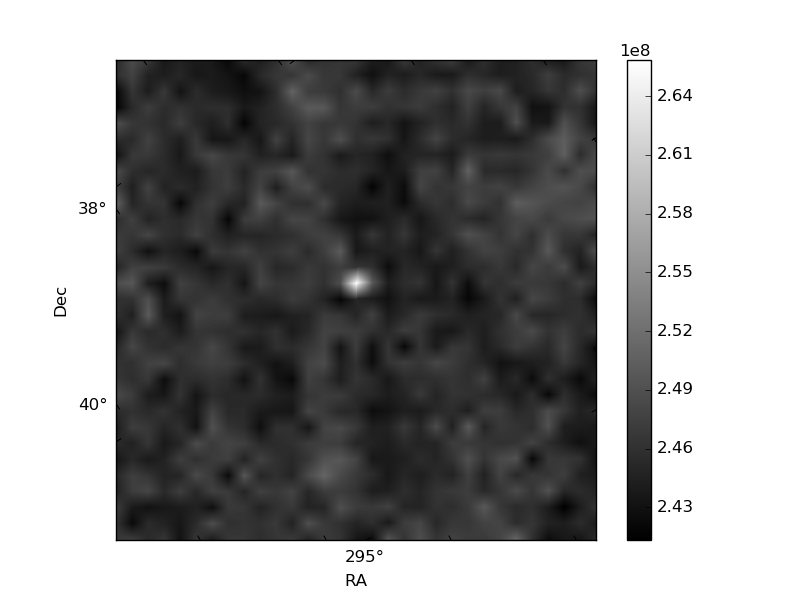
Histogram calculated using DETX and DETY for each event in the final _common_clean file
| Quadrant A | 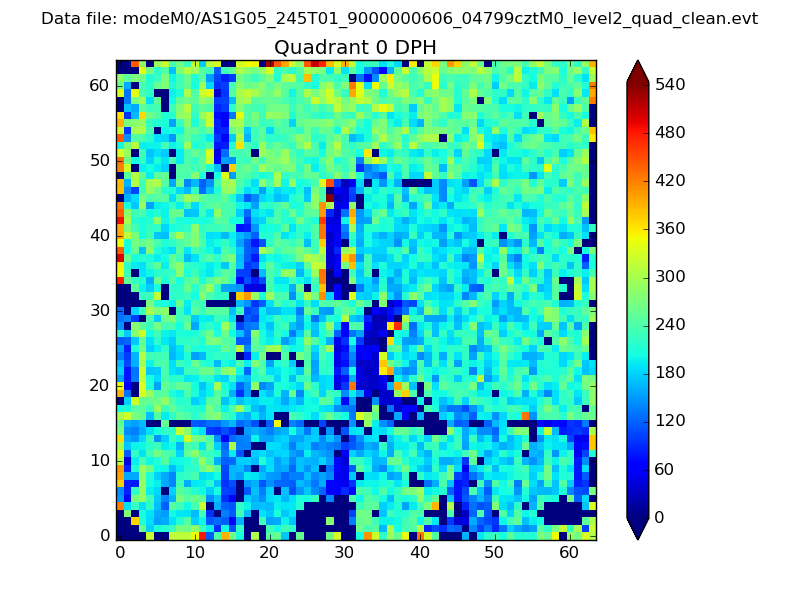 |
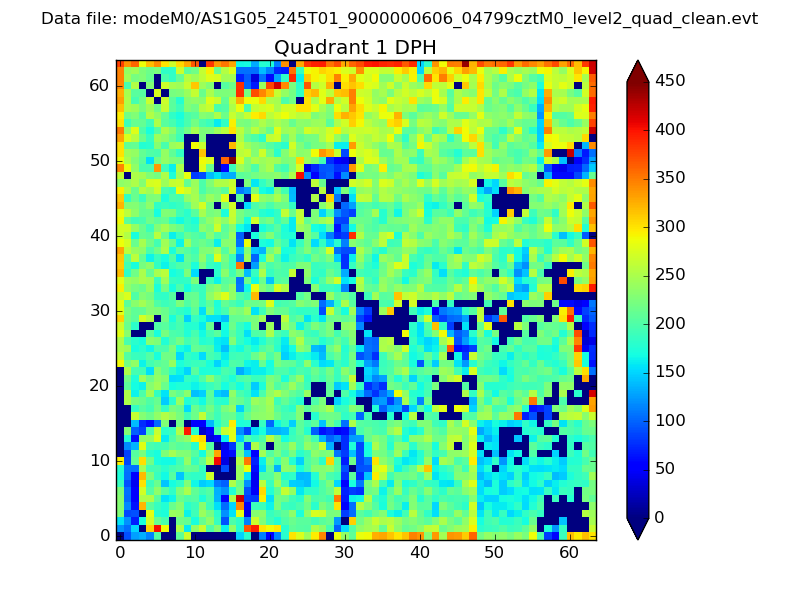 |
Quadrant B |
|---|---|---|---|
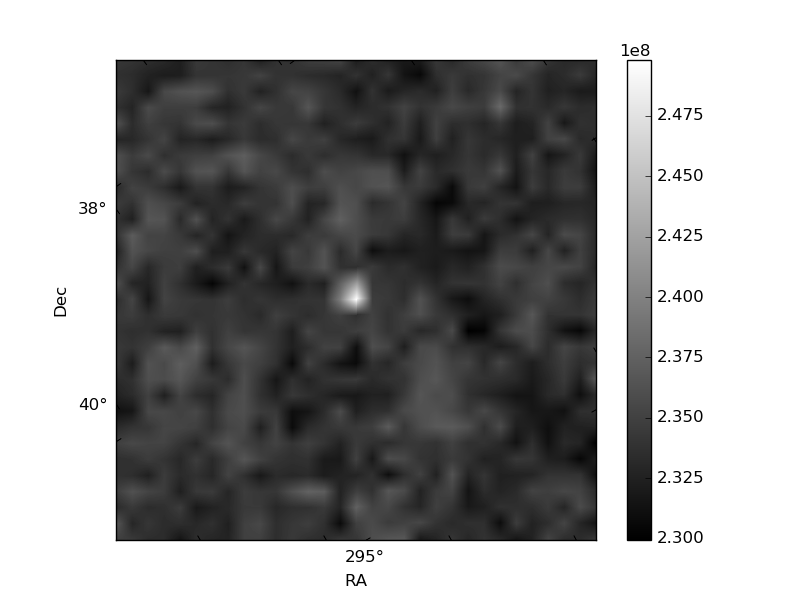
| Quadrant D | 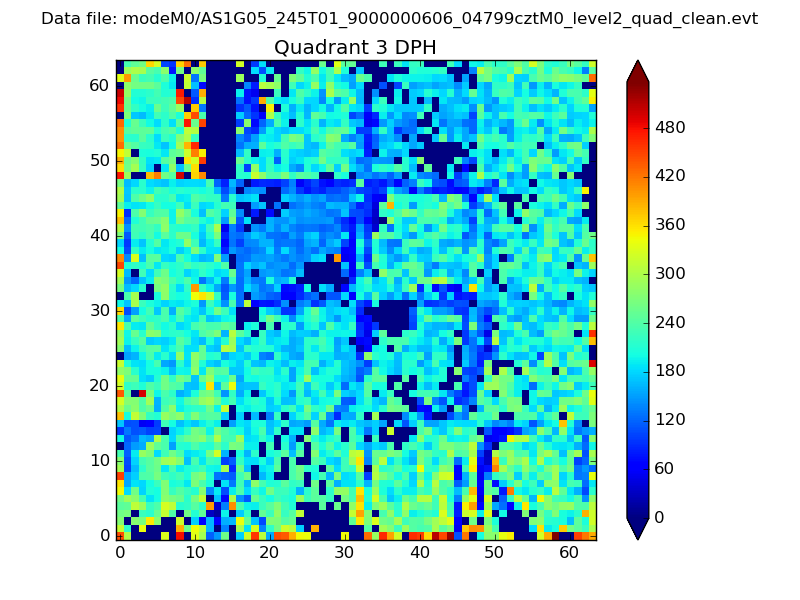 |
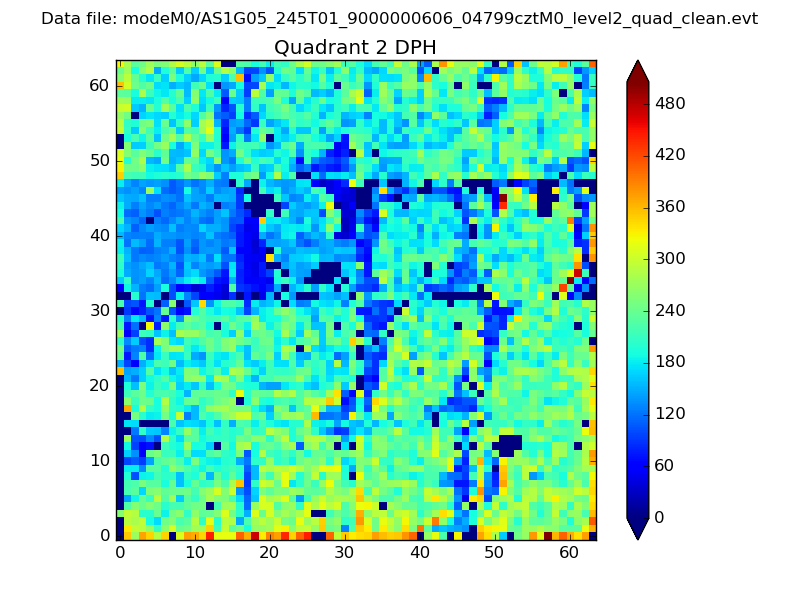 |
Quadrant C |
| Plot type | Count rate plots | Images |
|---|---|---|
| Comparison with Poisson distribution Blue bars denote a histogram of data divided into 1 sec bins. Red curve is a Poisson curve with rate = median count rate of data. |
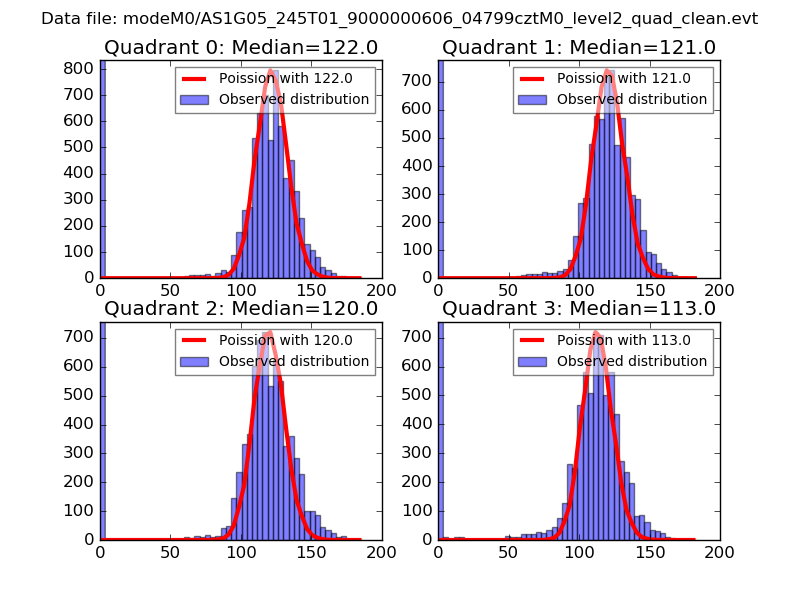 |
 |
| Quadrant-wise count rates Data is divided into 100 sec bins |
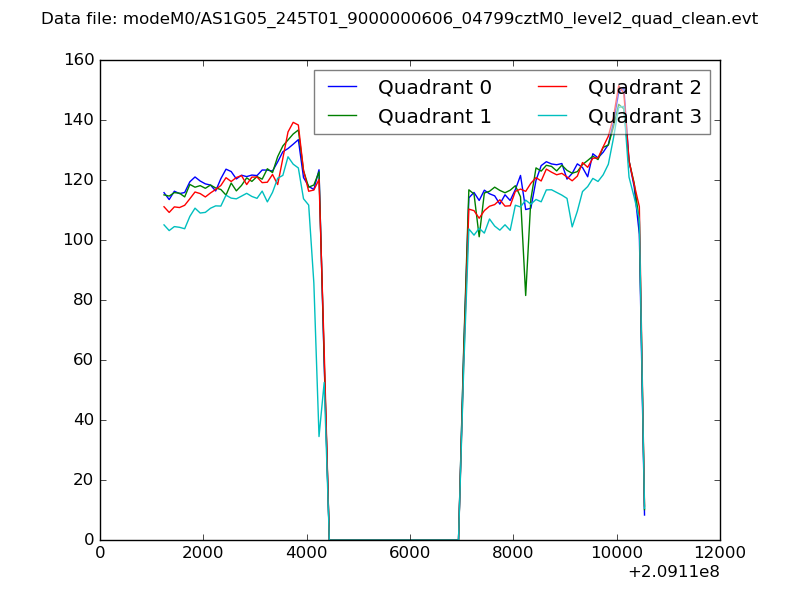 |
|
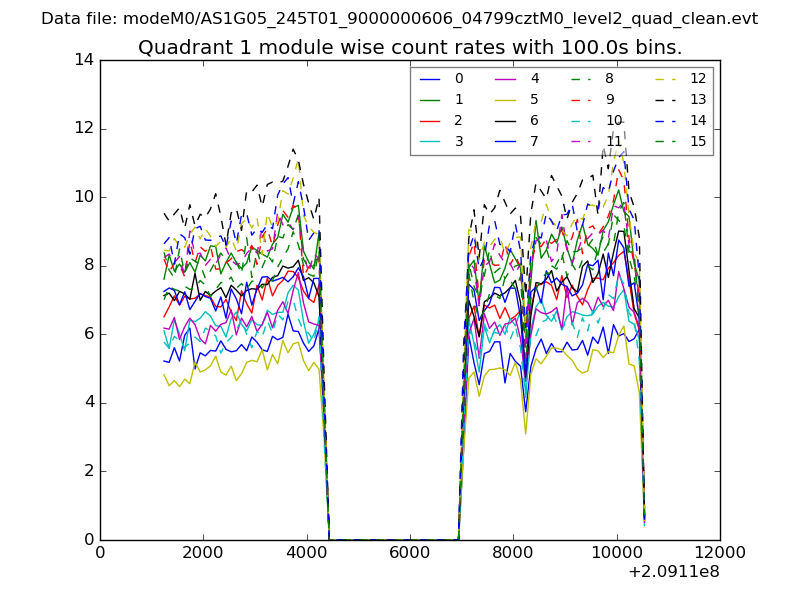
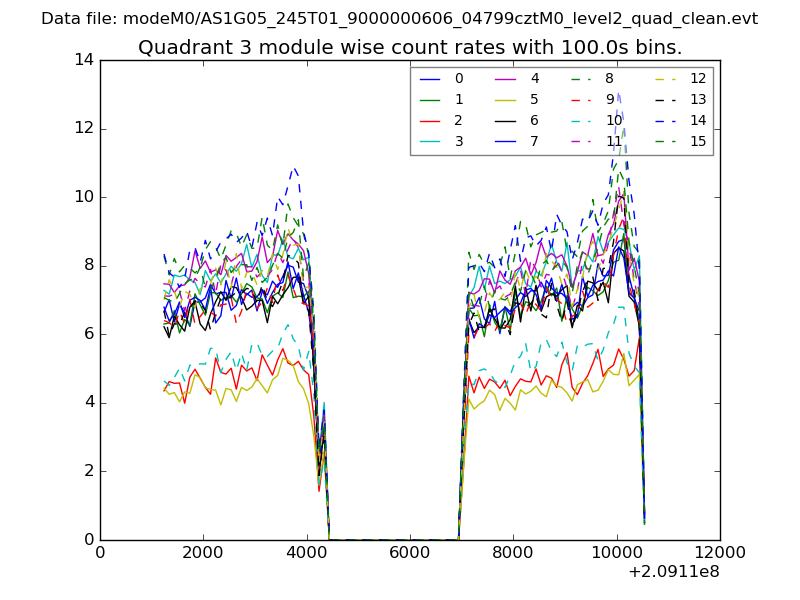
| Module-wise count rates for Quadrant A Data is divided into 100 sec bins |
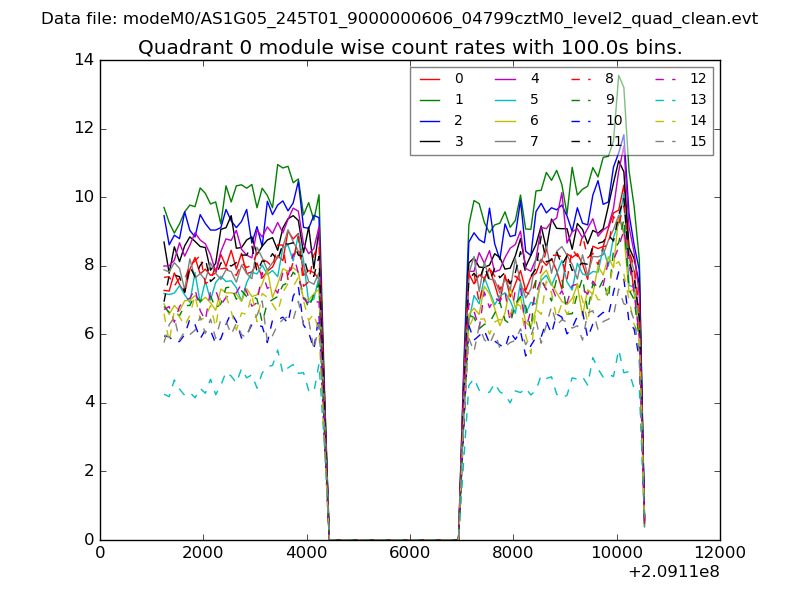 |
 |
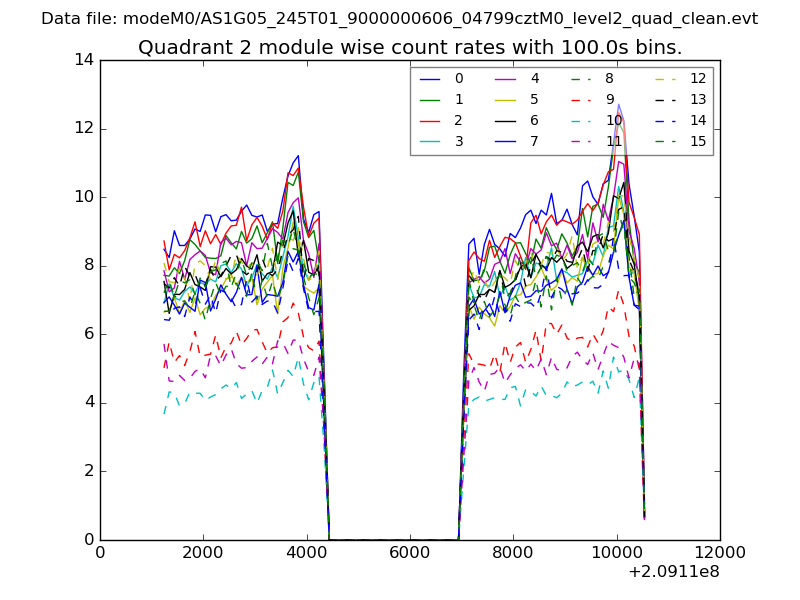
| Module-wise count rates for Quadrant B Data is divided into 100 sec bins |
 |
 |
| Module-wise count rates for Quadrant C Data is divided into 100 sec bins |
 |
 |
| Module-wise count rates for Quadrant D Data is divided into 100 sec bins |
 |
 |
| Parameter | Plot |
|---|---|
| CZT HV Monitor | 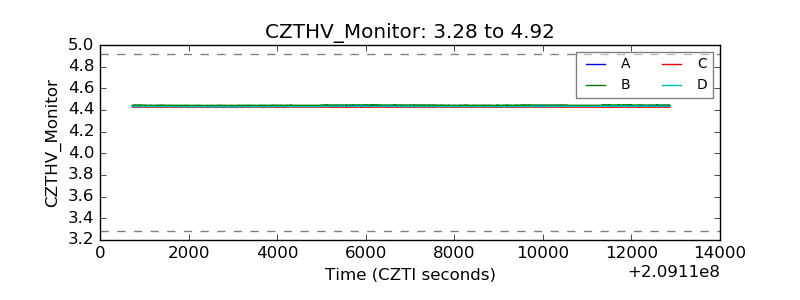 |
| D_VDD | 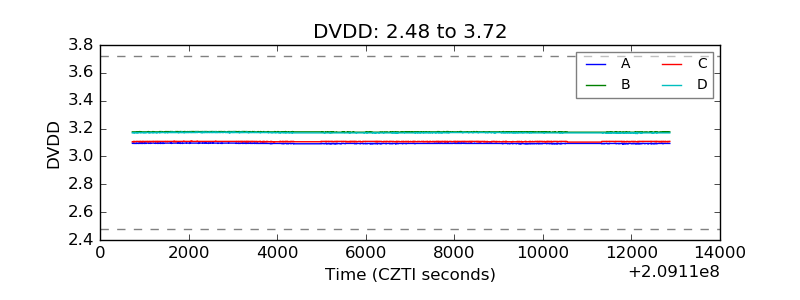 |
| Temperature 1 | 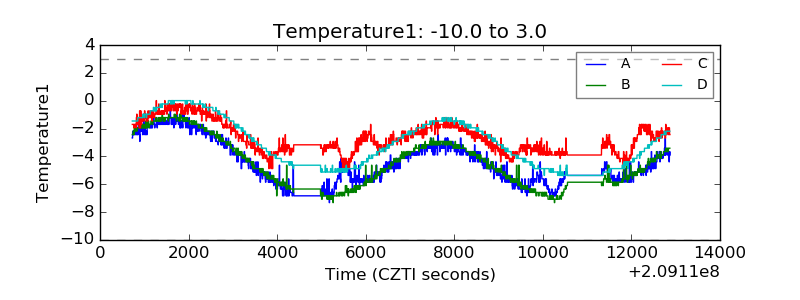 |
| Veto HV Monitor | 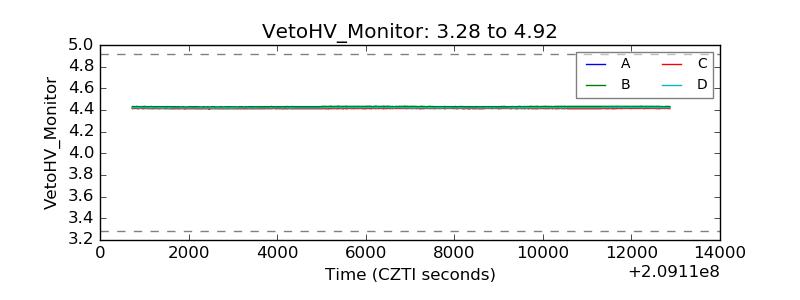 |
| Veto LLD | 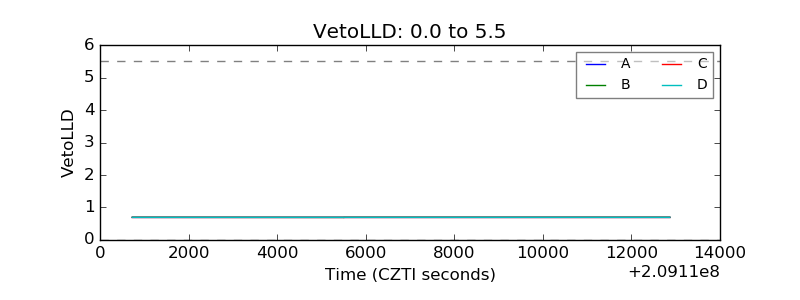 |
| Alpha Counter | 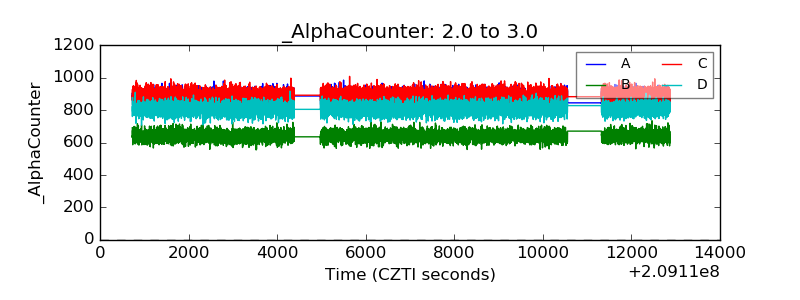 |
| _CPM_Rate | 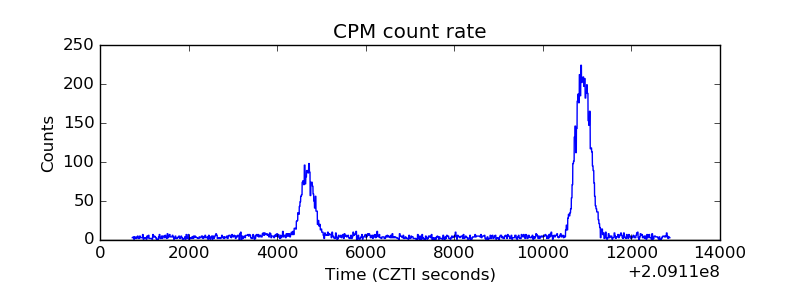 |
| CZT Counter | 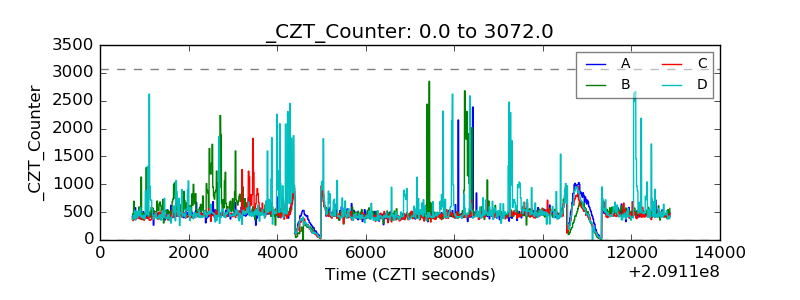 |
| +2.5 Volts monitor |  |
| +5 Volts monitor | 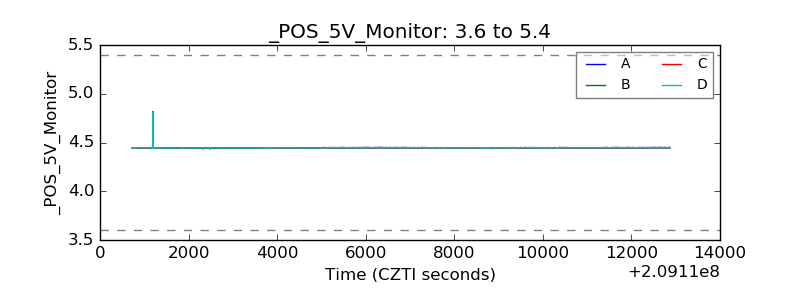 |
| _ROLL_ROT | 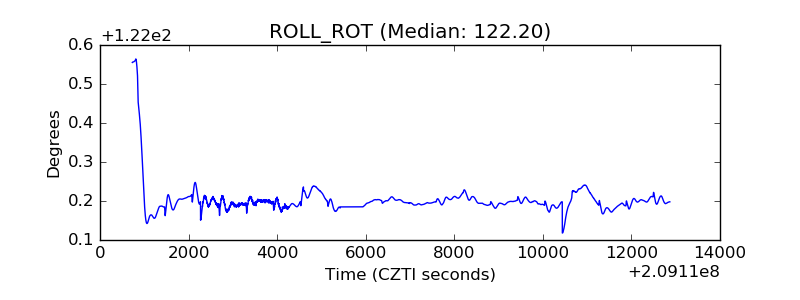 |
| _Roll_DEC | 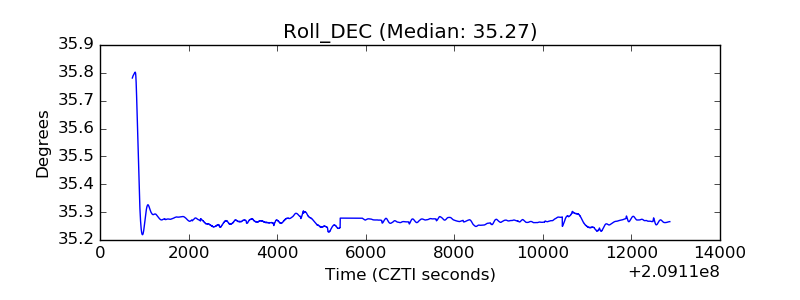 |
| _Roll_RA | 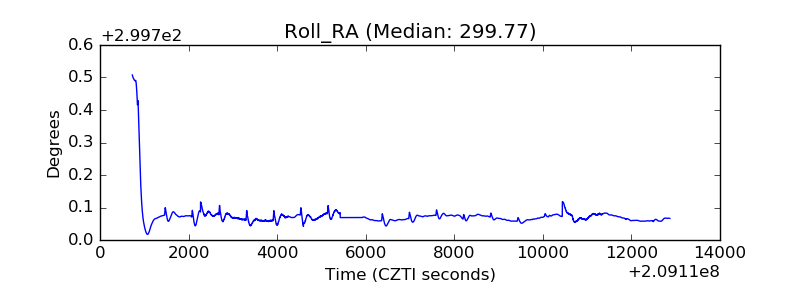 |
| Veto Counter | 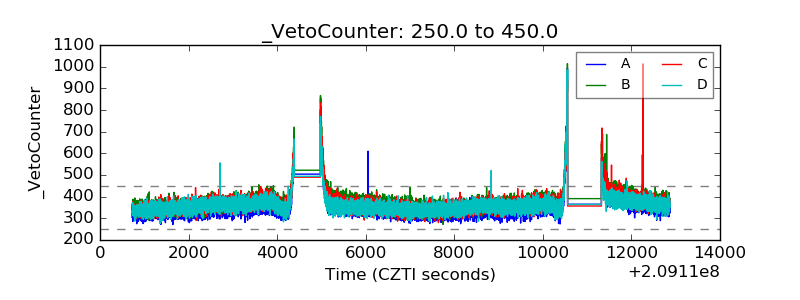 |