| Param | Original file | Final file |
|---|---|---|
| Filename | modeM0/AS1G05_142T01_9000000610cztM0_level2.fits | modeM0/AS1G05_142T01_9000000610cztM0_level2_quad_clean.evt |
| Size (bytes) | 394,416,000 | 395,841,600 |
| Size | 376.1 MB | 377.5 MB |
| Events in quadrant A | 2,353,018 | 2,293,971 |
| Events in quadrant B | 2,291,490 | 2,328,884 |
| Events in quadrant C | 2,346,122 | 2,286,158 |
| Events in quadrant D | 1,918,666 | 2,046,049 |
| Mode SS | |||
|---|---|---|---|
| Quadrant | BADHDUFLAG | Total packets | Discarded packets |
| A | 0 | 900 | 0 |
| B | 0 | 908 | 0 |
| C | 0 | 900 | 0 |
| D | 0 | 898 | 0 |
| Mode M9 | |||
|---|---|---|---|
| Quadrant | BADHDUFLAG | Total packets | Discarded packets |
| A | 0 | 64 | 0 |
| B | 0 | 64 | 0 |
| C | 0 | 64 | 0 |
| D | 0 | 64 | 0 |
| Mode M0 | |||
|---|---|---|---|
| Quadrant | BADHDUFLAG | Total packets | Discarded packets |
| A | 0 | 97052 | 0 |
| B | 0 | 101092 | 0 |
| C | 0 | 94801 | 0 |
| D | 0 | 129745 | 0 |
| Quadrant | Total seconds | Saturated seconds | Saturation percentage |
|---|---|---|---|
| A | 44220 | 1285 | 2.905925% |
| B | 44250 | 1229 | 2.777401% |
| C | 44218 | 690 | 1.560450% |
| D | 44045 | 4238 | 9.621978% |
Noise dominated data is calculated using 1-second bins in cleaned event files. If a bin has >2000 counts, and if more than 50% of those come from <1% of pixels, then it is considered to be noise-dominated and hence unusable.
| Quadrant | # 1 sec bins | Bins with >0 counts | Bins with >2000 counts | High rate bins dominated by noise | Noise dominated (total time) | Noise dominated (detector-on time) | Marked lightcurve |
|---|---|---|---|---|---|---|---|
| A | 49946 | 44374 | 0 | 0 | 0.00% | 0.00% |  |
| B | 49945 | 44428 | 0 | 0 | 0.00% | 0.00% |  |
| C | 49946 | 44423 | 0 | 0 | 0.00% | 0.00% | 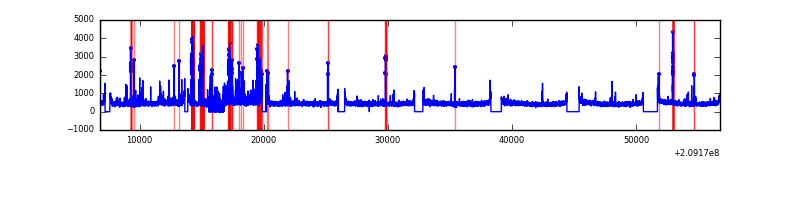 |
| D | 49945 | 43712 | 0 | 0 | 0.00% | 0.00% | 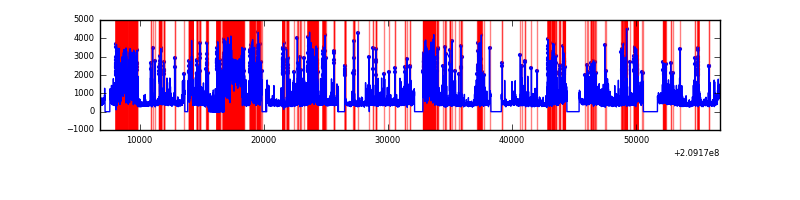 |
Top three noisy pixels from each quadrant. If the there are fewer than three noisy pixels in the level2.evt file, extra rows are filled as -1
| Pixel properties | Quadrant properties | ||||||
|---|---|---|---|---|---|---|---|
| Quadrant | DetID | PixID | Counts | Sigma | Mean | Median | Sigma |
| A | 0 | 29 | 2229 | 10.36 | 611 | 566 | 160.5 |
| A | 7 | 110 | 2077 | 9.42 | 611 | 566 | 160.5 |
| A | 0 | 30 | 1790 | 7.63 | 611 | 566 | 160.5 |
| B | 2 | 9 | 2005 | 11.53 | 602 | 569 | 124.6 |
| B | 12 | 226 | 1675 | 8.88 | 602 | 569 | 124.6 |
| B | 14 | 254 | 1621 | 8.44 | 602 | 569 | 124.6 |
| C | 1 | 80 | 1713 | 6.81 | 619 | 567 | 168.3 |
| C | 1 | 81 | 1685 | 6.64 | 619 | 567 | 168.3 |
| C | 12 | 241 | 1655 | 6.47 | 619 | 567 | 168.3 |
| D | 11 | 82 | 1630 | 7.56 | 546 | 494 | 150.2 |
| D | 1 | 3 | 1441 | 6.3 | 546 | 494 | 150.2 |
| D | 3 | 14 | 1439 | 6.29 | 546 | 494 | 150.2 |
Histogram calculated using DETX and DETY for each event in the final _common_clean file
| Quadrant A |  |
 |
Quadrant B |
|---|---|---|---|
| Quadrant D | 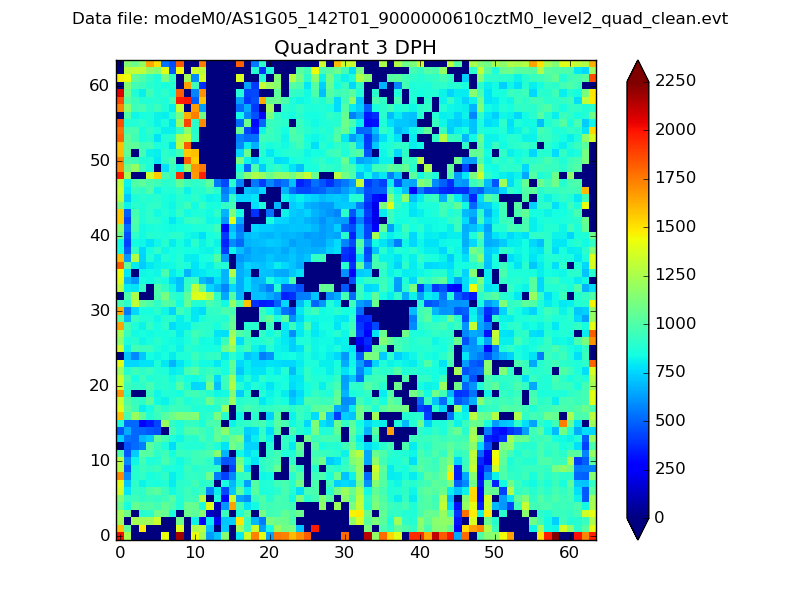 |
 |
Quadrant C |
| Plot type | Count rate plots | Images |
|---|---|---|
| Comparison with Poisson distribution Blue bars denote a histogram of data divided into 1 sec bins. Red curve is a Poisson curve with rate = median count rate of data. |
 |
 |
| Quadrant-wise count rates Data is divided into 100 sec bins |
 |
|
| Module-wise count rates for Quadrant A Data is divided into 100 sec bins |
 |
 |
| Module-wise count rates for Quadrant B Data is divided into 100 sec bins |
 |
 |
| Module-wise count rates for Quadrant C Data is divided into 100 sec bins |
 |
 |
| Module-wise count rates for Quadrant D Data is divided into 100 sec bins |
 |
 |
| Parameter | Plot |
|---|---|
| CZT HV Monitor |  |
| D_VDD | 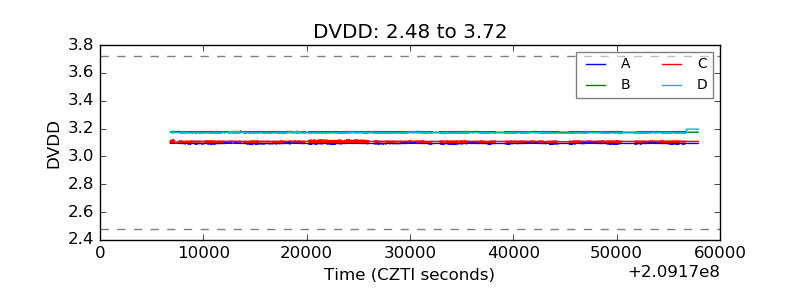 |
| Temperature 1 |  |
| Veto HV Monitor |  |
| Veto LLD |  |
| Alpha Counter |  |
| _CPM_Rate |  |
| CZT Counter |  |
| +2.5 Volts monitor |  |
| +5 Volts monitor |  |
| _ROLL_ROT |  |
| _Roll_DEC |  |
| _Roll_RA |  |
| Veto Counter |  |