| Param | Original file | Final file |
|---|---|---|
| Filename | modeM0/AS1G05_142T01_9000000610_04809cztM0_level2.evt | modeM0/AS1G05_142T01_9000000610_04809cztM0_level2_quad_clean.evt |
| Size (bytes) | 169,914,240 | 24,595,200 |
| Size | 162.0 MB | 23.5 MB |
| Events in quadrant A | 905,832 | 152,524 |
| Events in quadrant B | 972,546 | 154,005 |
| Events in quadrant C | 935,569 | 155,788 |
| Events in quadrant D | 2,198,271 | 140,993 |
| Mode SS | |||
|---|---|---|---|
| Quadrant | BADHDUFLAG | Total packets | Discarded packets |
| A | 0 | 42 | 0 |
| B | 0 | 42 | 0 |
| C | 0 | 42 | 0 |
| D | 0 | 42 | 0 |
| Mode M9 | |||
|---|---|---|---|
| Quadrant | BADHDUFLAG | Total packets | Discarded packets |
| A | 0 | 3 | 0 |
| B | 0 | 3 | 0 |
| C | 0 | 3 | 0 |
| D | 0 | 3 | 0 |
| Mode M0 | |||
|---|---|---|---|
| Quadrant | BADHDUFLAG | Total packets | Discarded packets |
| A | 0 | 4085 | 2 |
| B | 0 | 4186 | 1 |
| C | 0 | 4174 | 1 |
| D | 0 | 7832 | 1 |
| Quadrant | Total seconds | Saturated seconds | Saturation percentage |
|---|---|---|---|
| A | 1928 | 15 | 0.778008% |
| B | 1928 | 37 | 1.919087% |
| C | 1928 | 12 | 0.622407% |
| D | 1928 | 286 | 14.834025% |
Noise dominated data is calculated using 1-second bins in cleaned event files. If a bin has >2000 counts, and if more than 50% of those come from <1% of pixels, then it is considered to be noise-dominated and hence unusable.
| Quadrant | # 1 sec bins | Bins with >0 counts | Bins with >2000 counts | High rate bins dominated by noise | Noise dominated (total time) | Noise dominated (detector-on time) | Marked lightcurve |
|---|---|---|---|---|---|---|---|
| A | 2318 | 1929 | 1 | 1 | 0.04% | 0.05% | 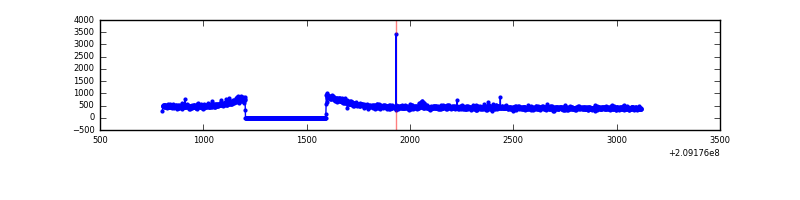 |
| B | 2318 | 1929 | 1 | 1 | 0.04% | 0.05% | 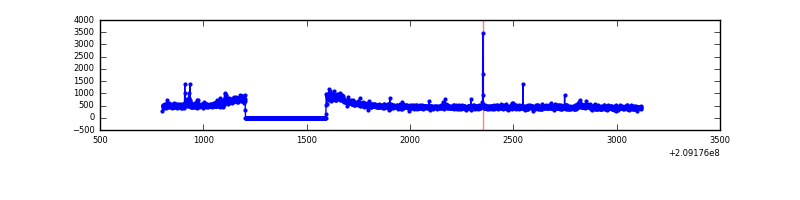 |
| C | 2318 | 1929 | 1 | 1 | 0.04% | 0.05% | 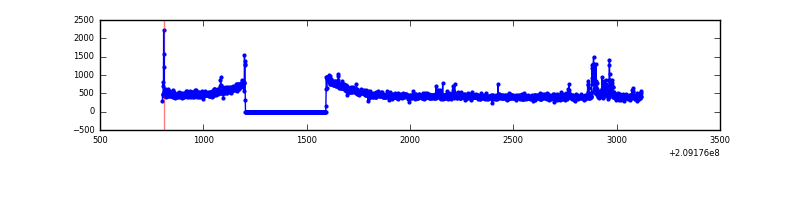 |
| D | 2318 | 1929 | 352 | 352 | 15.19% | 18.25% | 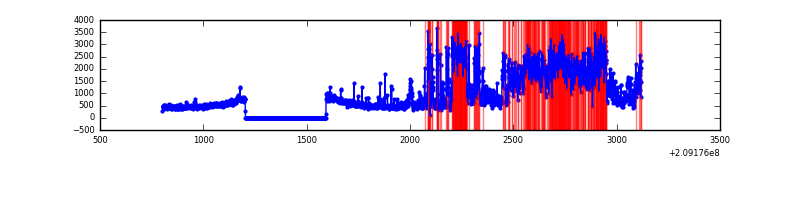 |
Top three noisy pixels from each quadrant. If the there are fewer than three noisy pixels in the level2.evt file, extra rows are filled as -1
| Pixel properties | Quadrant properties | ||||||
|---|---|---|---|---|---|---|---|
| Quadrant | DetID | PixID | Counts | Sigma | Mean | Median | Sigma |
| A | 13 | 251 | 7273 | 139.05 | 231 | 225 | 50.7 |
| A | 13 | 6 | 4181 | 78.05 | 231 | 225 | 50.7 |
| A | 0 | 226 | 2389 | 42.69 | 231 | 225 | 50.7 |
| B | 8 | 3 | 18732 | 379.7 | 235 | 229 | 48.7 |
| B | 15 | 85 | 11774 | 236.91 | 235 | 229 | 48.7 |
| B | 10 | 16 | 11480 | 230.88 | 235 | 229 | 48.7 |
| C | 9 | 247 | 45769 | 824.93 | 226 | 227 | 55.2 |
| C | 12 | 4 | 4889 | 84.45 | 226 | 227 | 55.2 |
| C | 13 | 61 | 1922 | 30.7 | 226 | 227 | 55.2 |
| D | 13 | 235 | 1226785 | 22197.07 | 216 | 208 | 55.3 |
| D | 2 | 136 | 68525 | 1236.32 | 216 | 208 | 55.3 |
| D | 2 | 14 | 21866 | 391.94 | 216 | 208 | 55.3 |
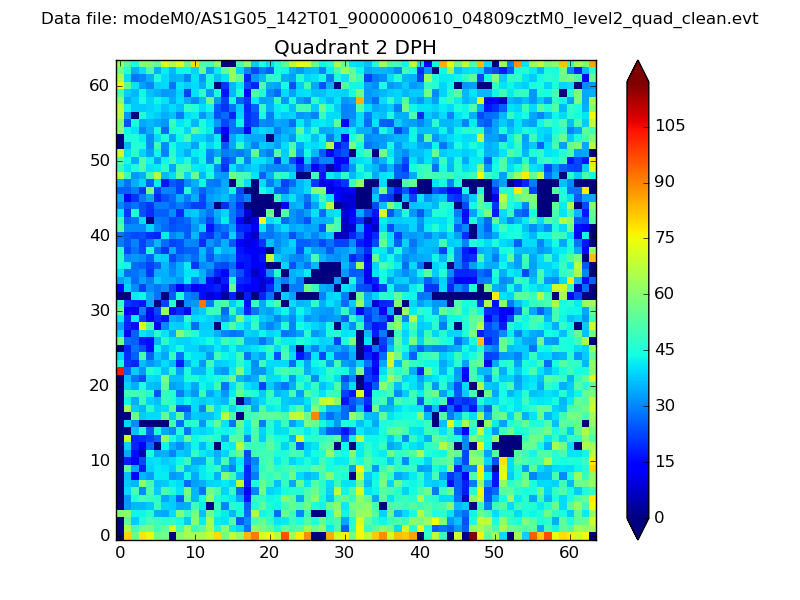
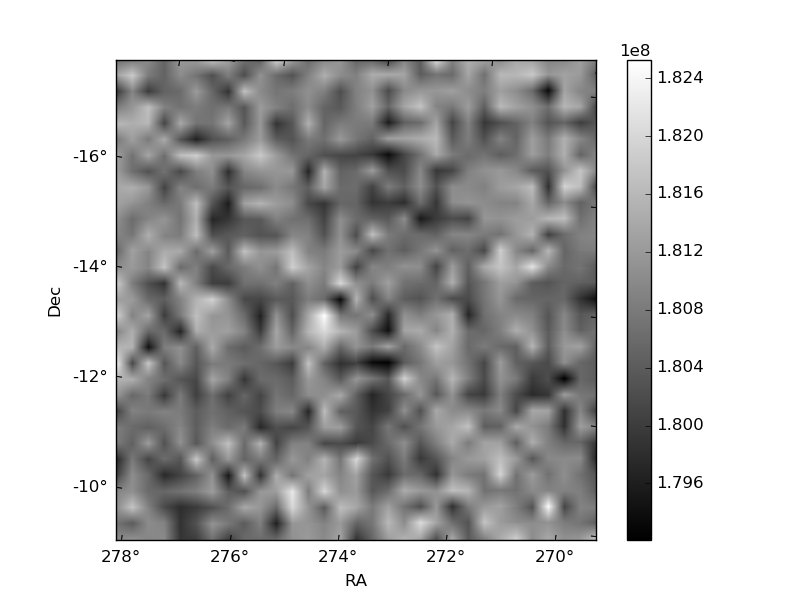
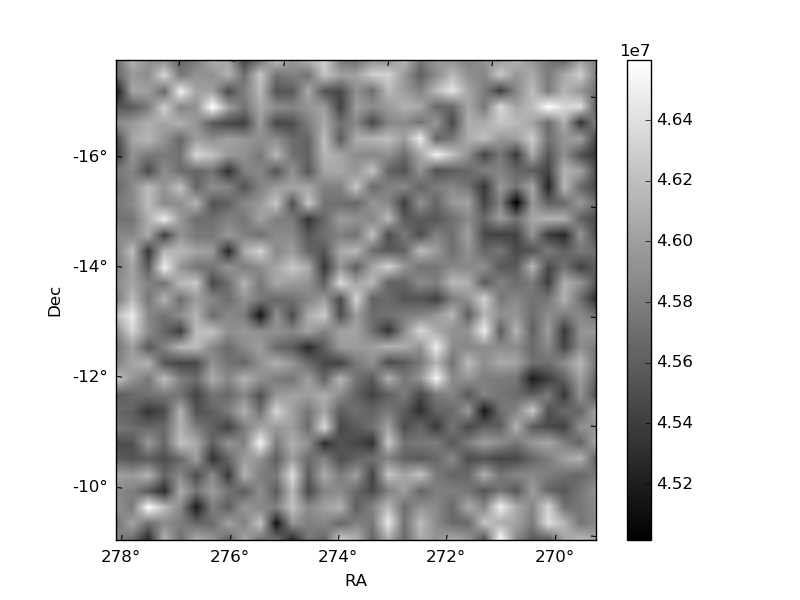
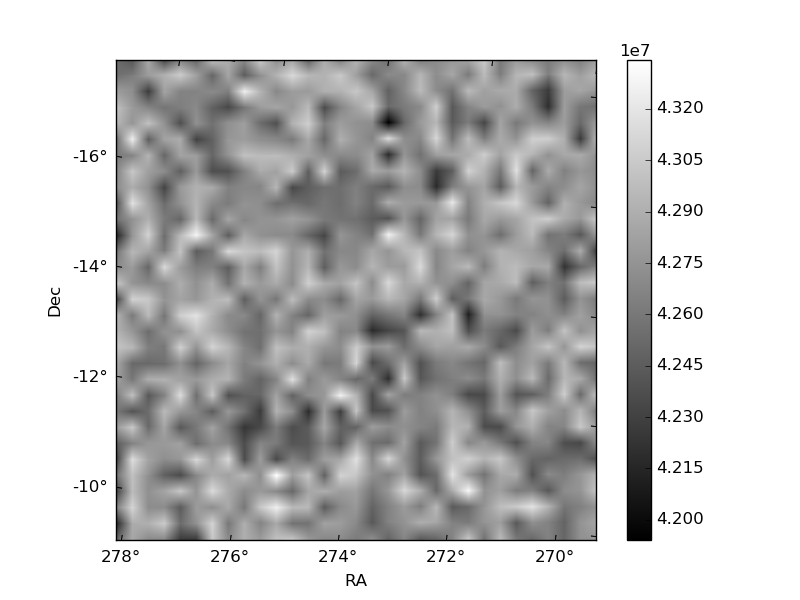
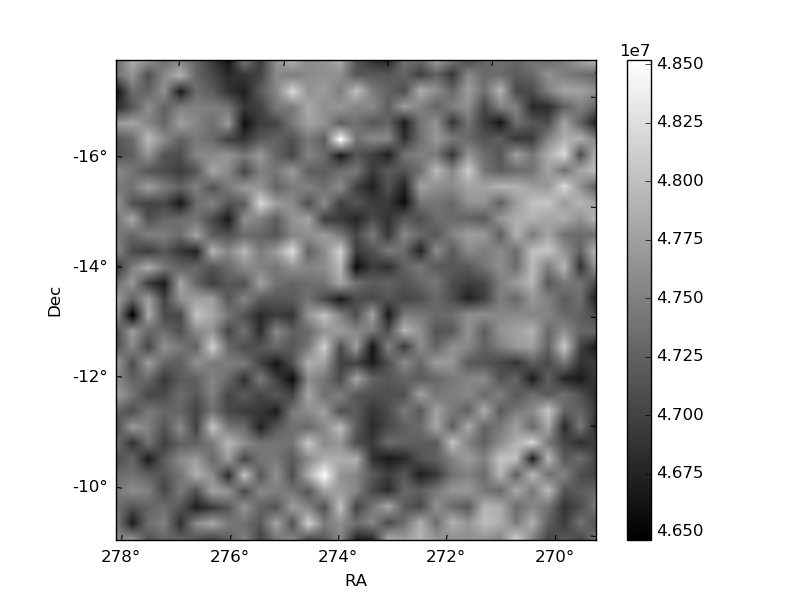
Histogram calculated using DETX and DETY for each event in the final _common_clean file
| Quadrant A | 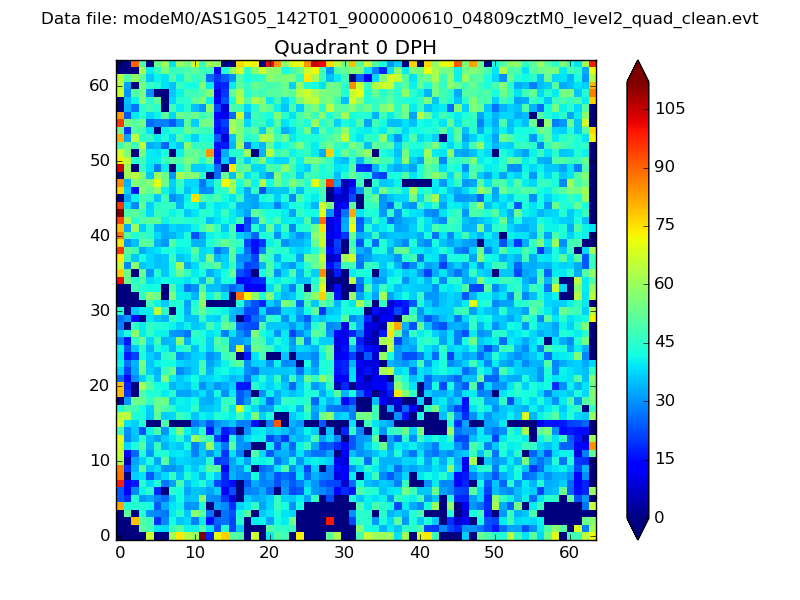 |
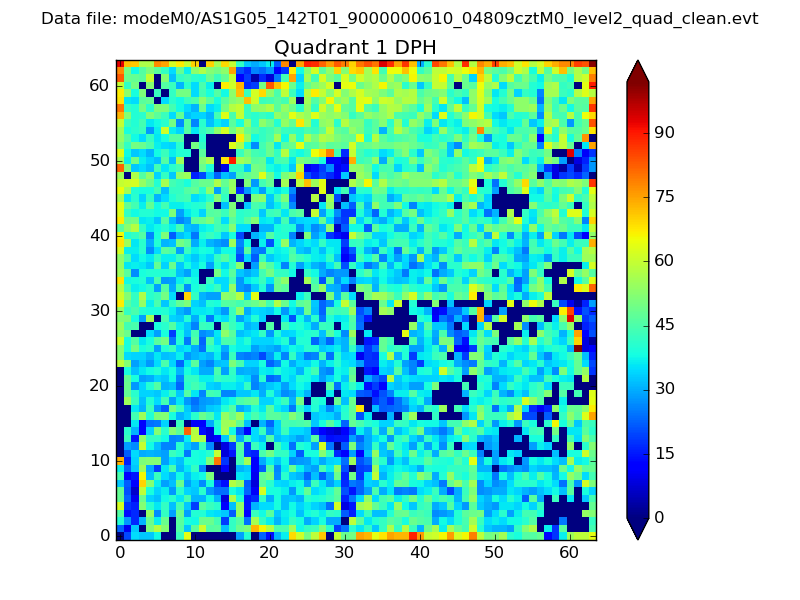 |
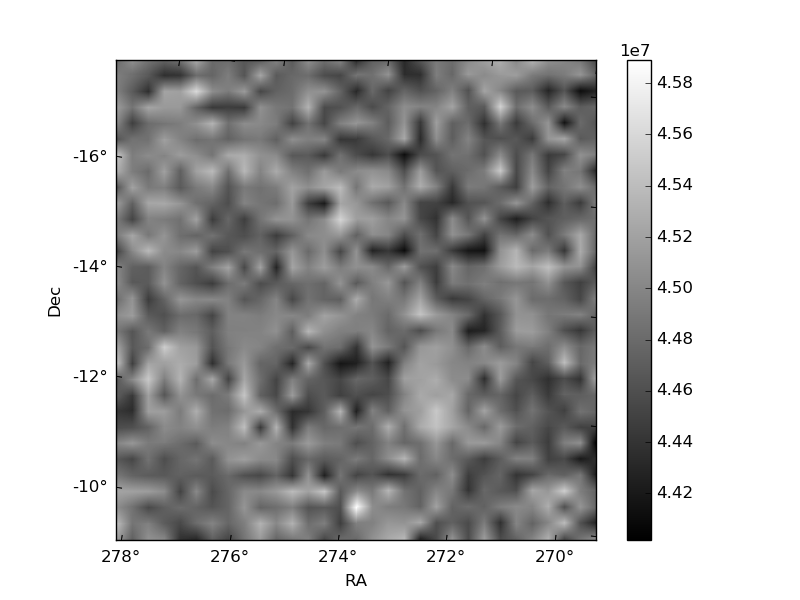
Quadrant B |
|---|---|---|---|
| Quadrant D | 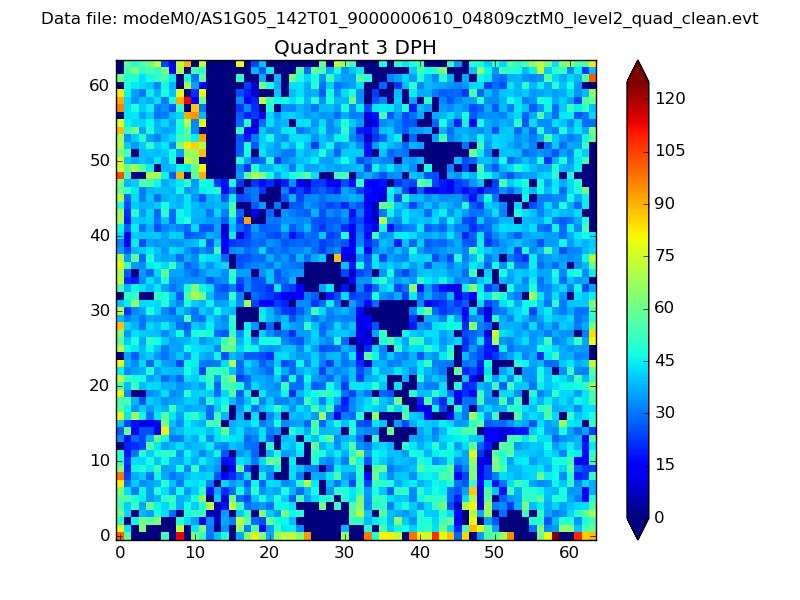 |
 |
Quadrant C |
| Plot type | Count rate plots | Images |
|---|---|---|
| Comparison with Poisson distribution Blue bars denote a histogram of data divided into 1 sec bins. Red curve is a Poisson curve with rate = median count rate of data. |
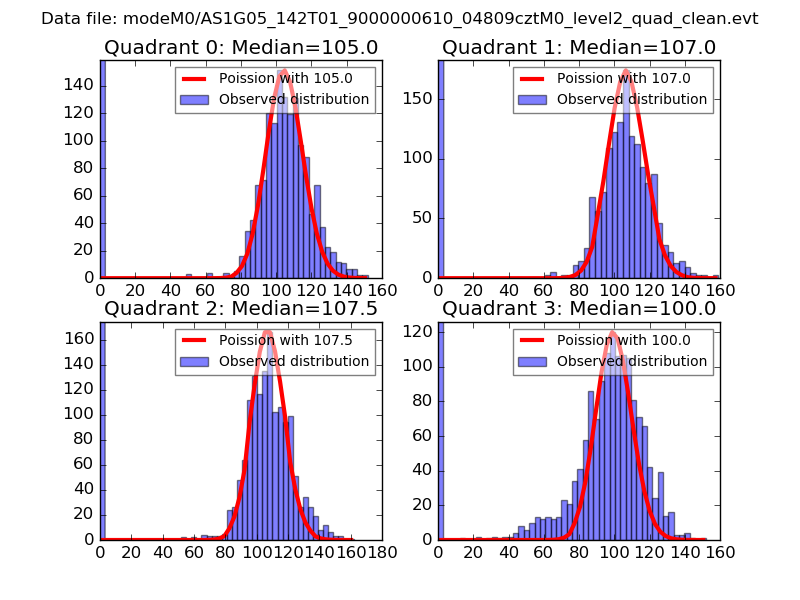 |
 |
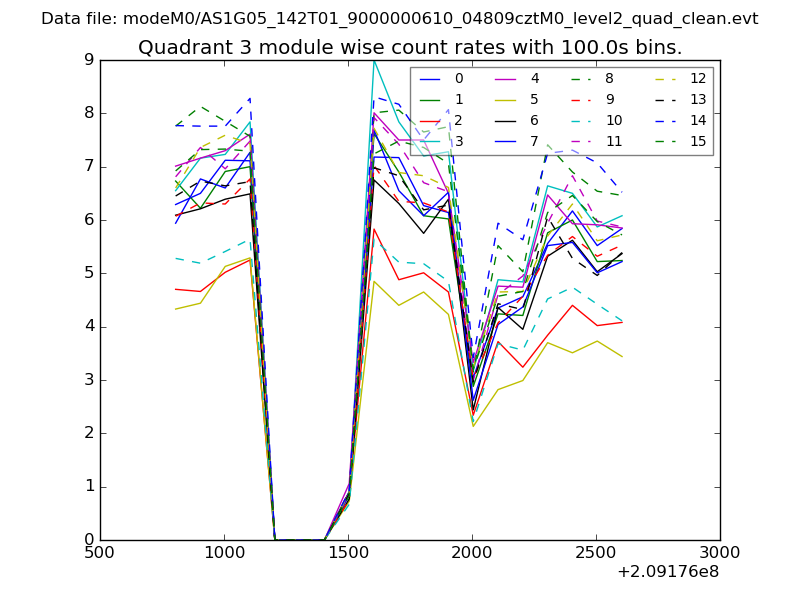
| Quadrant-wise count rates Data is divided into 100 sec bins |
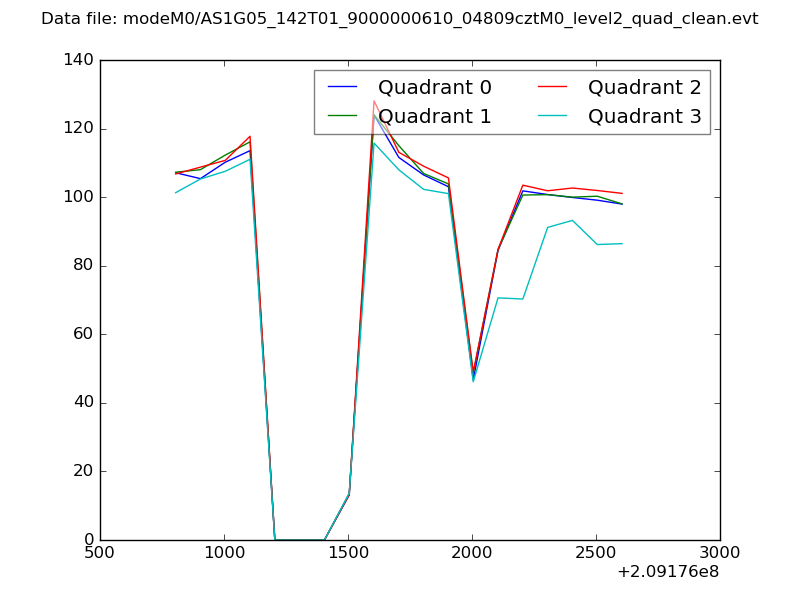 |
|
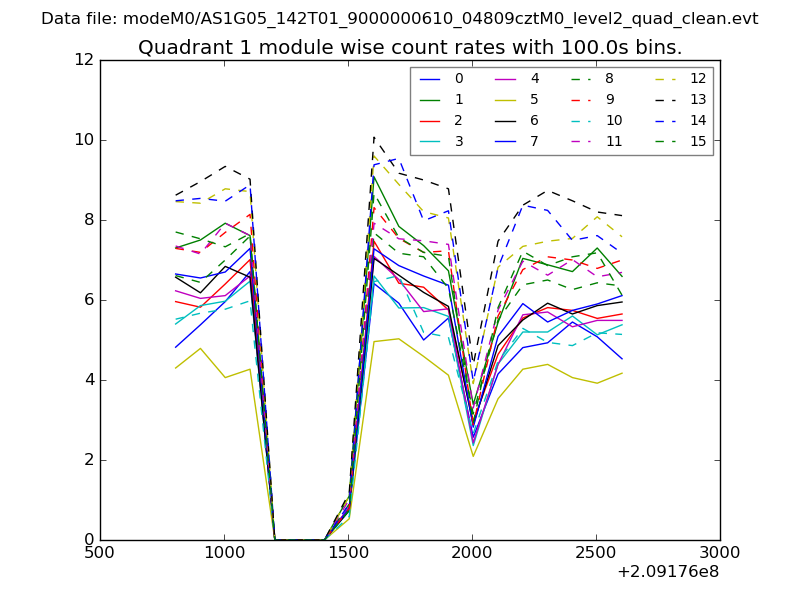
| Module-wise count rates for Quadrant A Data is divided into 100 sec bins |
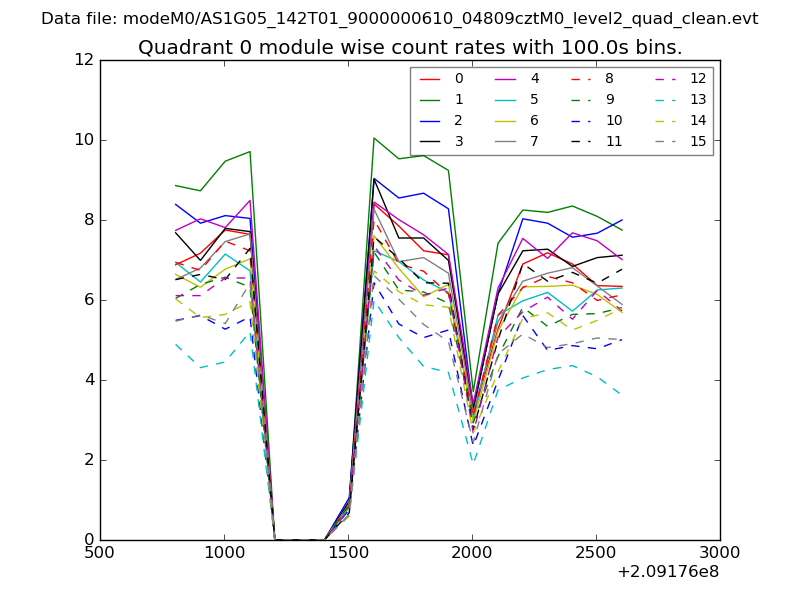 |
 |
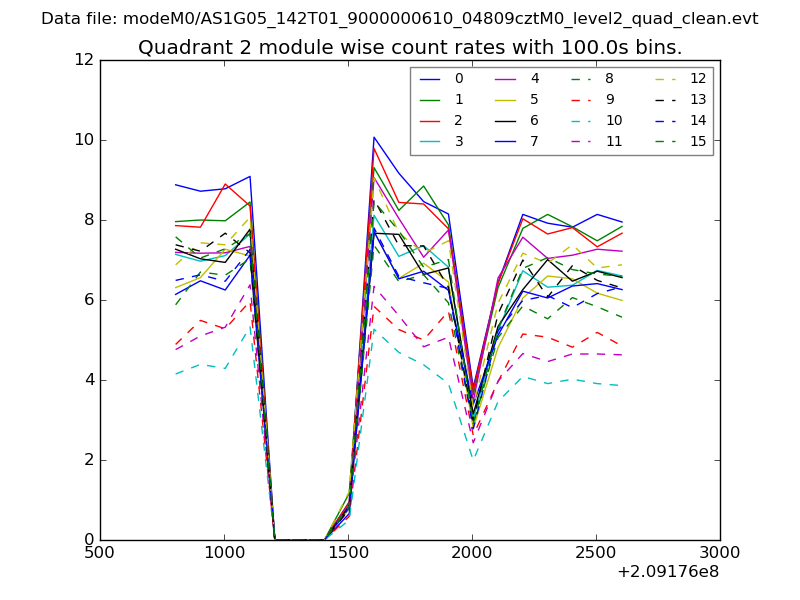
| Module-wise count rates for Quadrant B Data is divided into 100 sec bins |
 |
 |
| Module-wise count rates for Quadrant C Data is divided into 100 sec bins |
 |
 |
| Module-wise count rates for Quadrant D Data is divided into 100 sec bins |
 |
 |
| Parameter | Plot |
|---|---|
| CZT HV Monitor | 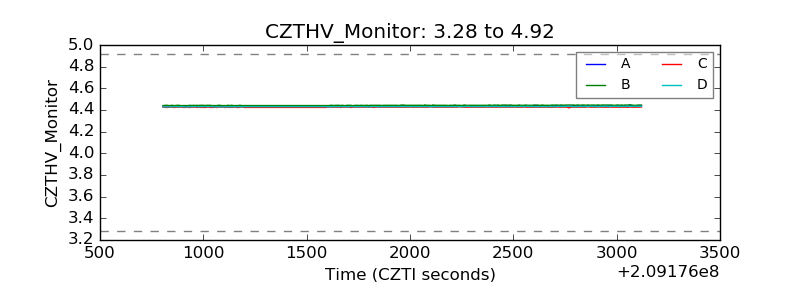 |
| D_VDD | 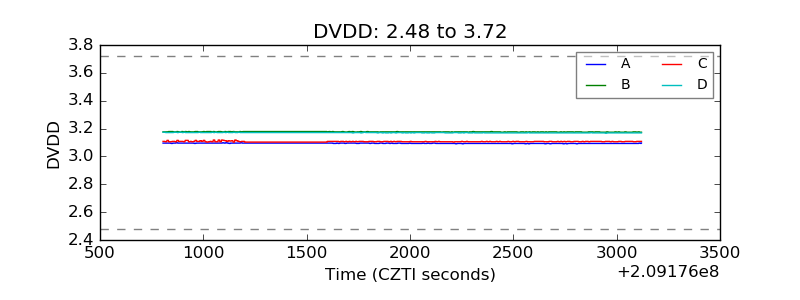 |
| Temperature 1 | 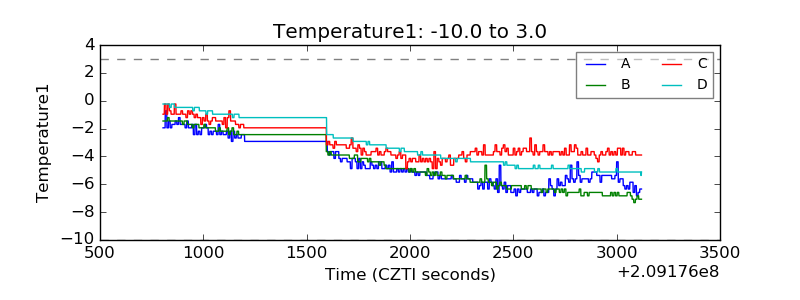 |
| Veto HV Monitor | 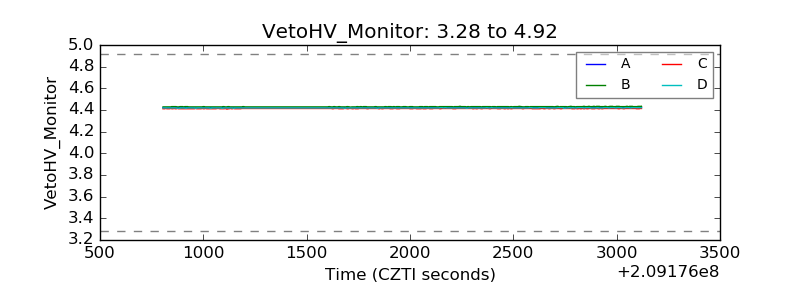 |
| Veto LLD | 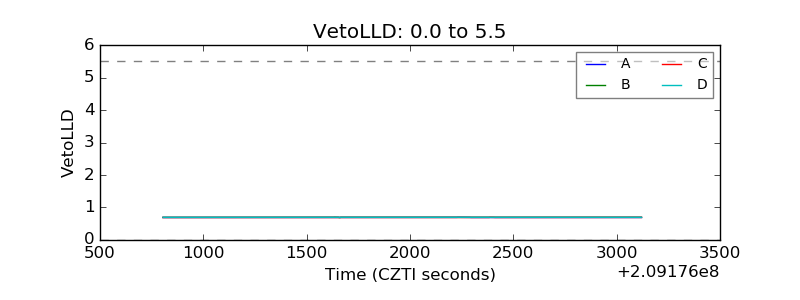 |
| Alpha Counter | 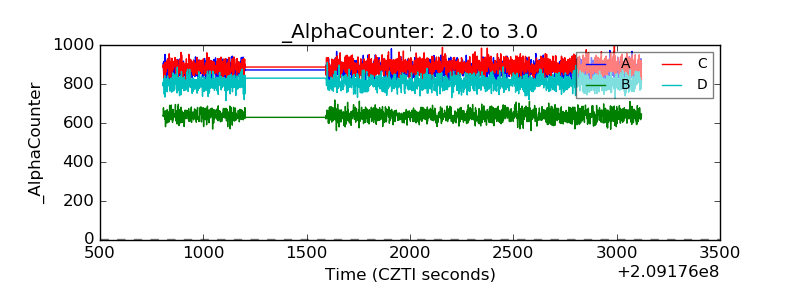 |
| _CPM_Rate | 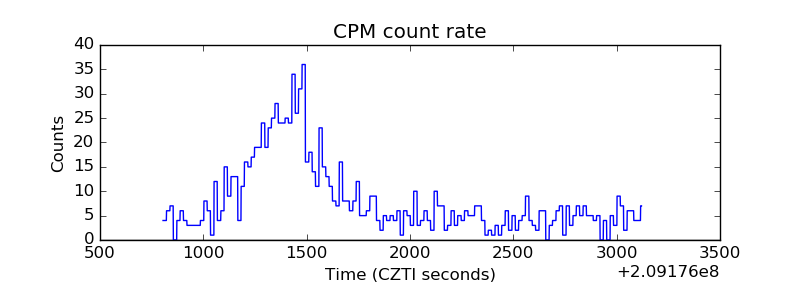 |
| CZT Counter | 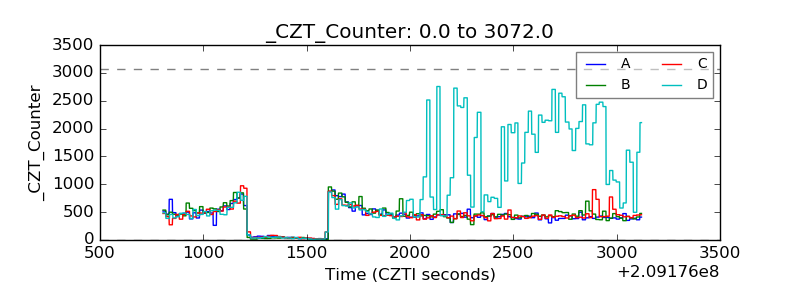 |
| +2.5 Volts monitor | 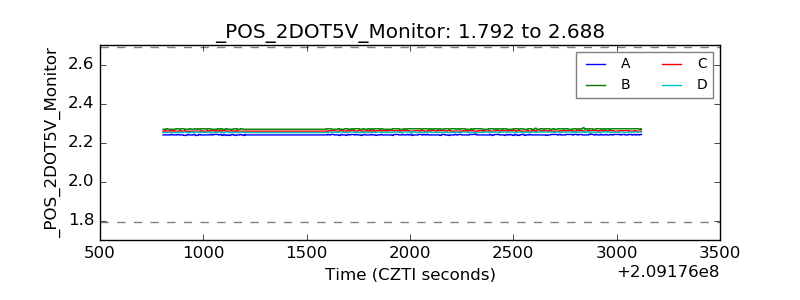 |
| +5 Volts monitor |  |
| _ROLL_ROT | 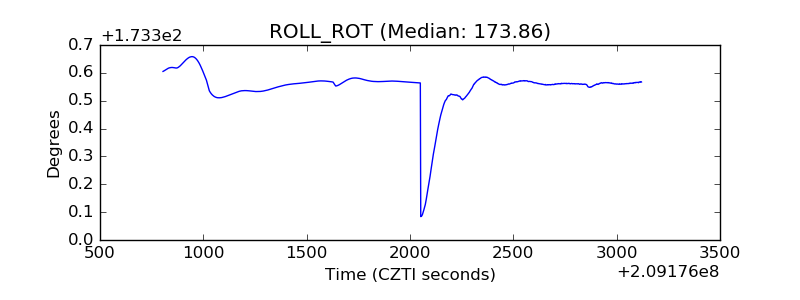 |
| _Roll_DEC | 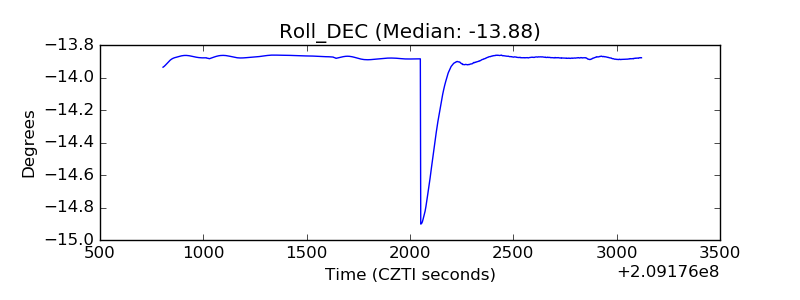 |
| _Roll_RA | 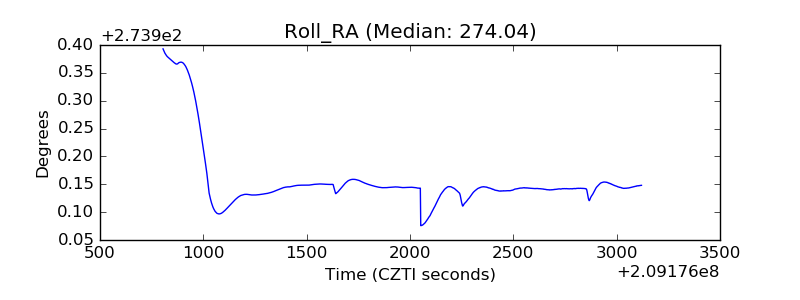 |
| Veto Counter | 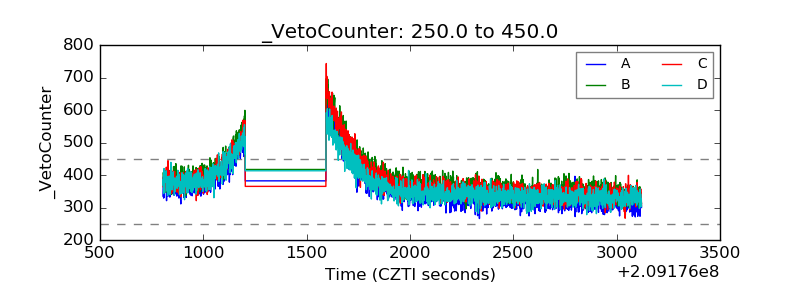 |