| Param | Original file | Final file |
|---|---|---|
| Filename | modeM0/AS1G05_142T01_9000000610_04810cztM0_level2.evt | modeM0/AS1G05_142T01_9000000610_04810cztM0_level2_quad_clean.evt |
| Size (bytes) | 574,721,280 | 72,132,480 |
| Size | 548.1 MB | 68.8 MB |
| Events in quadrant A | 3,287,023 | 424,537 |
| Events in quadrant B | 3,440,529 | 426,468 |
| Events in quadrant C | 3,786,026 | 425,058 |
| Events in quadrant D | 6,396,512 | 399,302 |
| Mode SS | |||
|---|---|---|---|
| Quadrant | BADHDUFLAG | Total packets | Discarded packets |
| A | 0 | 150 | 0 |
| B | 0 | 150 | 0 |
| C | 0 | 150 | 0 |
| D | 0 | 150 | 0 |
| Mode M9 | |||
|---|---|---|---|
| Quadrant | BADHDUFLAG | Total packets | Discarded packets |
| A | 0 | 2 | 0 |
| B | 0 | 2 | 0 |
| C | 0 | 2 | 0 |
| D | 0 | 2 | 0 |
| Mode M0 | |||
|---|---|---|---|
| Quadrant | BADHDUFLAG | Total packets | Discarded packets |
| A | 0 | 15085 | 2 |
| B | 0 | 15213 | 1 |
| C | 0 | 16518 | 1 |
| D | 0 | 24114 | 1 |
| Quadrant | Total seconds | Saturated seconds | Saturation percentage |
|---|---|---|---|
| A | 7297 | 88 | 1.205975% |
| B | 7297 | 105 | 1.438948% |
| C | 7297 | 185 | 2.535288% |
| D | 7297 | 698 | 9.565575% |
Noise dominated data is calculated using 1-second bins in cleaned event files. If a bin has >2000 counts, and if more than 50% of those come from <1% of pixels, then it is considered to be noise-dominated and hence unusable.
| Quadrant | # 1 sec bins | Bins with >0 counts | Bins with >2000 counts | High rate bins dominated by noise | Noise dominated (total time) | Noise dominated (detector-on time) | Marked lightcurve |
|---|---|---|---|---|---|---|---|
| A | 7532 | 7298 | 4 | 4 | 0.05% | 0.05% | 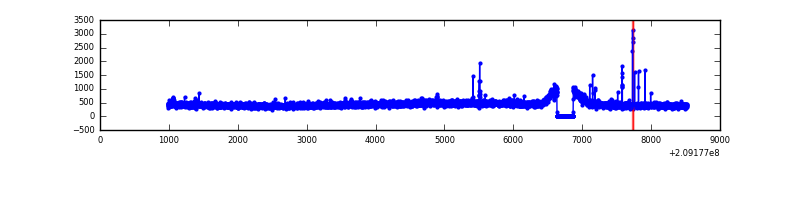 |
| B | 7532 | 7298 | 4 | 4 | 0.05% | 0.05% | 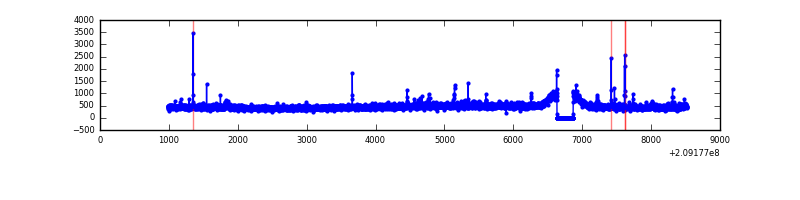 |
| C | 7532 | 7298 | 116 | 116 | 1.54% | 1.59% | 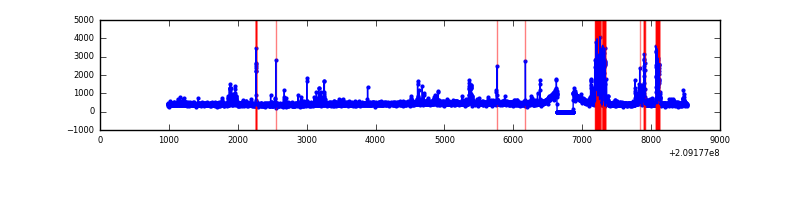 |
| D | 7532 | 7298 | 780 | 780 | 10.36% | 10.69% | 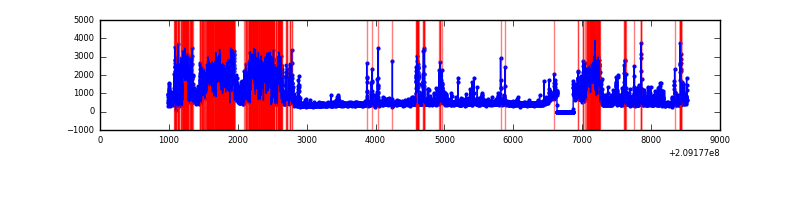 |
Top three noisy pixels from each quadrant. If the there are fewer than three noisy pixels in the level2.evt file, extra rows are filled as -1
| Pixel properties | Quadrant properties | ||||||
|---|---|---|---|---|---|---|---|
| Quadrant | DetID | PixID | Counts | Sigma | Mean | Median | Sigma |
| A | 13 | 251 | 27979 | 157.15 | 836 | 816 | 172.8 |
| A | 0 | 50 | 20308 | 112.77 | 836 | 816 | 172.8 |
| A | 13 | 6 | 11914 | 64.21 | 836 | 816 | 172.8 |
| B | 10 | 16 | 53598 | 316.07 | 852 | 831 | 166.9 |
| B | 15 | 85 | 22121 | 127.53 | 852 | 831 | 166.9 |
| B | 14 | 167 | 20039 | 115.06 | 852 | 831 | 166.9 |
| C | 9 | 247 | 593918 | 3116.35 | 810 | 814 | 190.3 |
| C | 12 | 4 | 14209 | 70.38 | 810 | 814 | 190.3 |
| C | 8 | 222 | 7805 | 36.73 | 810 | 814 | 190.3 |
| D | 13 | 235 | 2668103 | 13680.41 | 795 | 771 | 195.0 |
| D | 12 | 79 | 251739 | 1287.18 | 795 | 771 | 195.0 |
| D | 2 | 136 | 221028 | 1129.67 | 795 | 771 | 195.0 |
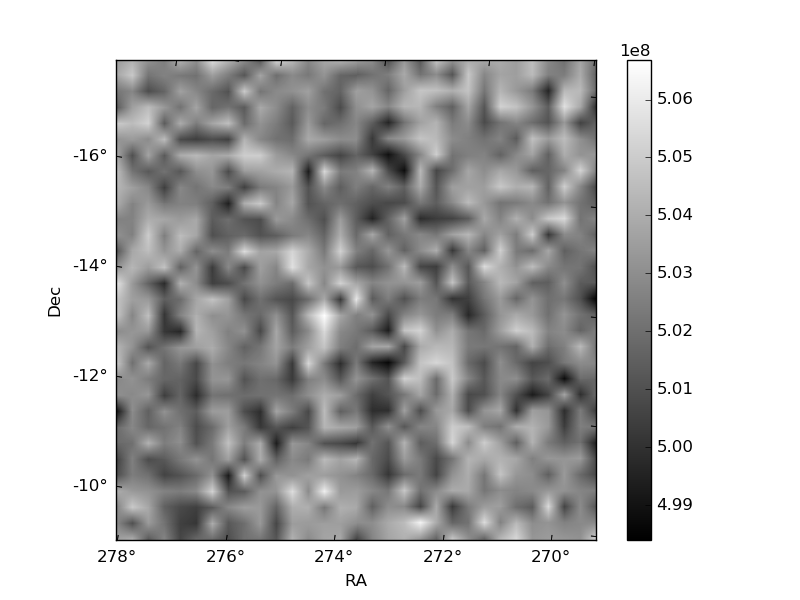
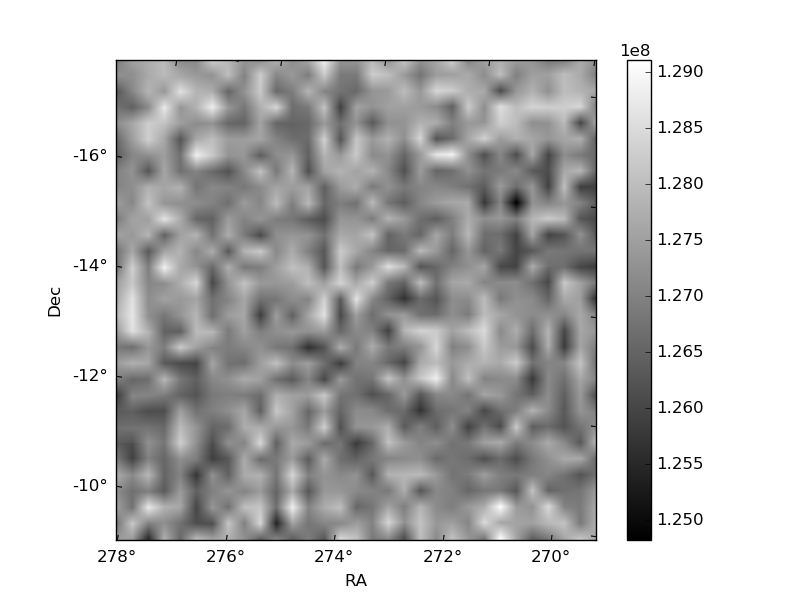
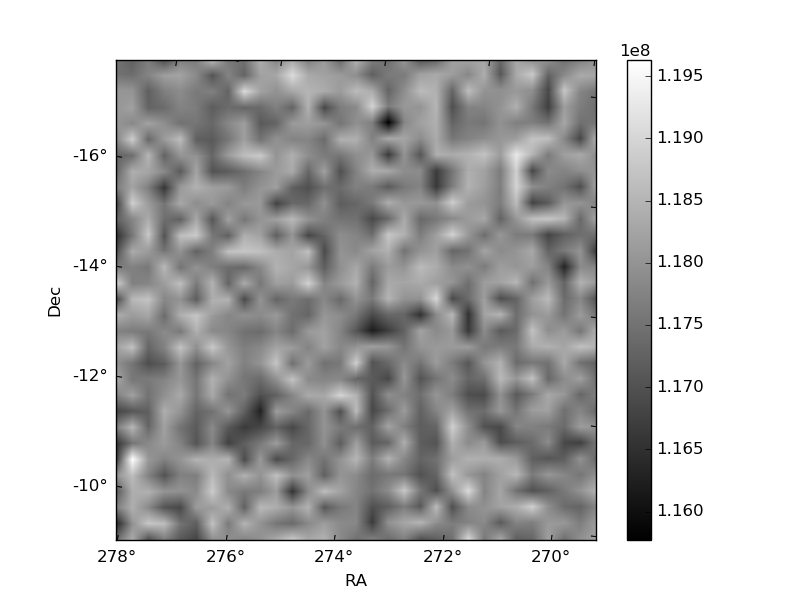
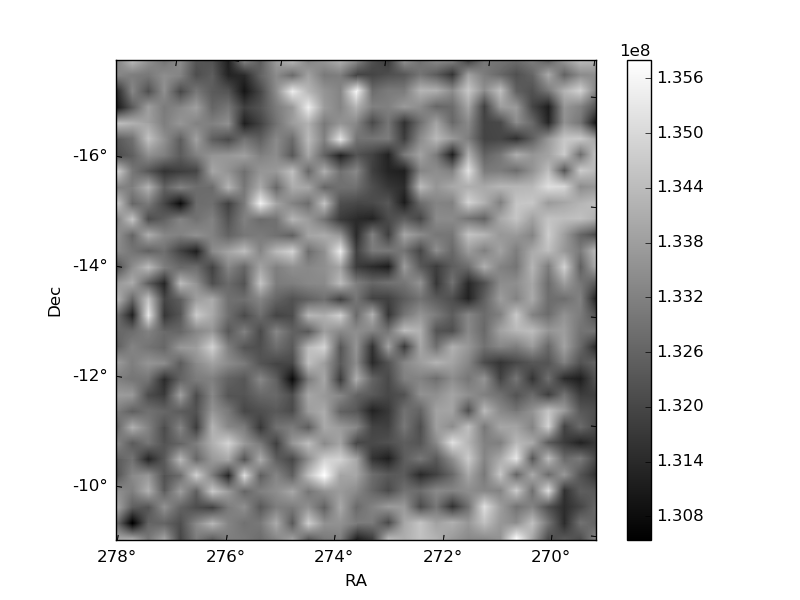
Histogram calculated using DETX and DETY for each event in the final _common_clean file
| Quadrant A | 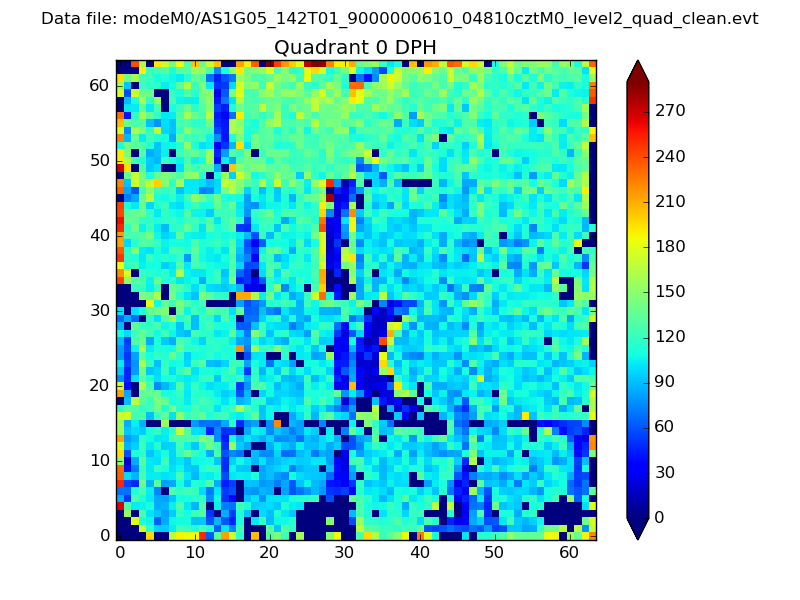 |
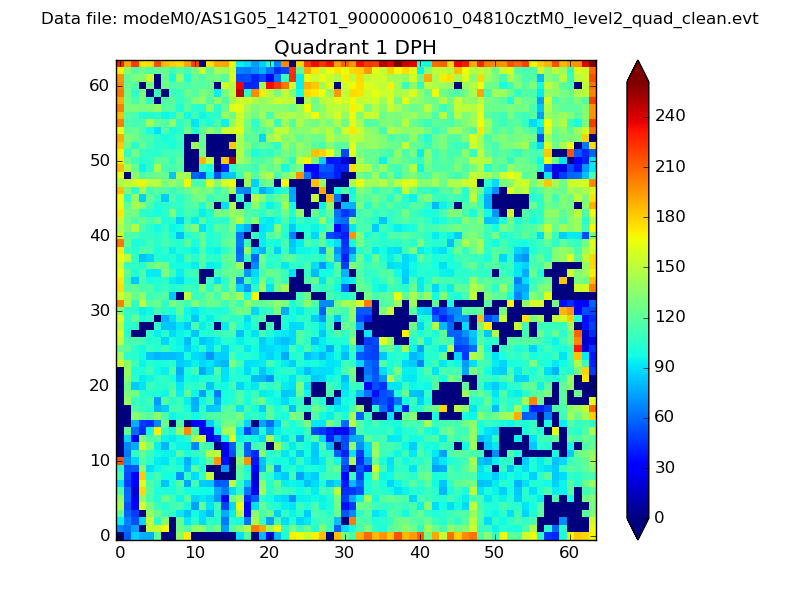 |
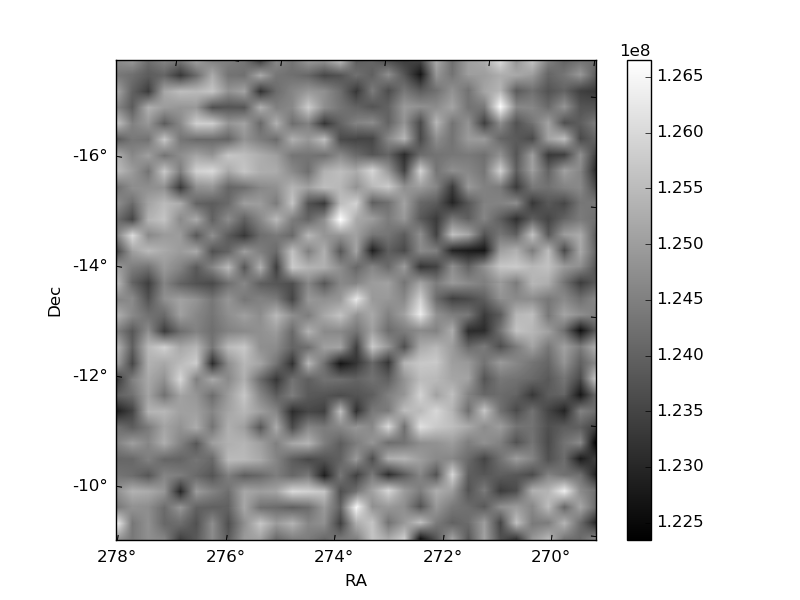
Quadrant B |
|---|---|---|---|
| Quadrant D | 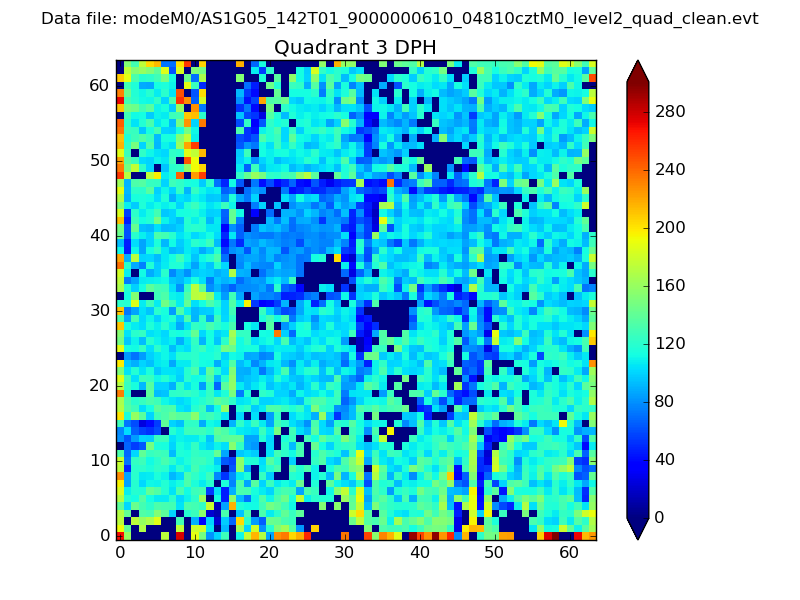 |
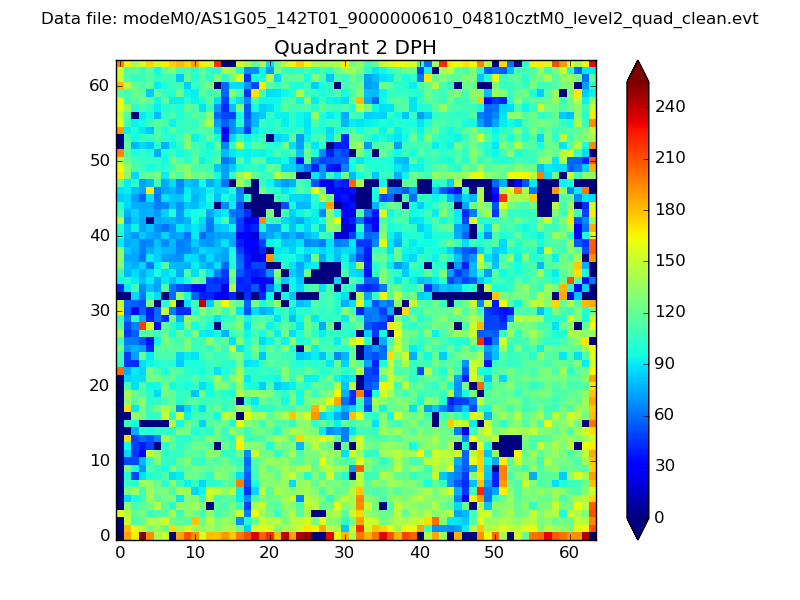 |
Quadrant C |
| Plot type | Count rate plots | Images |
|---|---|---|
| Comparison with Poisson distribution Blue bars denote a histogram of data divided into 1 sec bins. Red curve is a Poisson curve with rate = median count rate of data. |
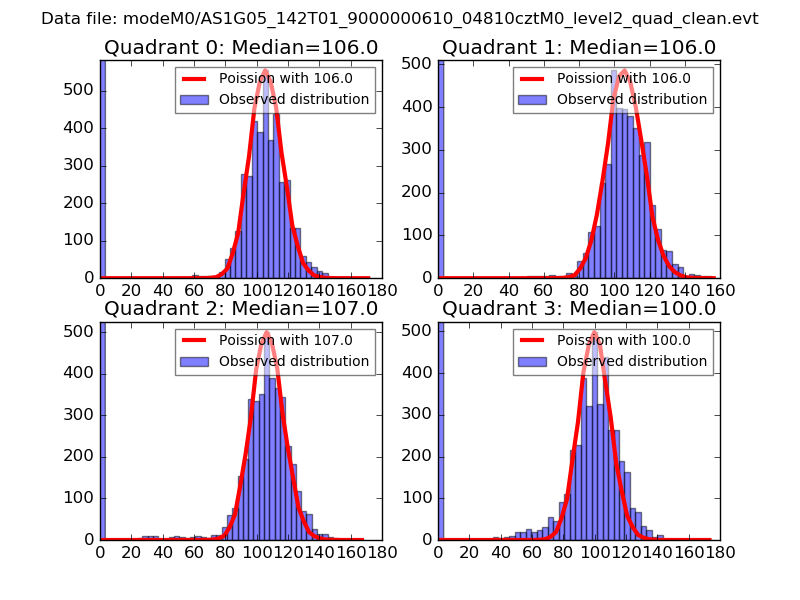 |
 |
| Quadrant-wise count rates Data is divided into 100 sec bins |
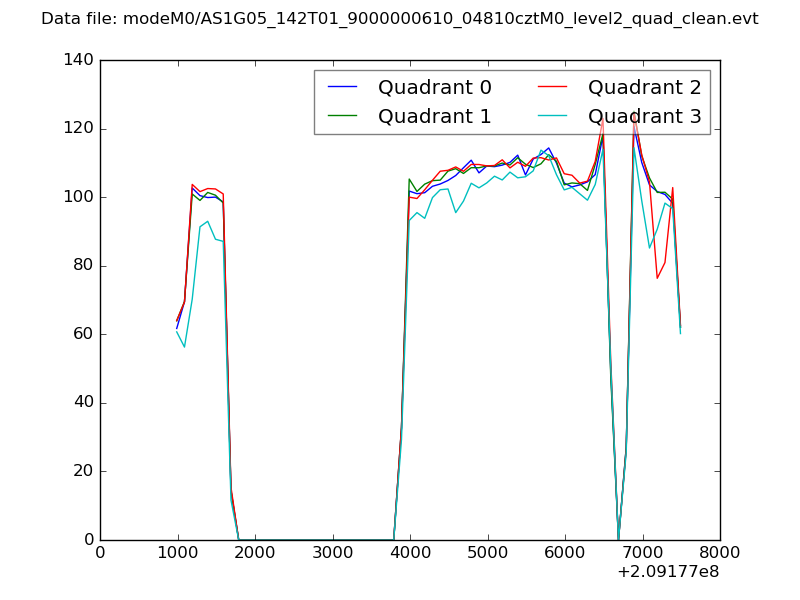 |
|
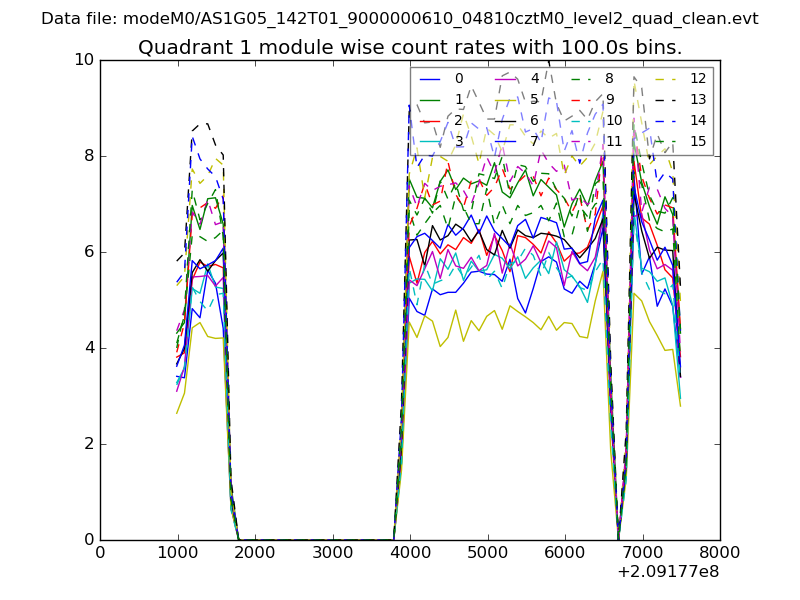
| Module-wise count rates for Quadrant A Data is divided into 100 sec bins |
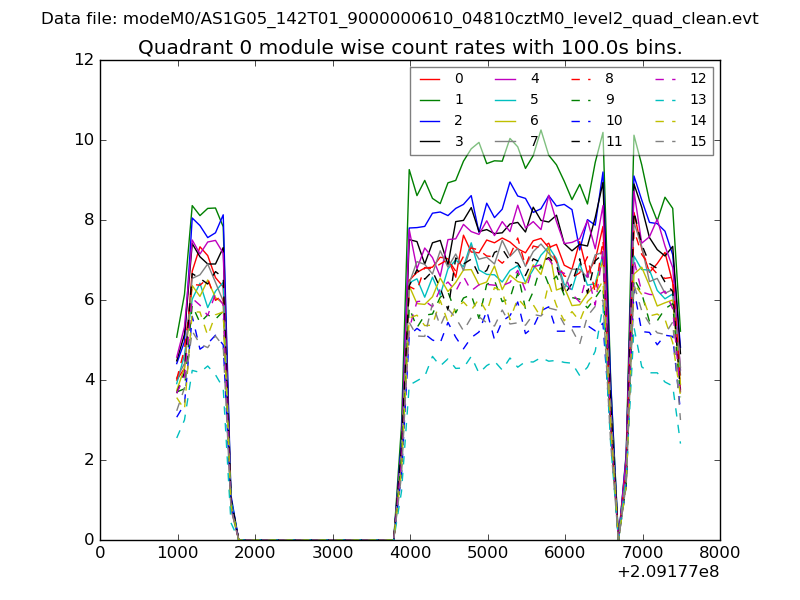 |
 |
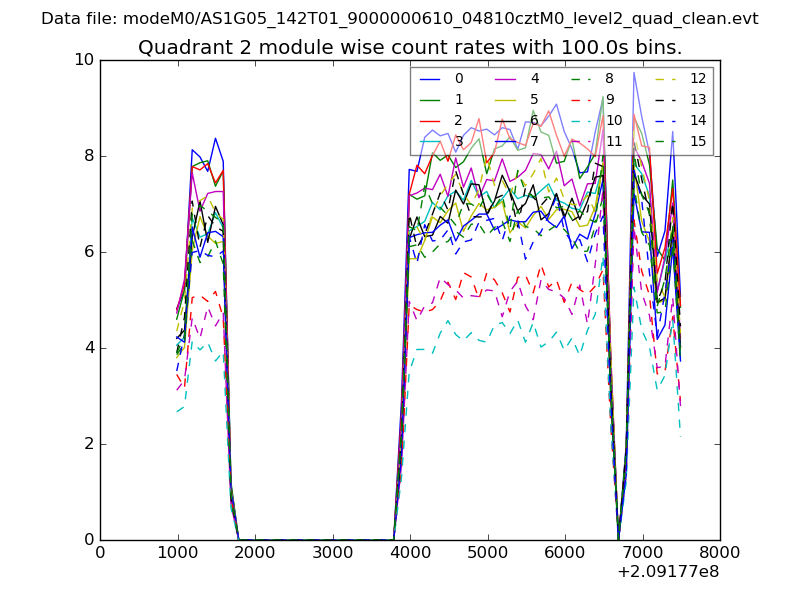
| Module-wise count rates for Quadrant B Data is divided into 100 sec bins |
 |
 |
| Module-wise count rates for Quadrant C Data is divided into 100 sec bins |
 |
 |
| Module-wise count rates for Quadrant D Data is divided into 100 sec bins |
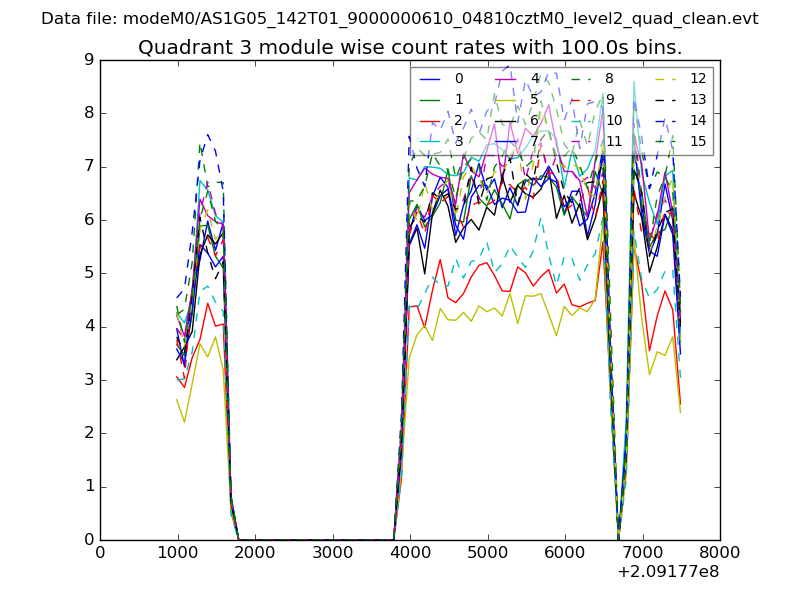 |
 |
| Parameter | Plot |
|---|---|
| CZT HV Monitor | 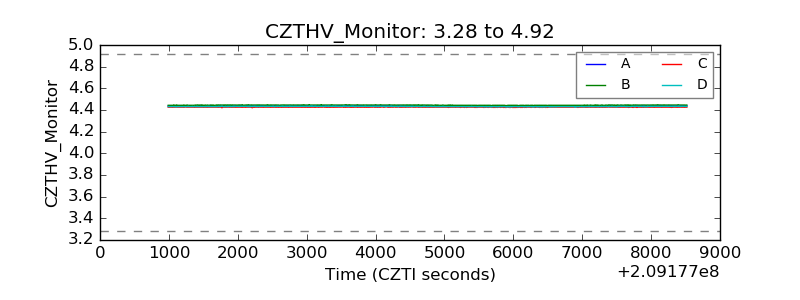 |
| D_VDD | 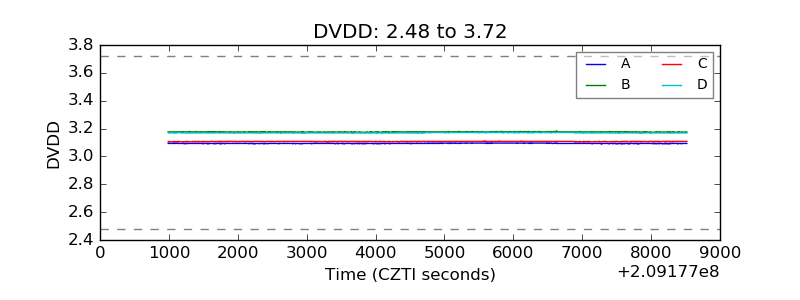 |
| Temperature 1 | 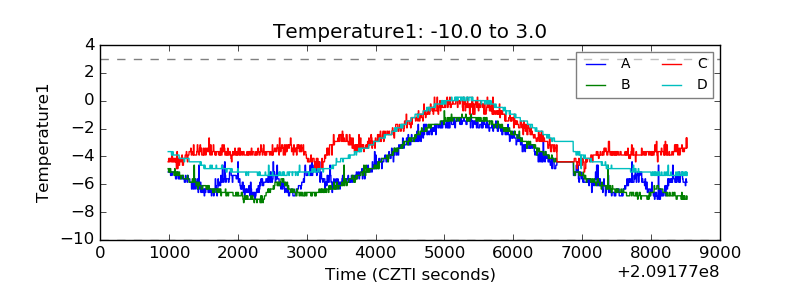 |
| Veto HV Monitor | 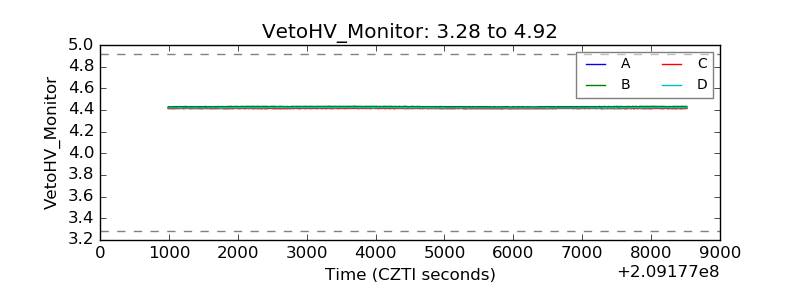 |
| Veto LLD | 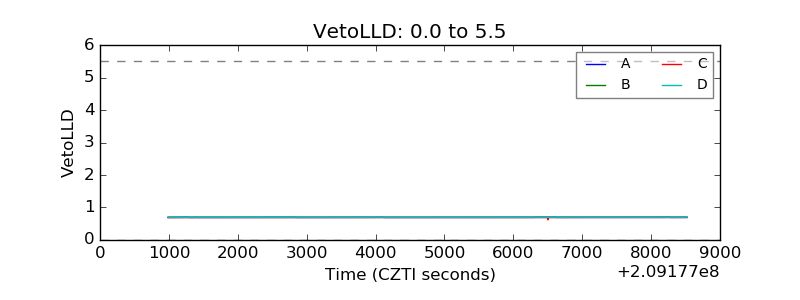 |
| Alpha Counter | 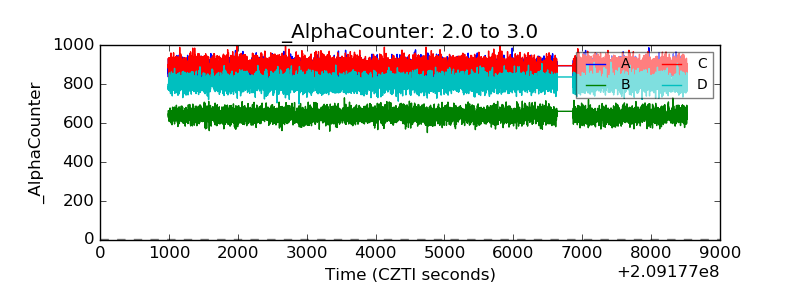 |
| _CPM_Rate | 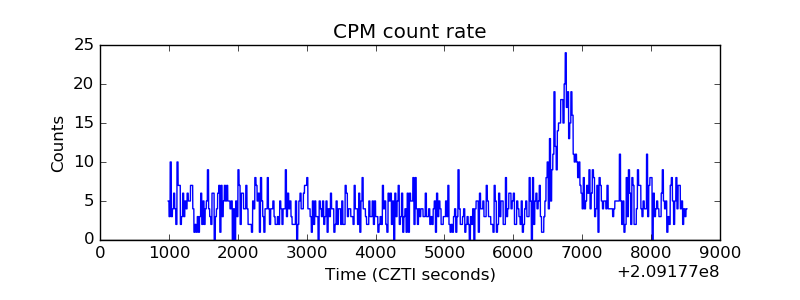 |
| CZT Counter | 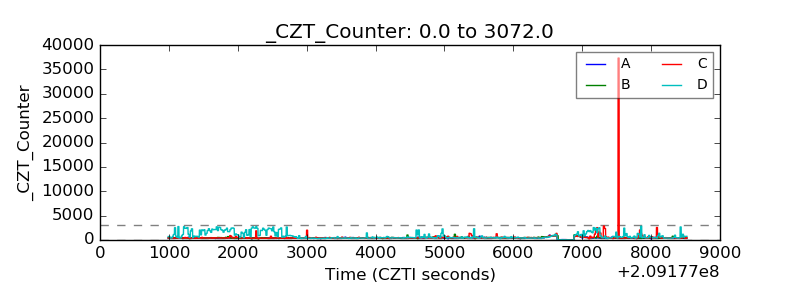 |
| +2.5 Volts monitor | 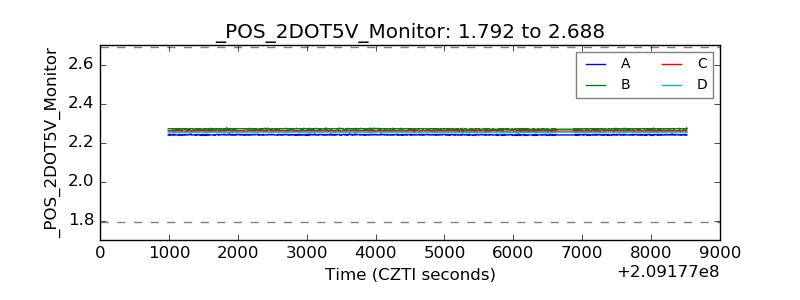 |
| +5 Volts monitor | 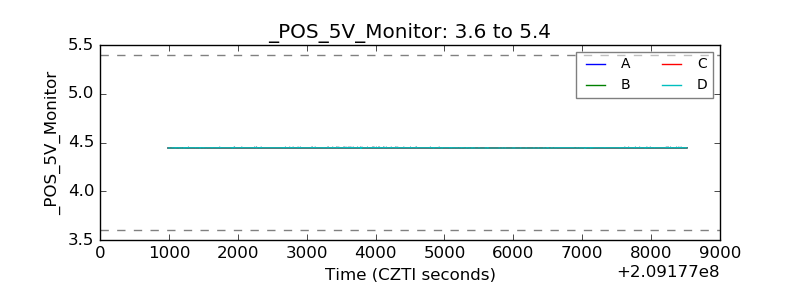 |
| _ROLL_ROT | 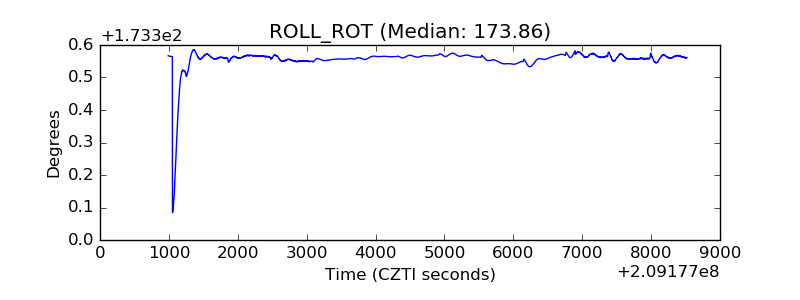 |
| _Roll_DEC | 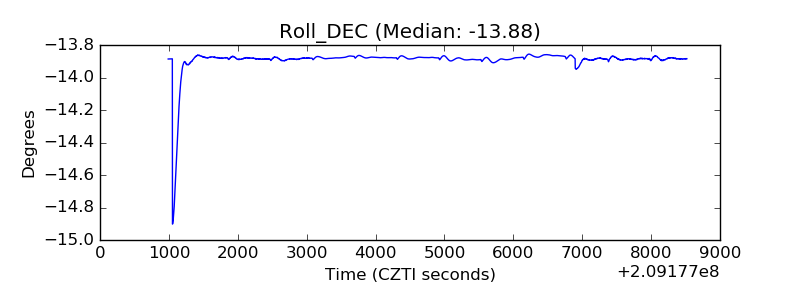 |
| _Roll_RA | 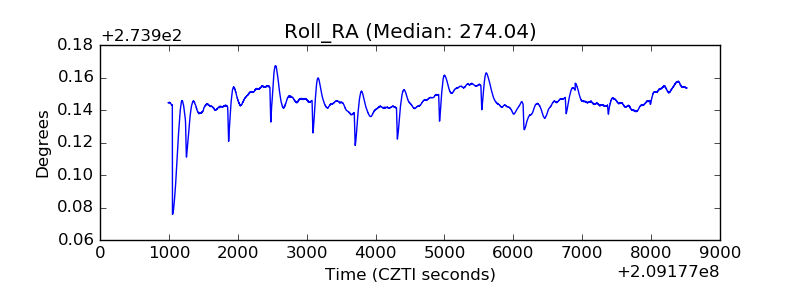 |
| Veto Counter | 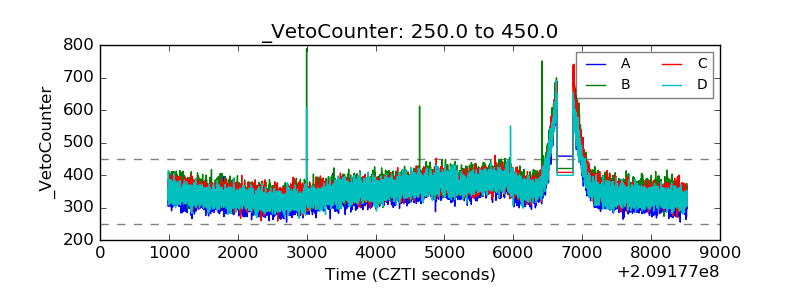 |