| Param | Original file | Final file |
|---|---|---|
| Filename | modeM0/AS1G05_142T01_9000000610_04815cztM0_level2.evt | modeM0/AS1G05_142T01_9000000610_04815cztM0_level2_quad_clean.evt |
| Size (bytes) | 474,347,520 | 74,036,160 |
| Size | 452.4 MB | 70.6 MB |
| Events in quadrant A | 3,798,526 | 440,967 |
| Events in quadrant B | 3,276,846 | 456,660 |
| Events in quadrant C | 2,938,416 | 459,460 |
| Events in quadrant D | 3,913,816 | 434,912 |
| Mode SS | |||
|---|---|---|---|
| Quadrant | BADHDUFLAG | Total packets | Discarded packets |
| A | 0 | 132 | 0 |
| B | 0 | 132 | 0 |
| C | 0 | 132 | 0 |
| D | 0 | 132 | 0 |
| Mode M9 | |||
|---|---|---|---|
| Quadrant | BADHDUFLAG | Total packets | Discarded packets |
| A | 0 | 10 | 0 |
| B | 0 | 10 | 0 |
| C | 0 | 10 | 0 |
| D | 0 | 10 | 0 |
| Mode M0 | |||
|---|---|---|---|
| Quadrant | BADHDUFLAG | Total packets | Discarded packets |
| A | 0 | 15517 | 1 |
| B | 0 | 13796 | 0 |
| C | 0 | 13143 | 0 |
| D | 0 | 16040 | 0 |
| Quadrant | Total seconds | Saturated seconds | Saturation percentage |
|---|---|---|---|
| A | 6443 | 344 | 5.339128% |
| B | 6443 | 83 | 1.288220% |
| C | 6443 | 40 | 0.620829% |
| D | 6443 | 199 | 3.088623% |
Noise dominated data is calculated using 1-second bins in cleaned event files. If a bin has >2000 counts, and if more than 50% of those come from <1% of pixels, then it is considered to be noise-dominated and hence unusable.
| Quadrant | # 1 sec bins | Bins with >0 counts | Bins with >2000 counts | High rate bins dominated by noise | Noise dominated (total time) | Noise dominated (detector-on time) | Marked lightcurve |
|---|---|---|---|---|---|---|---|
| A | 7433 | 6443 | 213 | 213 | 2.87% | 3.31% | 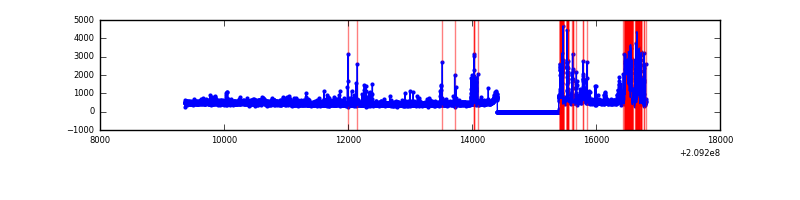 |
| B | 7433 | 6443 | 26 | 26 | 0.35% | 0.40% | 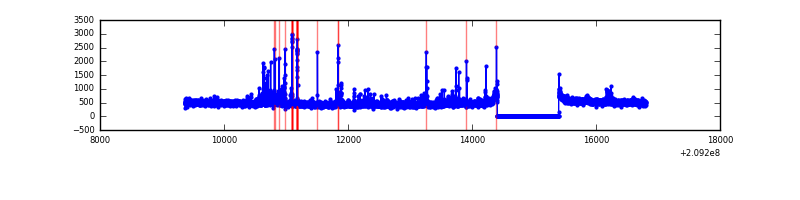 |
| C | 7433 | 6444 | 0 | 0 | 0.00% | 0.00% | 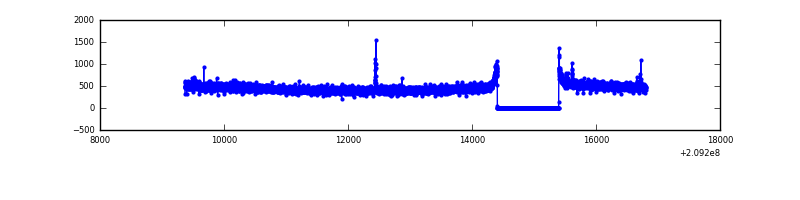 |
| D | 7433 | 6443 | 122 | 122 | 1.64% | 1.89% | 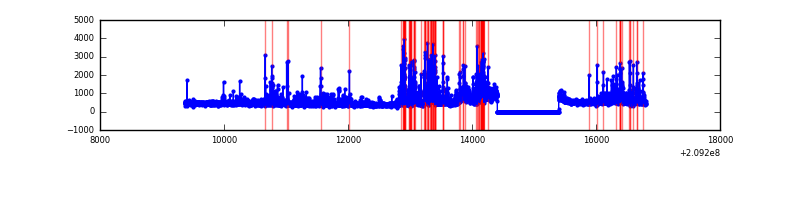 |
Top three noisy pixels from each quadrant. If the there are fewer than three noisy pixels in the level2.evt file, extra rows are filled as -1
| Pixel properties | Quadrant properties | ||||||
|---|---|---|---|---|---|---|---|
| Quadrant | DetID | PixID | Counts | Sigma | Mean | Median | Sigma |
| A | 13 | 251 | 766551 | 4923.19 | 755 | 739 | 155.6 |
| A | 8 | 15 | 104754 | 668.68 | 755 | 739 | 155.6 |
| A | 13 | 6 | 12264 | 74.09 | 755 | 739 | 155.6 |
| B | 10 | 16 | 160111 | 1060.27 | 775 | 757 | 150.3 |
| B | 15 | 54 | 58588 | 384.78 | 775 | 757 | 150.3 |
| B | 4 | 80 | 48928 | 320.51 | 775 | 757 | 150.3 |
| C | 12 | 4 | 14172 | 77.91 | 746 | 751 | 172.3 |
| C | 9 | 247 | 10199 | 54.84 | 746 | 751 | 172.3 |
| C | 13 | 61 | 6093 | 31.01 | 746 | 751 | 172.3 |
| D | 13 | 235 | 462543 | 2568.44 | 740 | 717 | 179.8 |
| D | 12 | 79 | 148831 | 823.73 | 740 | 717 | 179.8 |
| D | 10 | 172 | 134601 | 744.59 | 740 | 717 | 179.8 |
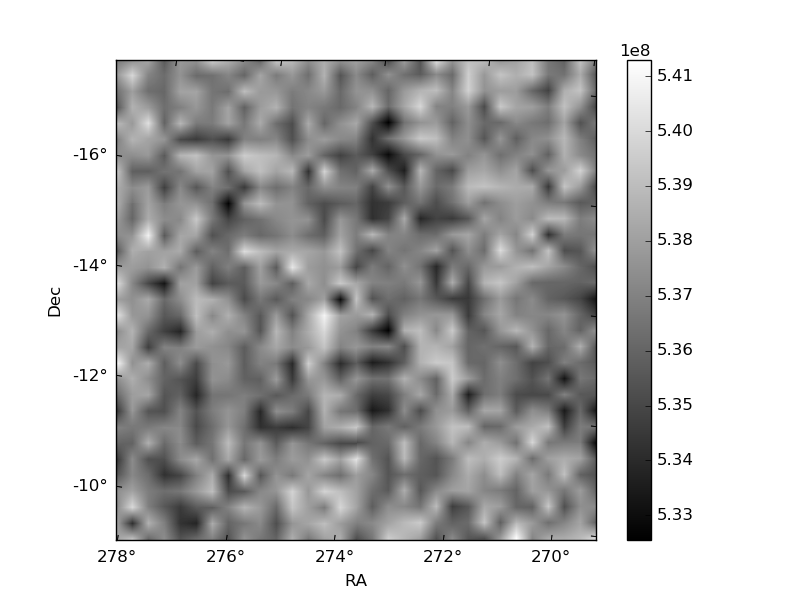
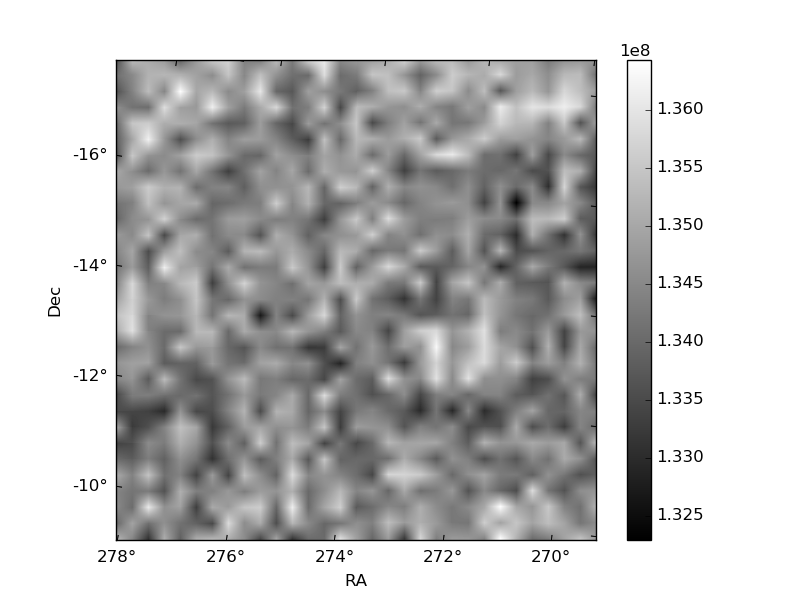
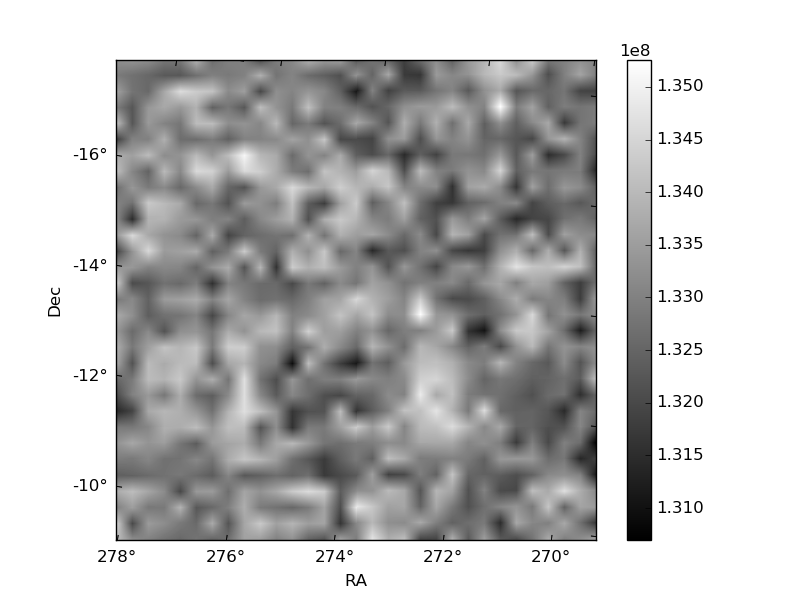
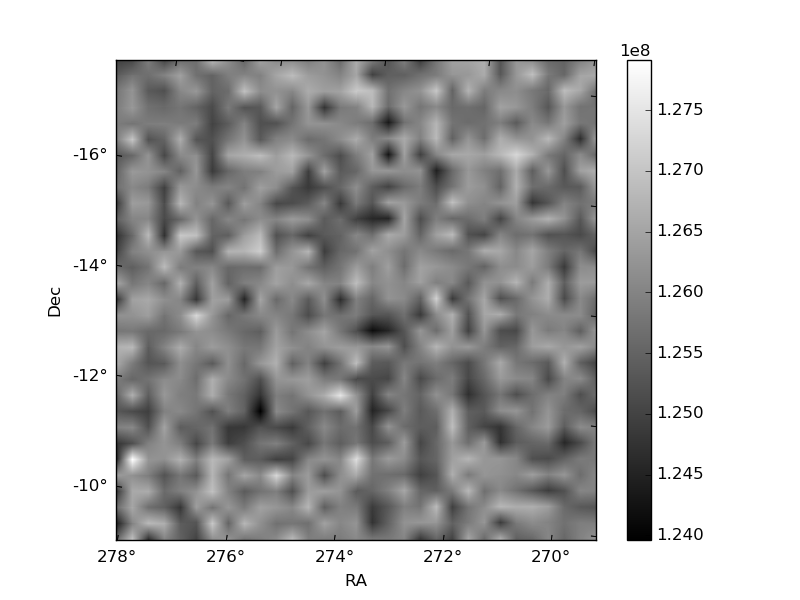
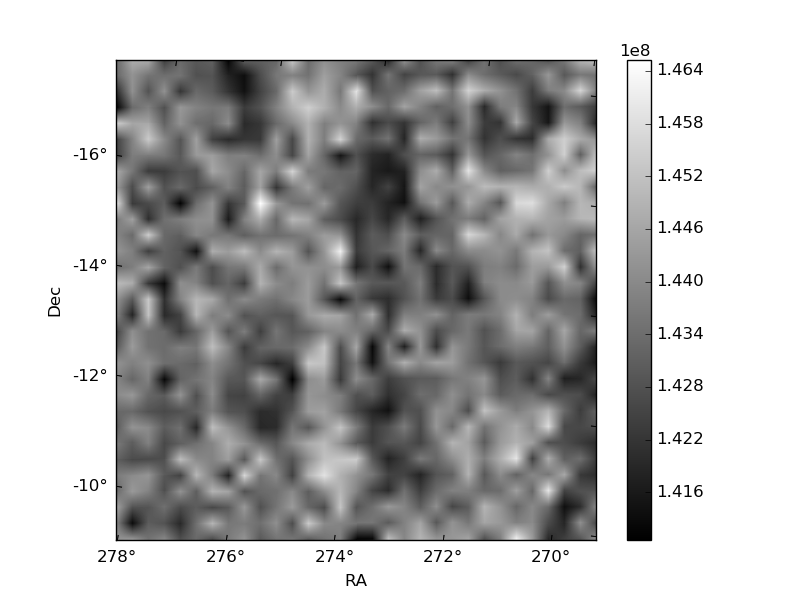
Histogram calculated using DETX and DETY for each event in the final _common_clean file
| Quadrant A | 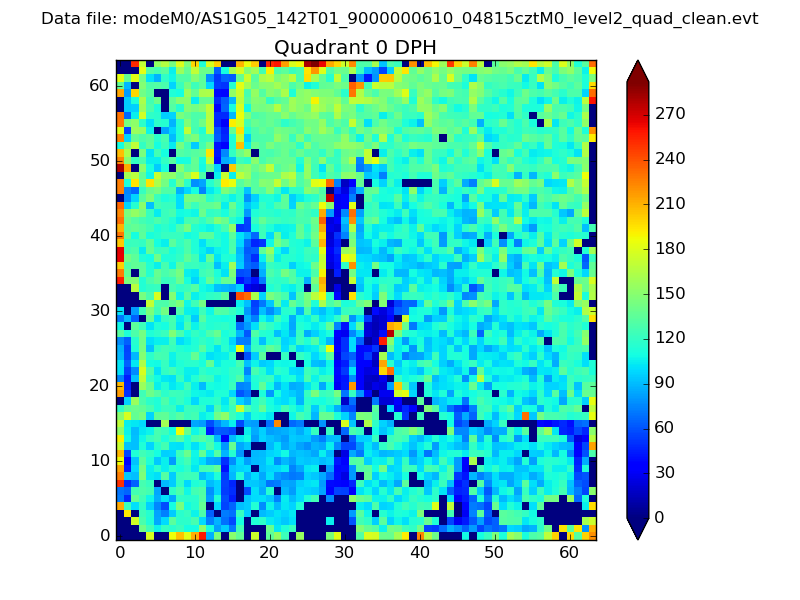 |
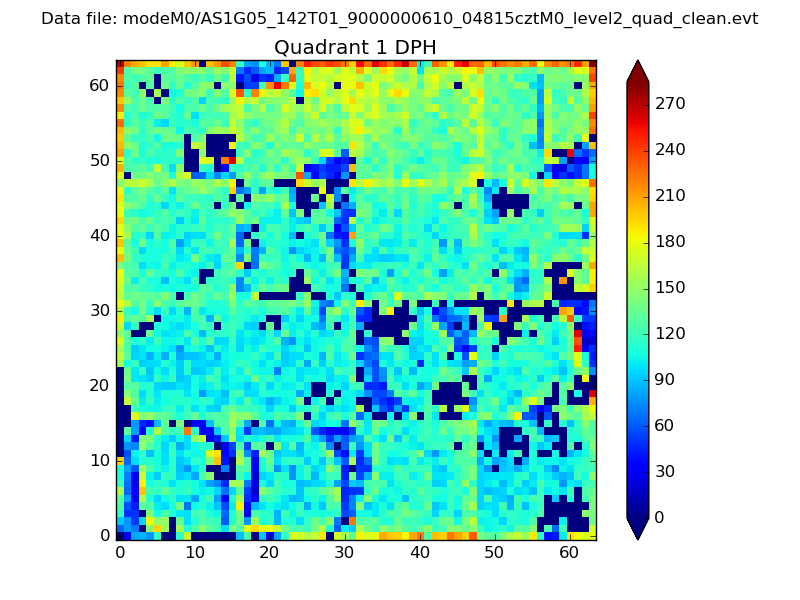 |
Quadrant B |
|---|---|---|---|
| Quadrant D | 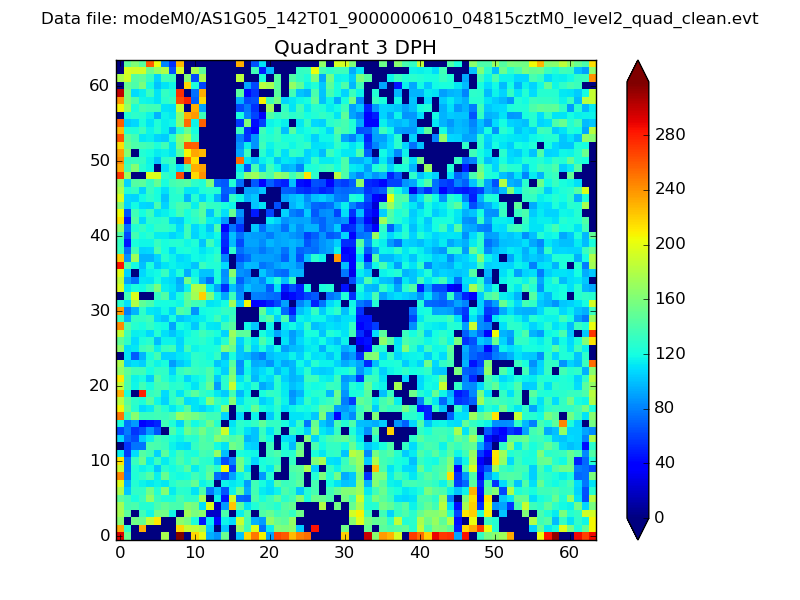 |
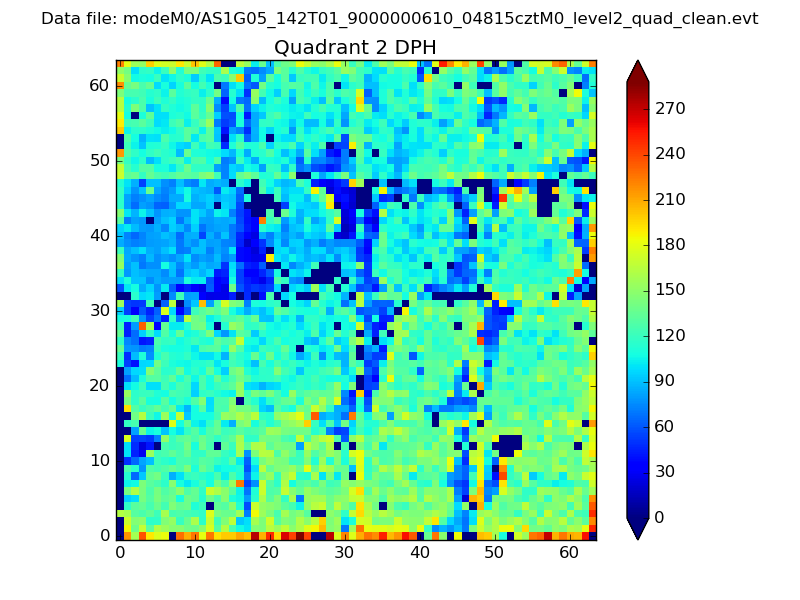 |
Quadrant C |
| Plot type | Count rate plots | Images |
|---|---|---|
| Comparison with Poisson distribution Blue bars denote a histogram of data divided into 1 sec bins. Red curve is a Poisson curve with rate = median count rate of data. |
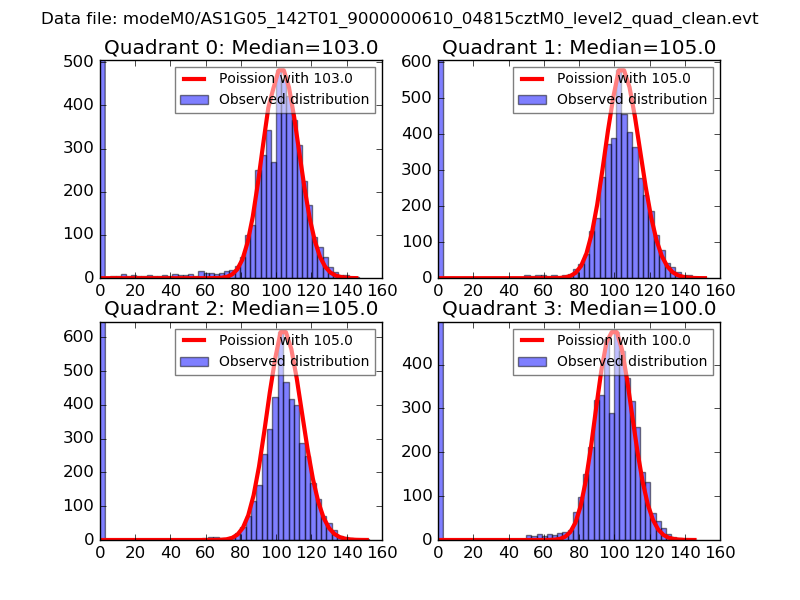 |
 |
| Quadrant-wise count rates Data is divided into 100 sec bins |
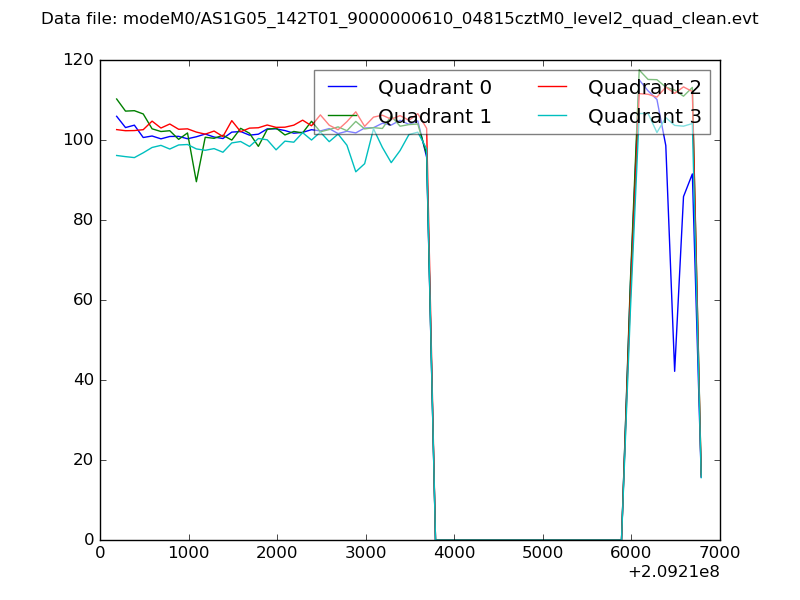 |
|
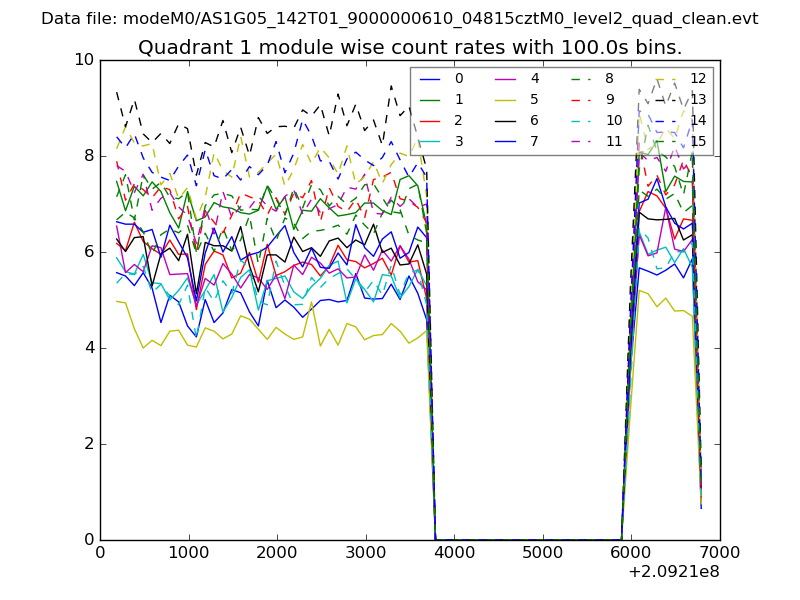
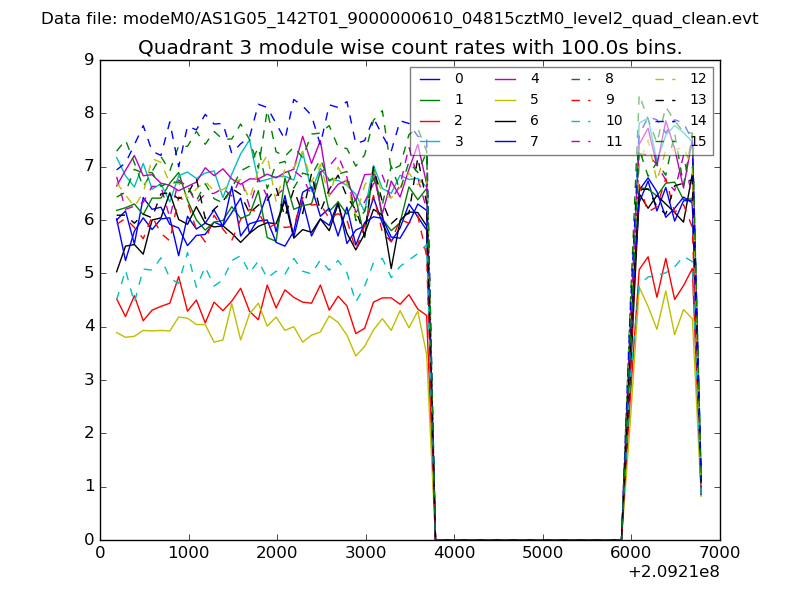
| Module-wise count rates for Quadrant A Data is divided into 100 sec bins |
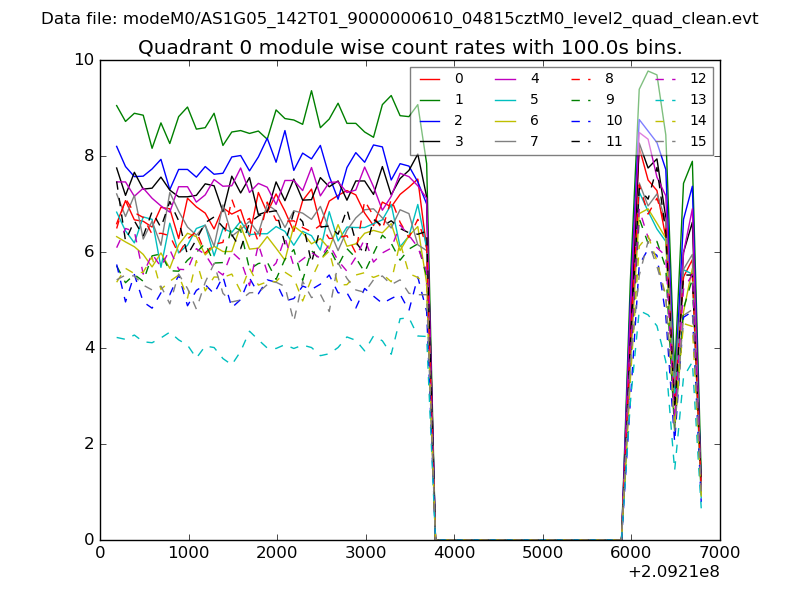 |
 |
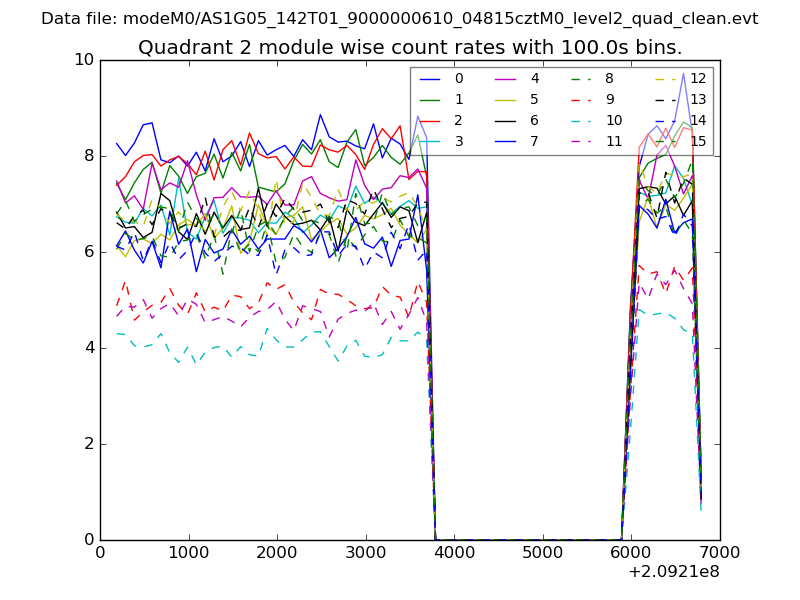
| Module-wise count rates for Quadrant B Data is divided into 100 sec bins |
 |
 |
| Module-wise count rates for Quadrant C Data is divided into 100 sec bins |
 |
 |
| Module-wise count rates for Quadrant D Data is divided into 100 sec bins |
 |
 |
| Parameter | Plot |
|---|---|
| CZT HV Monitor | 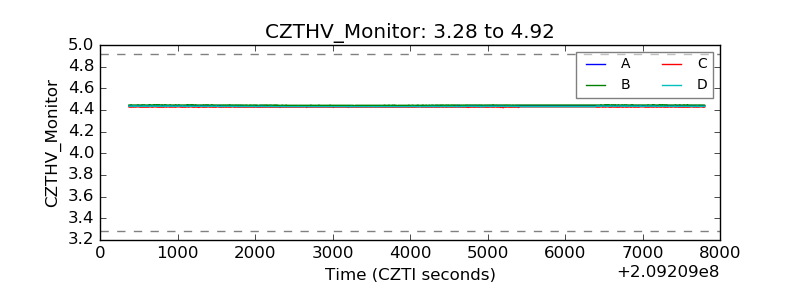 |
| D_VDD | 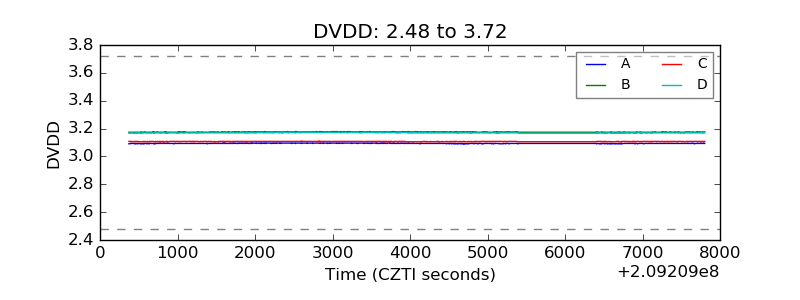 |
| Temperature 1 | 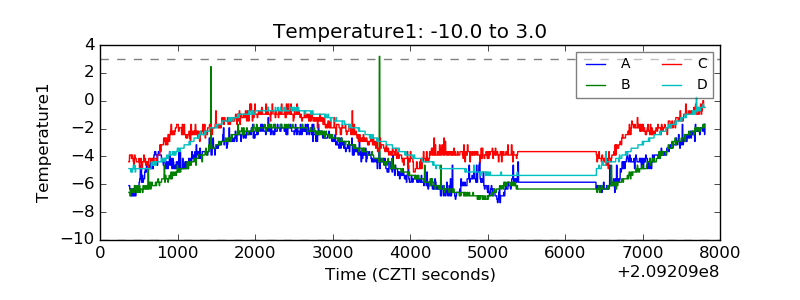 |
| Veto HV Monitor | 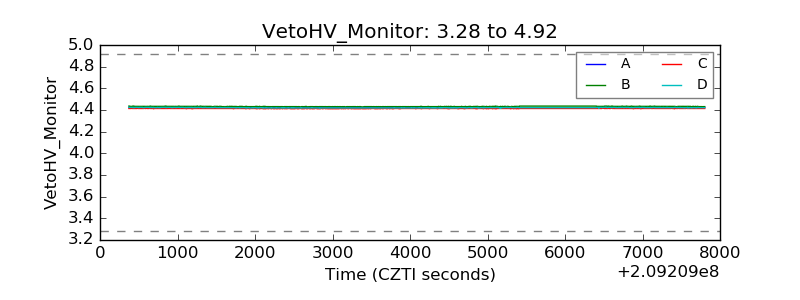 |
| Veto LLD | 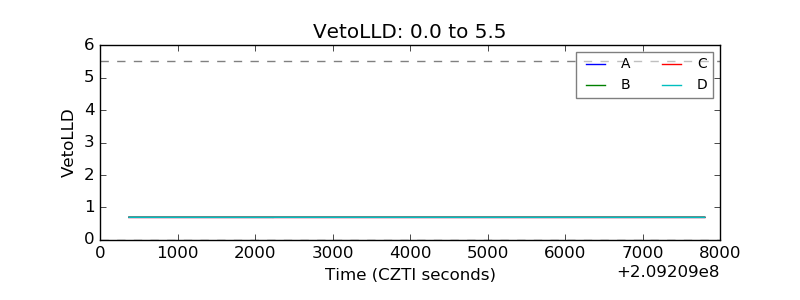 |
| Alpha Counter | 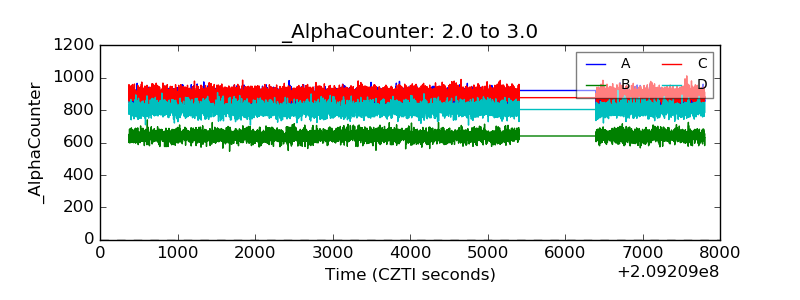 |
| _CPM_Rate | 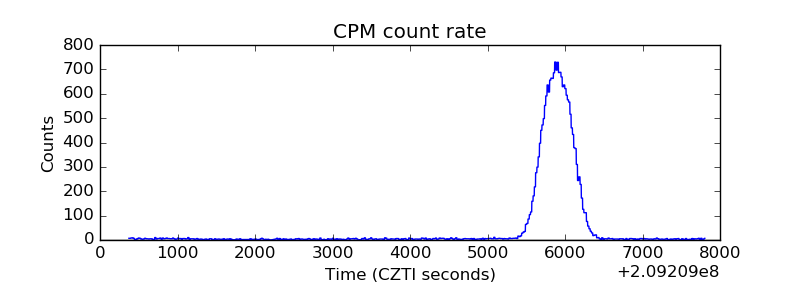 |
| CZT Counter | 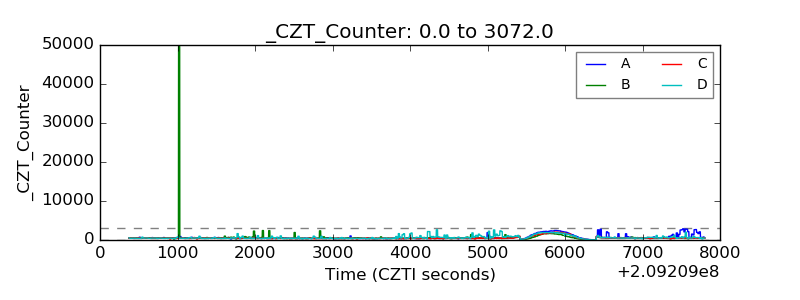 |
| +2.5 Volts monitor |  |
| +5 Volts monitor | 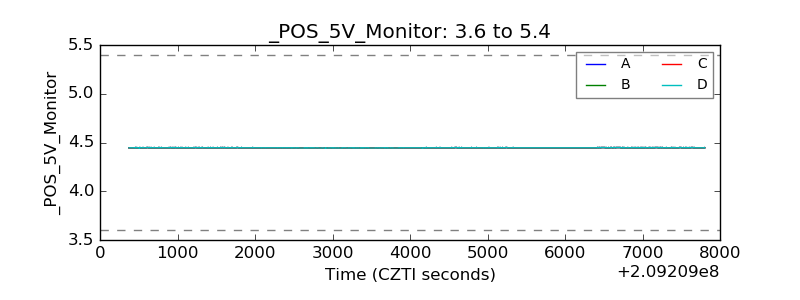 |
| _ROLL_ROT | 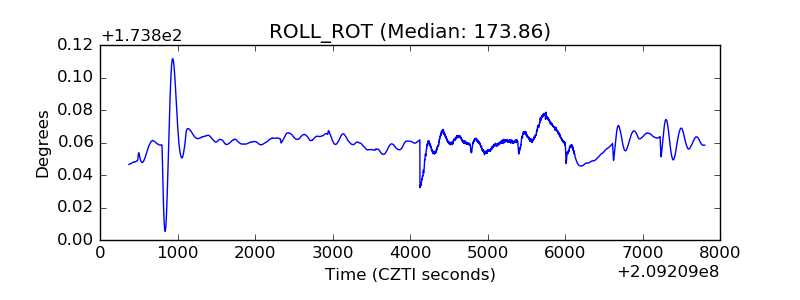 |
| _Roll_DEC | 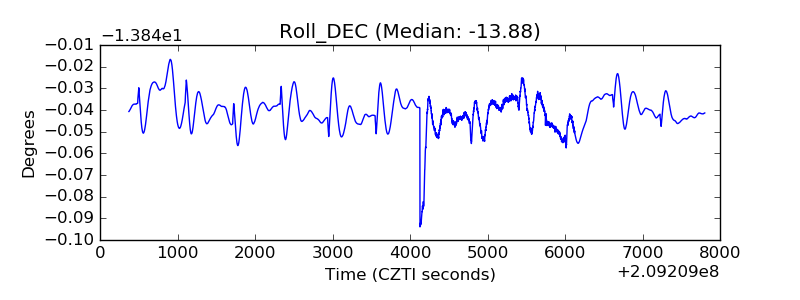 |
| _Roll_RA | 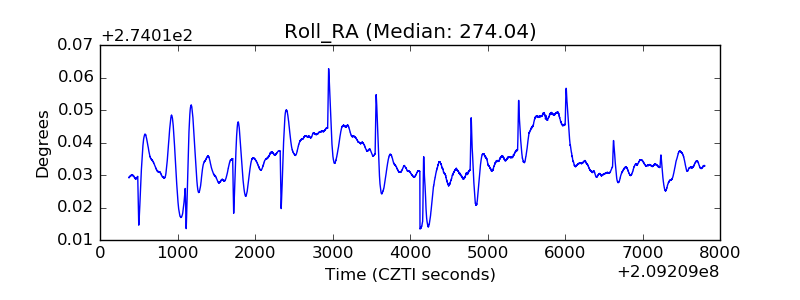 |
| Veto Counter | 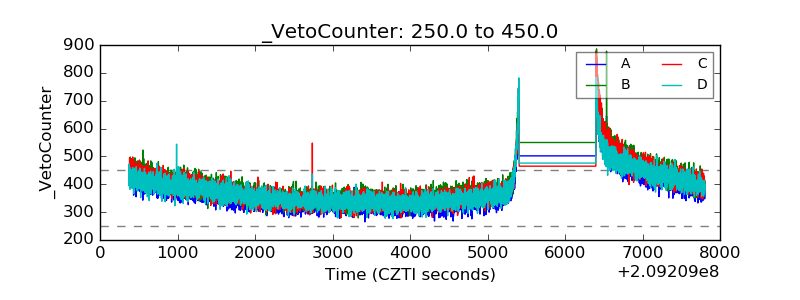 |