| Param | Original file | Final file |
|---|---|---|
| Filename | modeM0/AS1G05_142T01_9000000610_04817cztM0_level2.evt | modeM0/AS1G05_142T01_9000000610_04817cztM0_level2_quad_clean.evt |
| Size (bytes) | 505,584,000 | 82,255,680 |
| Size | 482.2 MB | 78.4 MB |
| Events in quadrant A | 4,190,602 | 502,131 |
| Events in quadrant B | 3,525,702 | 524,618 |
| Events in quadrant C | 2,921,203 | 531,464 |
| Events in quadrant D | 4,255,647 | 502,111 |
| Mode SS | |||
|---|---|---|---|
| Quadrant | BADHDUFLAG | Total packets | Discarded packets |
| A | 0 | 124 | 0 |
| B | 0 | 124 | 0 |
| C | 0 | 124 | 0 |
| D | 0 | 124 | 0 |
| Mode M9 | |||
|---|---|---|---|
| Quadrant | BADHDUFLAG | Total packets | Discarded packets |
| A | 0 | 12 | 0 |
| B | 0 | 12 | 0 |
| C | 0 | 12 | 0 |
| D | 0 | 12 | 0 |
| Mode M0 | |||
|---|---|---|---|
| Quadrant | BADHDUFLAG | Total packets | Discarded packets |
| A | 0 | 16459 | 2 |
| B | 0 | 14468 | 1 |
| C | 0 | 12854 | 1 |
| D | 0 | 16789 | 1 |
| Quadrant | Total seconds | Saturated seconds | Saturation percentage |
|---|---|---|---|
| A | 6167 | 495 | 8.026593% |
| B | 6167 | 137 | 2.221502% |
| C | 6167 | 56 | 0.908059% |
| D | 6167 | 307 | 4.978109% |
Noise dominated data is calculated using 1-second bins in cleaned event files. If a bin has >2000 counts, and if more than 50% of those come from <1% of pixels, then it is considered to be noise-dominated and hence unusable.
| Quadrant | # 1 sec bins | Bins with >0 counts | Bins with >2000 counts | High rate bins dominated by noise | Noise dominated (total time) | Noise dominated (detector-on time) | Marked lightcurve |
|---|---|---|---|---|---|---|---|
| A | 7307 | 6167 | 318 | 318 | 4.35% | 5.16% | 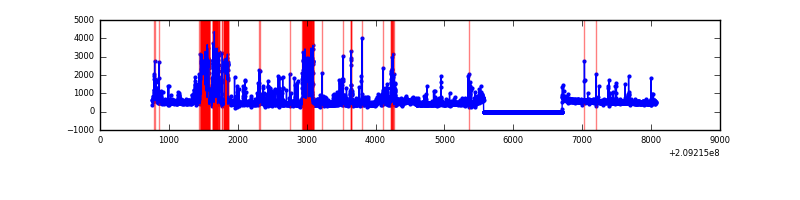 |
| B | 7307 | 6167 | 82 | 82 | 1.12% | 1.33% | 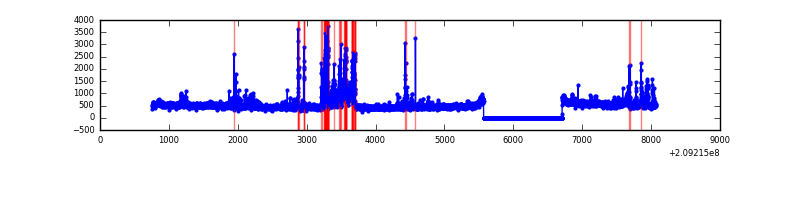 |
| C | 7307 | 6168 | 14 | 14 | 0.19% | 0.23% | 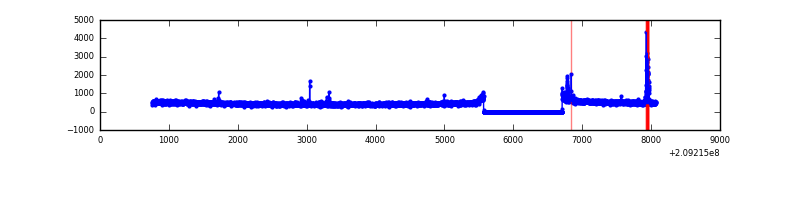 |
| D | 7307 | 6168 | 243 | 243 | 3.33% | 3.94% | 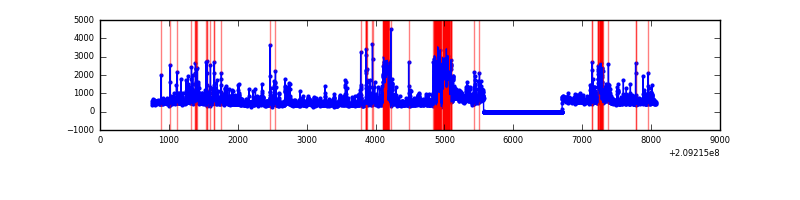 |
Top three noisy pixels from each quadrant. If the there are fewer than three noisy pixels in the level2.evt file, extra rows are filled as -1
| Pixel properties | Quadrant properties | ||||||
|---|---|---|---|---|---|---|---|
| Quadrant | DetID | PixID | Counts | Sigma | Mean | Median | Sigma |
| A | 13 | 251 | 1094890 | 7313.52 | 726 | 713 | 149.6 |
| A | 15 | 249 | 101358 | 672.72 | 726 | 713 | 149.6 |
| A | 0 | 50 | 100236 | 665.22 | 726 | 713 | 149.6 |
| B | 10 | 16 | 482143 | 3333.61 | 747 | 728 | 144.4 |
| B | 4 | 80 | 106043 | 729.26 | 747 | 728 | 144.4 |
| B | 15 | 54 | 25029 | 168.27 | 747 | 728 | 144.4 |
| C | 9 | 247 | 86565 | 512.35 | 723 | 727 | 167.5 |
| C | 13 | 61 | 5945 | 31.15 | 723 | 727 | 167.5 |
| C | 12 | 4 | 5634 | 29.29 | 723 | 727 | 167.5 |
| D | 13 | 235 | 872401 | 5055.66 | 714 | 695 | 172.4 |
| D | 2 | 136 | 244151 | 1411.98 | 714 | 695 | 172.4 |
| D | 12 | 79 | 161217 | 930.98 | 714 | 695 | 172.4 |
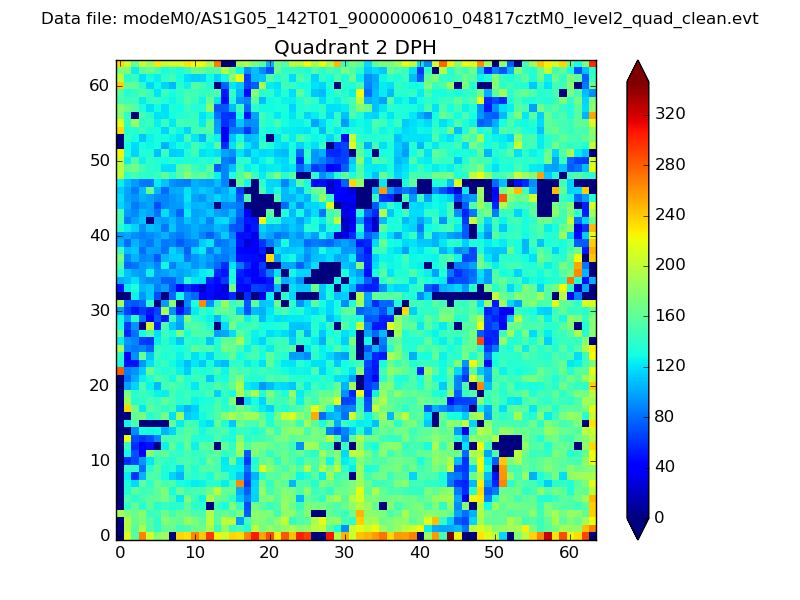
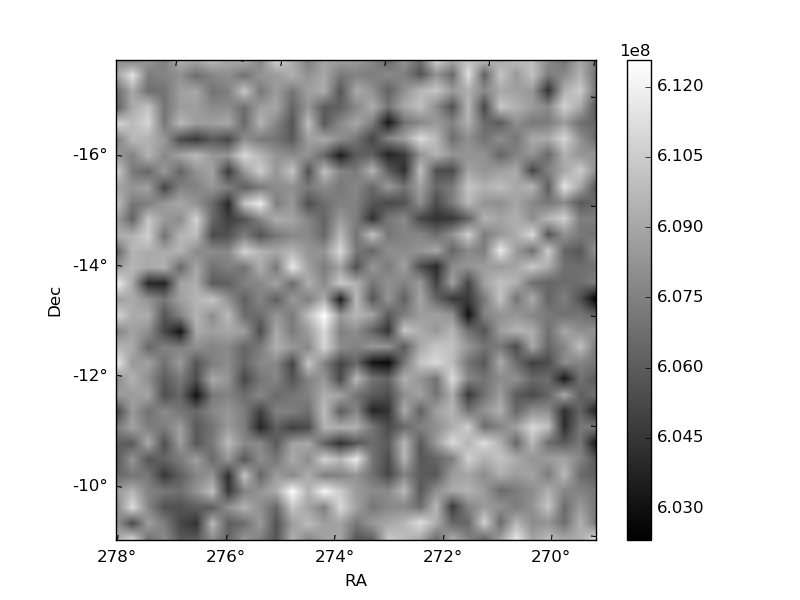
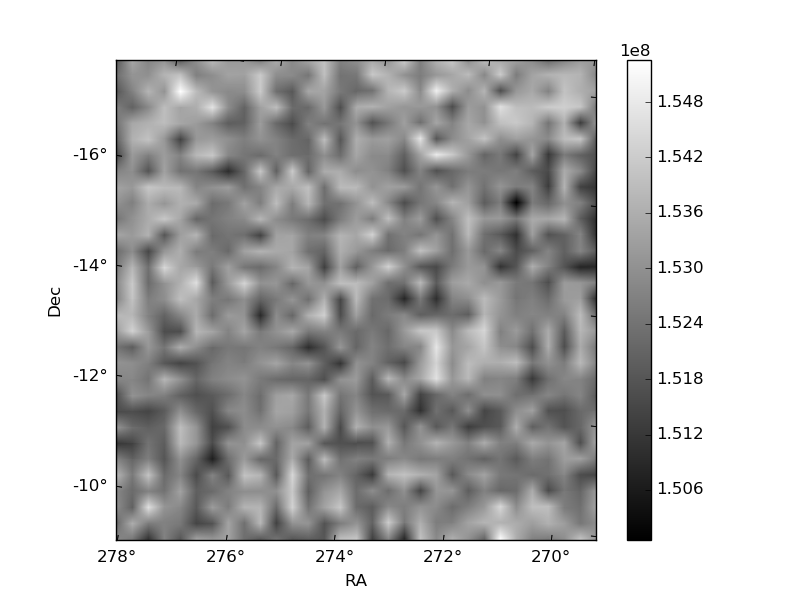
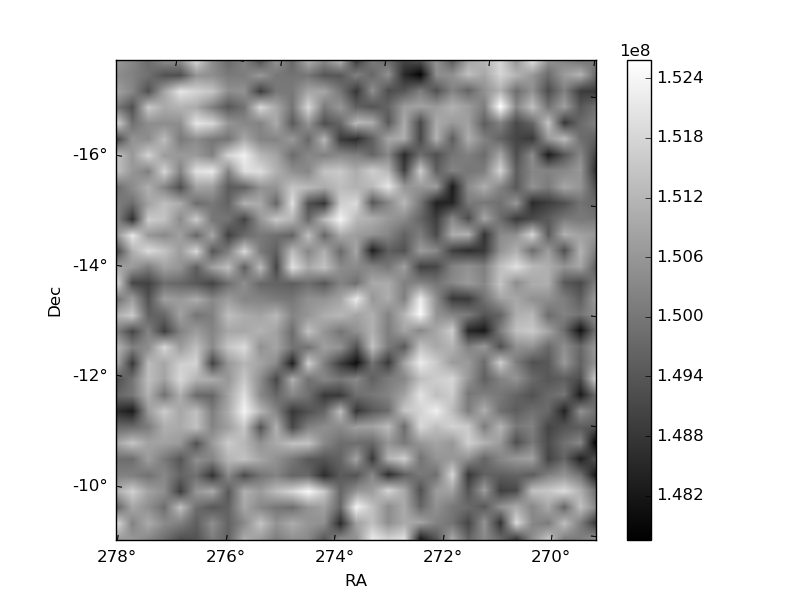
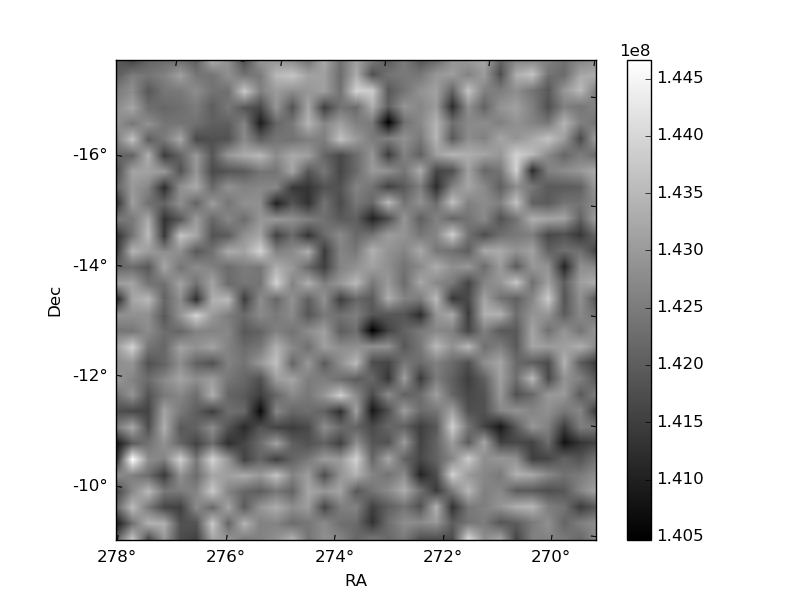
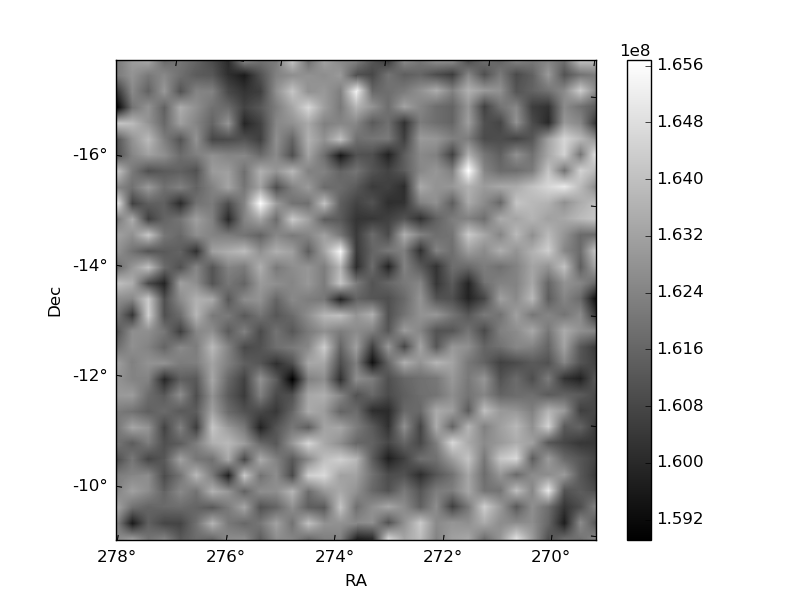
Histogram calculated using DETX and DETY for each event in the final _common_clean file
| Quadrant A | 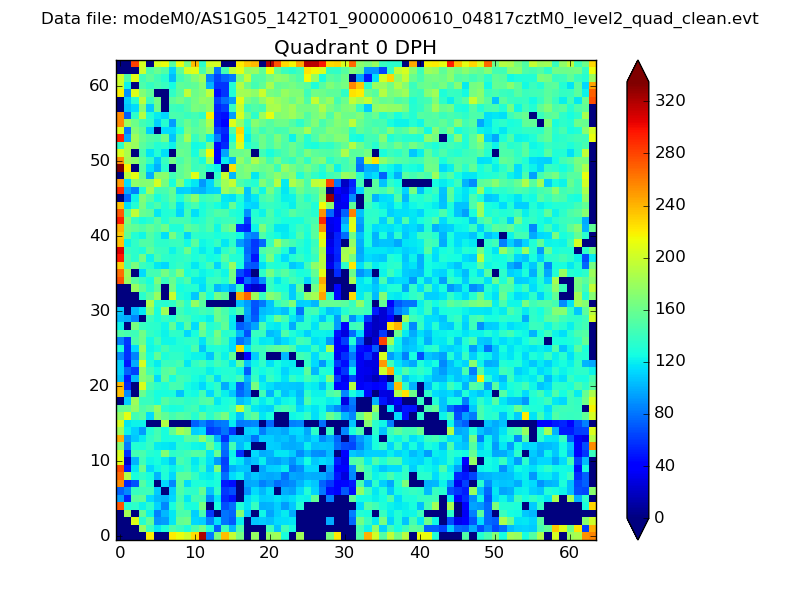 |
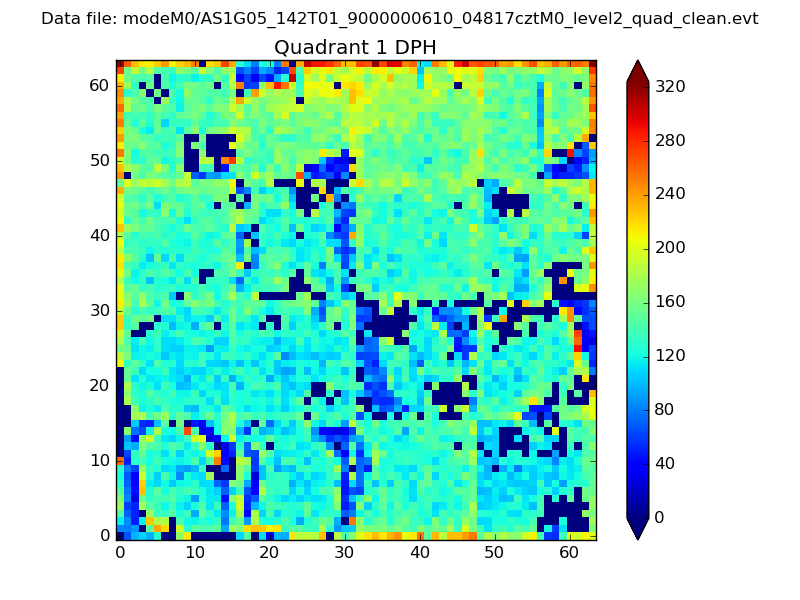 |
Quadrant B |
|---|---|---|---|
| Quadrant D | 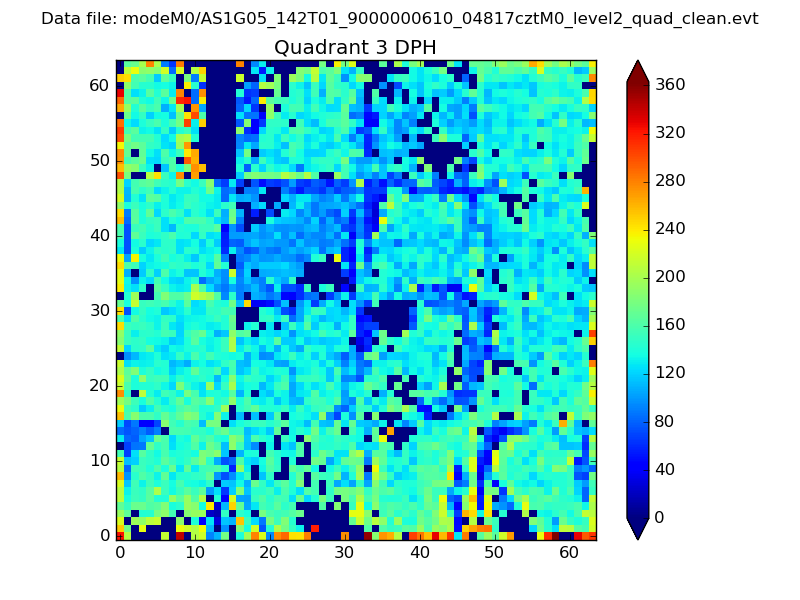 |
 |
Quadrant C |
| Plot type | Count rate plots | Images |
|---|---|---|
| Comparison with Poisson distribution Blue bars denote a histogram of data divided into 1 sec bins. Red curve is a Poisson curve with rate = median count rate of data. |
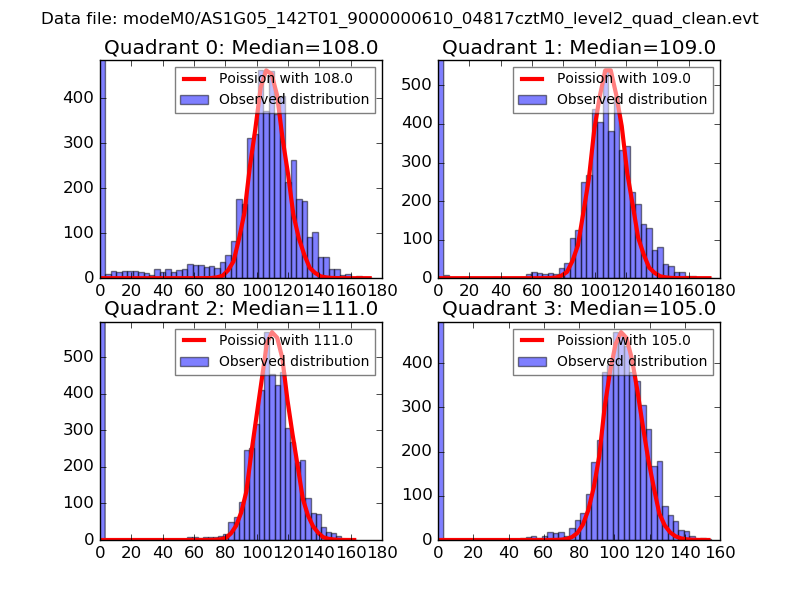 |
 |
| Quadrant-wise count rates Data is divided into 100 sec bins |
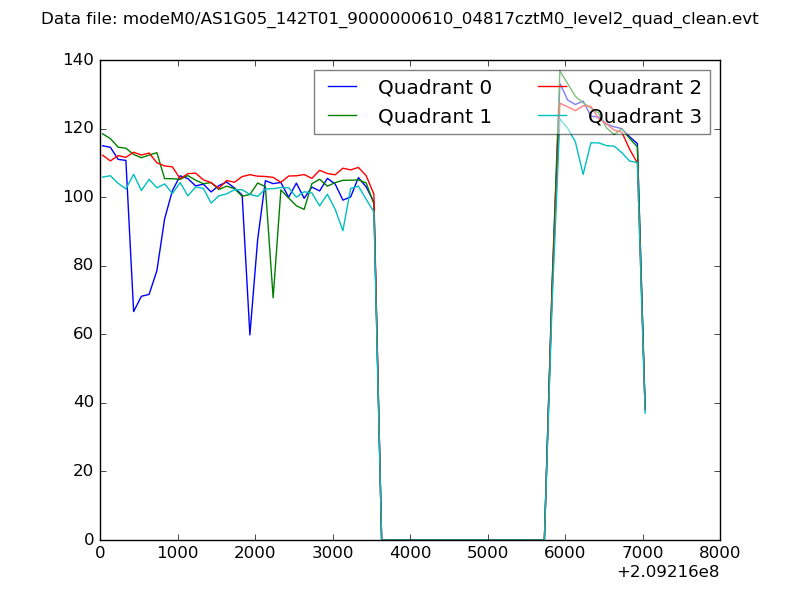 |
|
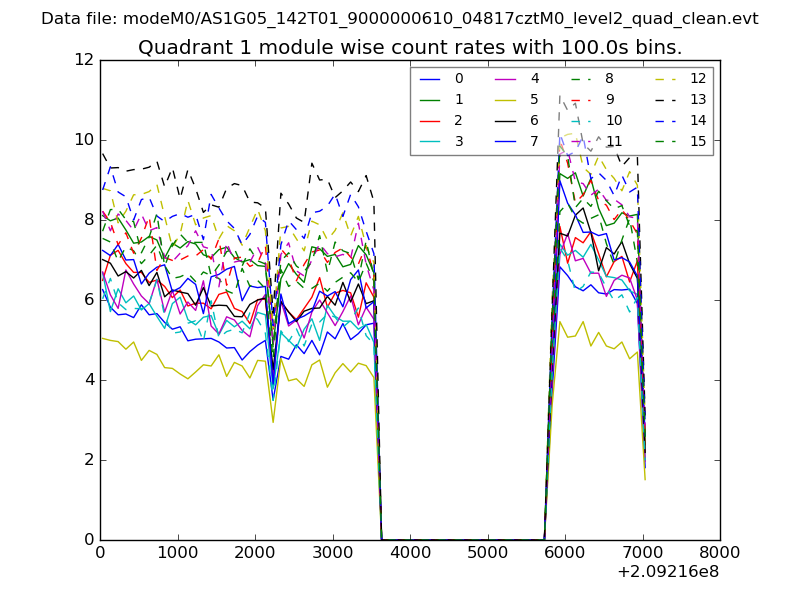
| Module-wise count rates for Quadrant A Data is divided into 100 sec bins |
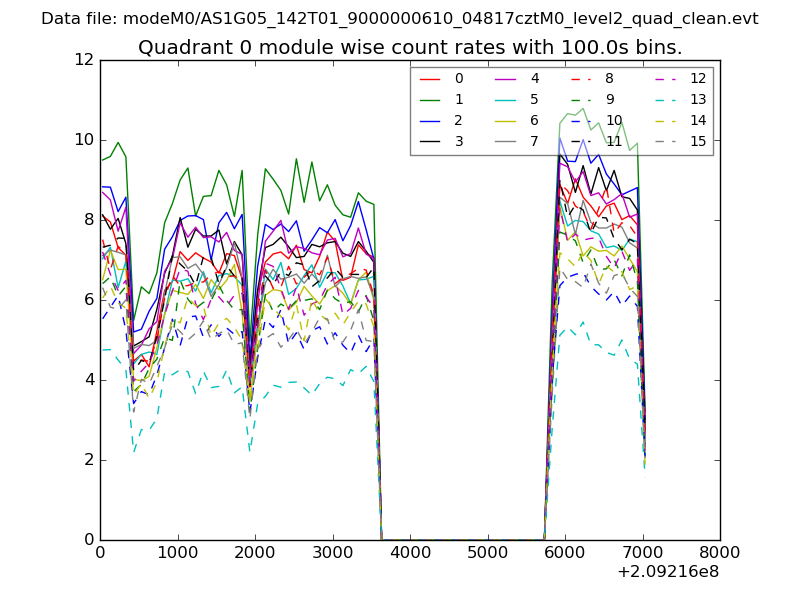 |
 |
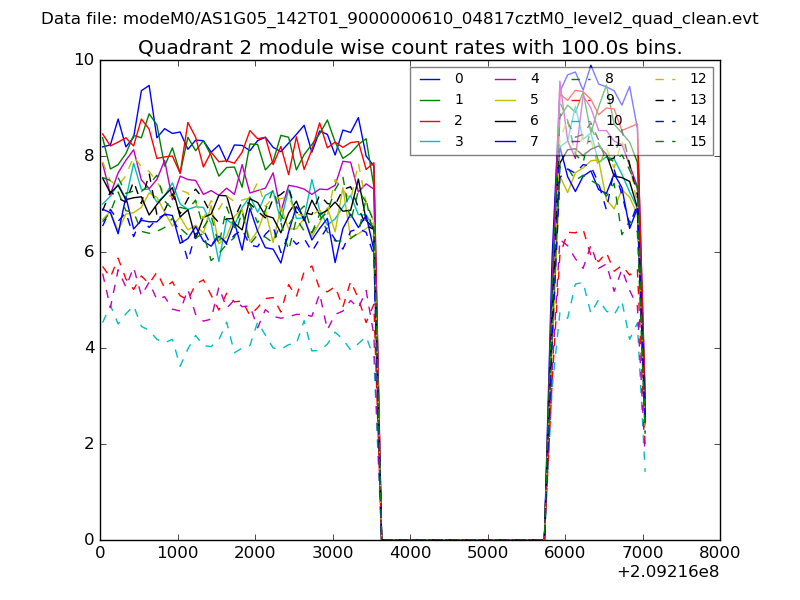
| Module-wise count rates for Quadrant B Data is divided into 100 sec bins |
 |
 |
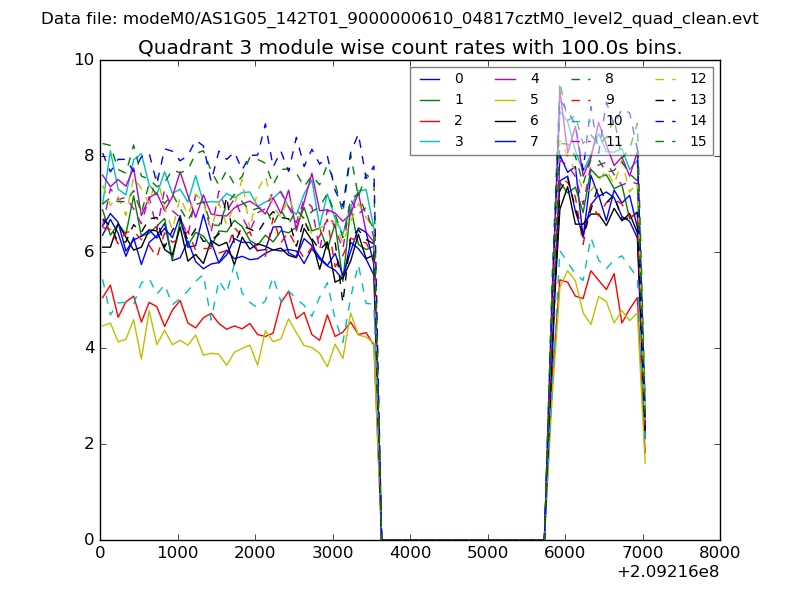
| Module-wise count rates for Quadrant C Data is divided into 100 sec bins |
 |
 |
| Module-wise count rates for Quadrant D Data is divided into 100 sec bins |
 |
 |
| Parameter | Plot |
|---|---|
| CZT HV Monitor | 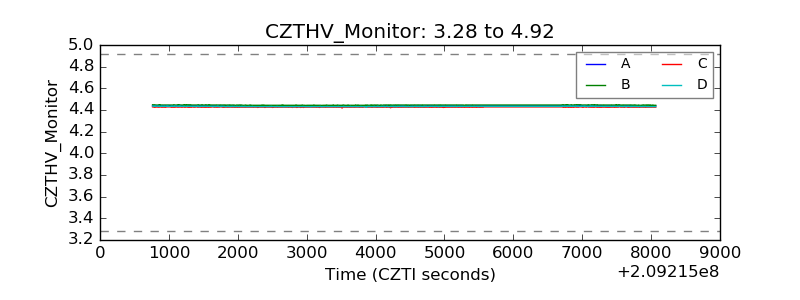 |
| D_VDD | 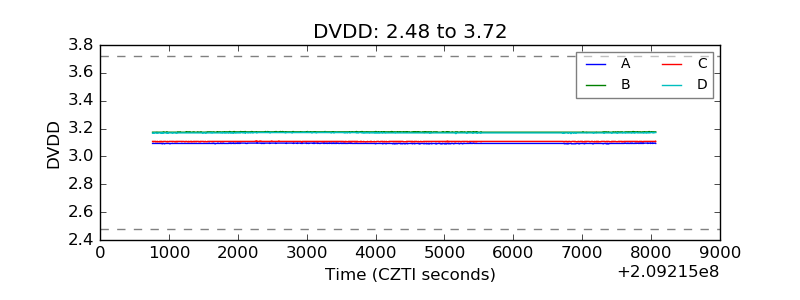 |
| Temperature 1 | 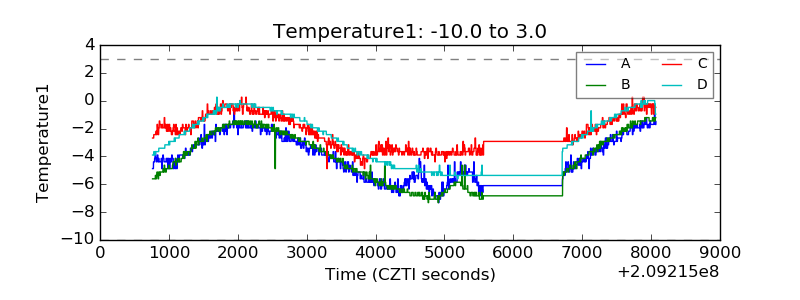 |
| Veto HV Monitor | 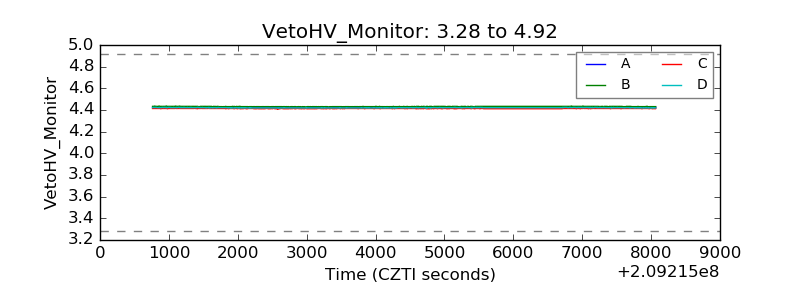 |
| Veto LLD | 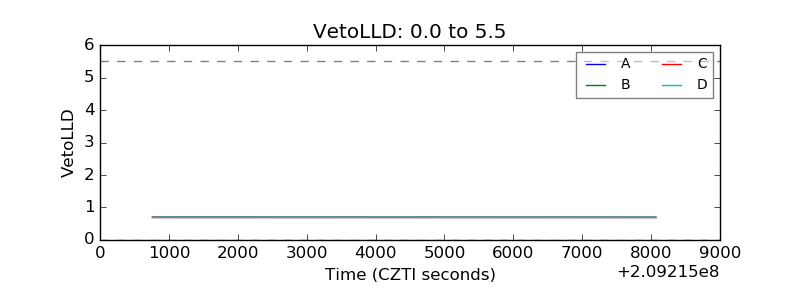 |
| Alpha Counter | 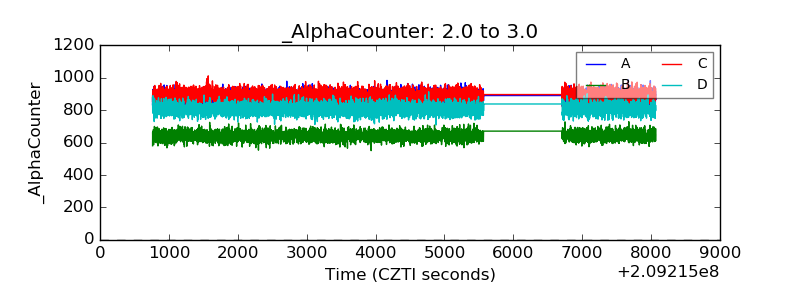 |
| _CPM_Rate | 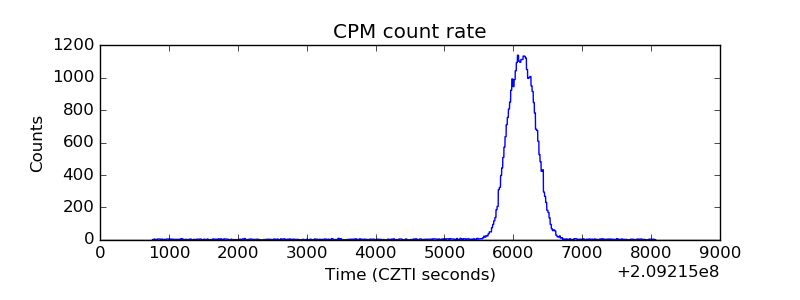 |
| CZT Counter | 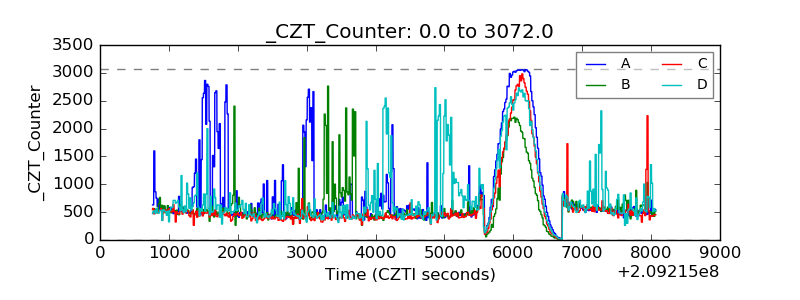 |
| +2.5 Volts monitor | 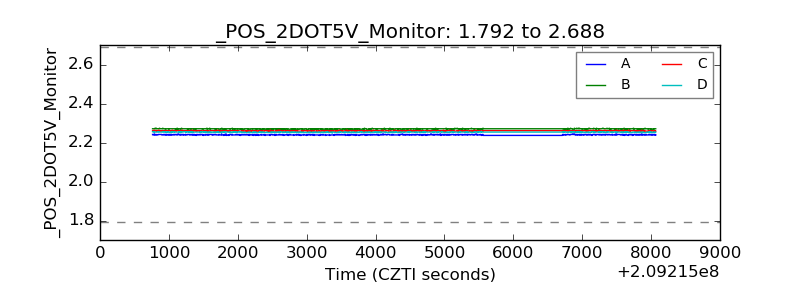 |
| +5 Volts monitor | 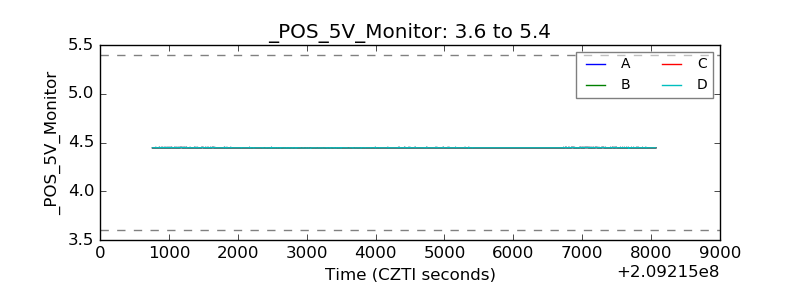 |
| _ROLL_ROT | 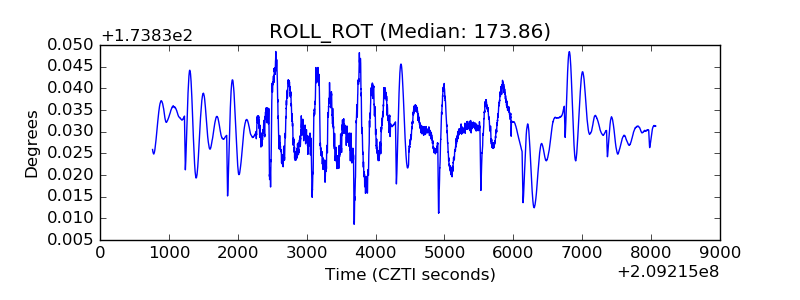 |
| _Roll_DEC | 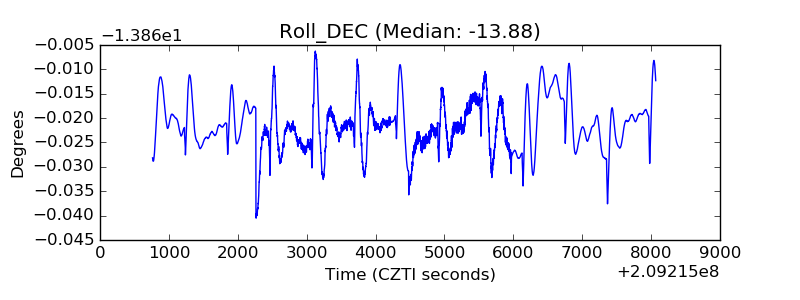 |
| _Roll_RA | 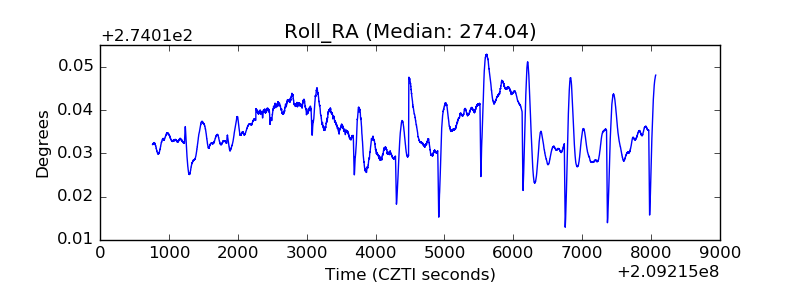 |
| Veto Counter | 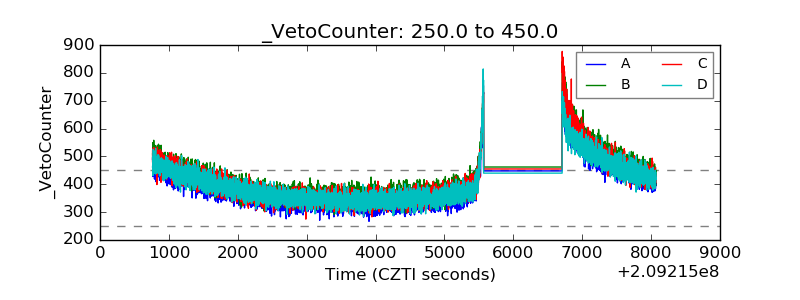 |