| Param | Original file | Final file |
|---|---|---|
| Filename | modeM0/AS1G05_144T01_9000000612cztM0_level2.fits | modeM0/AS1G05_144T01_9000000612cztM0_level2_quad_clean.evt |
| Size (bytes) | 412,015,680 | 365,895,360 |
| Size | 392.9 MB | 348.9 MB |
| Events in quadrant A | 2,463,808 | 2,074,714 |
| Events in quadrant B | 2,354,250 | 2,005,902 |
| Events in quadrant C | 2,440,956 | 2,027,770 |
| Events in quadrant D | 2,076,346 | 1,830,225 |
| Mode M0 | |||
|---|---|---|---|
| Quadrant | BADHDUFLAG | Total packets | Discarded packets |
| A | 0 | 99293 | 0 |
| B | 0 | 113481 | 0 |
| C | 0 | 98083 | 0 |
| D | 0 | 113918 | 0 |
| Mode M9 | |||
|---|---|---|---|
| Quadrant | BADHDUFLAG | Total packets | Discarded packets |
| A | 0 | 63 | 0 |
| B | 0 | 63 | 0 |
| C | 0 | 63 | 0 |
| D | 0 | 63 | 0 |
| Mode SS | |||
|---|---|---|---|
| Quadrant | BADHDUFLAG | Total packets | Discarded packets |
| A | 0 | 932 | 0 |
| B | 0 | 932 | 0 |
| C | 0 | 932 | 0 |
| D | 0 | 932 | 0 |
| Quadrant | Total seconds | Saturated seconds | Saturation percentage |
|---|---|---|---|
| A | 45763 | 982 | 2.145838% |
| B | 45763 | 1722 | 3.762865% |
| C | 45763 | 340 | 0.742958% |
| D | 45763 | 1195 | 2.611280% |
Noise dominated data is calculated using 1-second bins in cleaned event files. If a bin has >2000 counts, and if more than 50% of those come from <1% of pixels, then it is considered to be noise-dominated and hence unusable.
| Quadrant | # 1 sec bins | Bins with >0 counts | Bins with >2000 counts | High rate bins dominated by noise | Noise dominated (total time) | Noise dominated (detector-on time) | Marked lightcurve |
|---|---|---|---|---|---|---|---|
| A | 52023 | 45744 | 0 | 0 | 0.00% | 0.00% |  |
| B | 52023 | 45746 | 0 | 0 | 0.00% | 0.00% |  |
| C | 52023 | 45763 | 0 | 0 | 0.00% | 0.00% |  |
| D | 52023 | 45733 | 0 | 0 | 0.00% | 0.00% |  |
Top three noisy pixels from each quadrant. If the there are fewer than three noisy pixels in the level2.evt file, extra rows are filled as -1
| Pixel properties | Quadrant properties | ||||||
|---|---|---|---|---|---|---|---|
| Quadrant | DetID | PixID | Counts | Sigma | Mean | Median | Sigma |
| A | 0 | 29 | 2463 | 11.22 | 639 | 595 | 166.4 |
| A | 14 | 188 | 2451 | 11.15 | 639 | 595 | 166.4 |
| A | 7 | 110 | 2124 | 9.19 | 639 | 595 | 166.4 |
| B | 2 | 9 | 2059 | 11.43 | 621 | 589 | 128.6 |
| B | 12 | 226 | 1712 | 8.73 | 621 | 589 | 128.6 |
| B | 14 | 254 | 1647 | 8.23 | 621 | 589 | 128.6 |
| C | 1 | 80 | 1832 | 7.12 | 644 | 593 | 174.1 |
| C | 1 | 81 | 1748 | 6.63 | 644 | 593 | 174.1 |
| C | 12 | 241 | 1705 | 6.39 | 644 | 593 | 174.1 |
| D | 11 | 82 | 1706 | 7.24 | 591 | 534 | 162.0 |
| D | 7 | 5 | 1586 | 6.5 | 591 | 534 | 162.0 |
| D | 3 | 14 | 1550 | 6.27 | 591 | 534 | 162.0 |
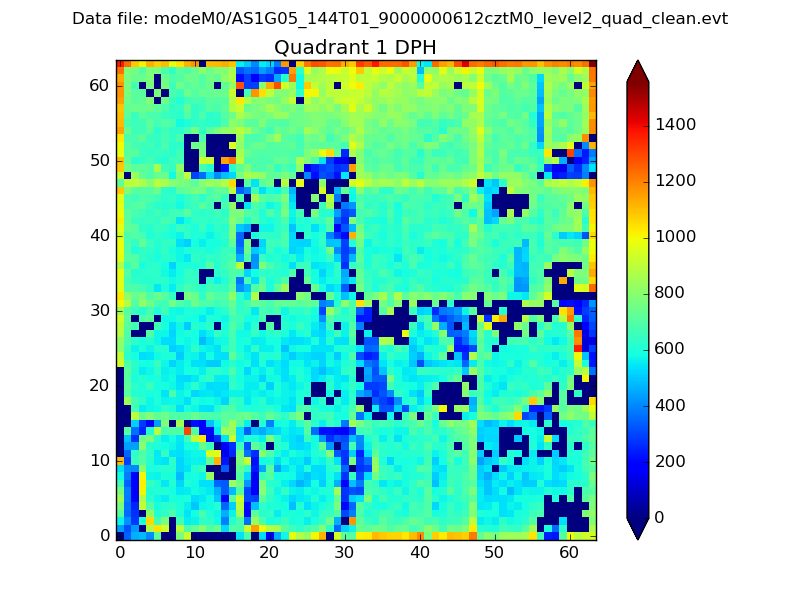
Histogram calculated using DETX and DETY for each event in the final _common_clean file
| Quadrant A |  |
 |
Quadrant B |
|---|---|---|---|
| Quadrant D |  |
 |
Quadrant C |
| Plot type | Count rate plots | Images |
|---|---|---|
| Comparison with Poisson distribution Blue bars denote a histogram of data divided into 1 sec bins. Red curve is a Poisson curve with rate = median count rate of data. |
 |
 |
| Quadrant-wise count rates Data is divided into 100 sec bins |
 |
|
| Module-wise count rates for Quadrant A Data is divided into 100 sec bins |
 |
 |
| Module-wise count rates for Quadrant B Data is divided into 100 sec bins |
 |
 |
| Module-wise count rates for Quadrant C Data is divided into 100 sec bins |
 |
 |
| Module-wise count rates for Quadrant D Data is divided into 100 sec bins |
 |
 |
| Parameter | Plot |
|---|---|
| CZT HV Monitor |  |
| D_VDD |  |
| Temperature 1 |  |
| Veto HV Monitor |  |
| Veto LLD |  |
| Alpha Counter |  |
| _CPM_Rate |  |
| CZT Counter |  |
| +2.5 Volts monitor |  |
| +5 Volts monitor |  |
| _ROLL_ROT |  |
| _Roll_DEC |  |
| _Roll_RA |  |
| Veto Counter |  |