| Param | Original file | Final file |
|---|---|---|
| Filename | modeM0/AS1G05_144T01_9000000612_04818cztM0_level2.evt | modeM0/AS1G05_144T01_9000000612_04818cztM0_level2_quad_clean.evt |
| Size (bytes) | 108,892,800 | 20,283,840 |
| Size | 103.8 MB | 19.3 MB |
| Events in quadrant A | 645,465 | 135,279 |
| Events in quadrant B | 698,014 | 134,690 |
| Events in quadrant C | 529,255 | 133,971 |
| Events in quadrant D | 1,345,839 | 124,039 |
| Mode M0 | |||
|---|---|---|---|
| Quadrant | BADHDUFLAG | Total packets | Discarded packets |
| A | 0 | 2602 | 1 |
| B | 0 | 2776 | 0 |
| C | 0 | 2264 | 0 |
| D | 0 | 4775 | 0 |
| Mode SS | |||
|---|---|---|---|
| Quadrant | BADHDUFLAG | Total packets | Discarded packets |
| A | 0 | 24 | 0 |
| B | 0 | 24 | 0 |
| C | 0 | 24 | 0 |
| D | 0 | 24 | 0 |
| Quadrant | Total seconds | Saturated seconds | Saturation percentage |
|---|---|---|---|
| A | 1121 | 16 | 1.427297% |
| B | 1121 | 21 | 1.873327% |
| C | 1121 | 1 | 0.089206% |
| D | 1121 | 87 | 7.760928% |
Noise dominated data is calculated using 1-second bins in cleaned event files. If a bin has >2000 counts, and if more than 50% of those come from <1% of pixels, then it is considered to be noise-dominated and hence unusable.
| Quadrant | # 1 sec bins | Bins with >0 counts | Bins with >2000 counts | High rate bins dominated by noise | Noise dominated (total time) | Noise dominated (detector-on time) | Marked lightcurve |
|---|---|---|---|---|---|---|---|
| A | 1121 | 1121 | 5 | 5 | 0.45% | 0.45% | 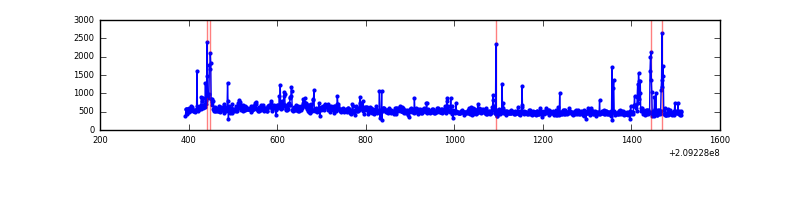 |
| B | 1121 | 1121 | 12 | 12 | 1.07% | 1.07% | 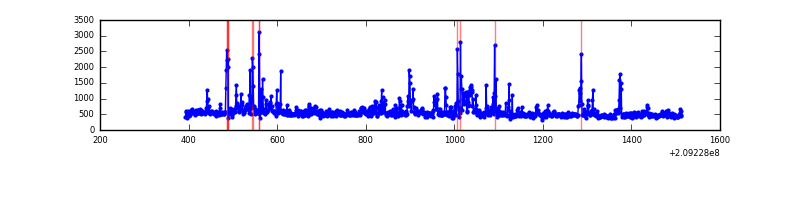 |
| C | 1121 | 1121 | 0 | 0 | 0.00% | 0.00% | 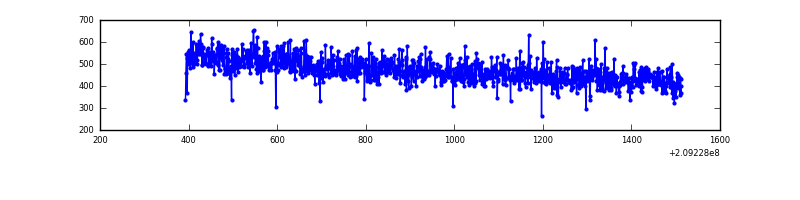 |
| D | 1121 | 1121 | 80 | 80 | 7.14% | 7.14% | 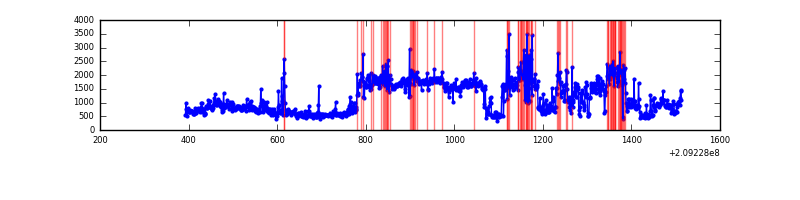 |
Top three noisy pixels from each quadrant. If the there are fewer than three noisy pixels in the level2.evt file, extra rows are filled as -1
| Pixel properties | Quadrant properties | ||||||
|---|---|---|---|---|---|---|---|
| Quadrant | DetID | PixID | Counts | Sigma | Mean | Median | Sigma |
| A | 13 | 251 | 59372 | 1905.83 | 143 | 141 | 31.1 |
| A | 14 | 111 | 13508 | 430.1 | 143 | 141 | 31.1 |
| A | 8 | 15 | 10363 | 328.91 | 143 | 141 | 31.1 |
| B | 4 | 80 | 130047 | 4479.51 | 140 | 137 | 29.0 |
| B | 15 | 54 | 10538 | 358.64 | 140 | 137 | 29.0 |
| B | 15 | 204 | 6582 | 222.23 | 140 | 137 | 29.0 |
| C | 13 | 61 | 1172 | 31.03 | 135 | 135 | 33.4 |
| C | 12 | 4 | 752 | 18.46 | 135 | 135 | 33.4 |
| C | 3 | 202 | 390 | 7.63 | 135 | 135 | 33.4 |
| D | 13 | 105 | 694472 | 20033.17 | 135 | 131 | 34.7 |
| D | 13 | 235 | 66957 | 1928.07 | 135 | 131 | 34.7 |
| D | 2 | 136 | 50029 | 1439.66 | 135 | 131 | 34.7 |
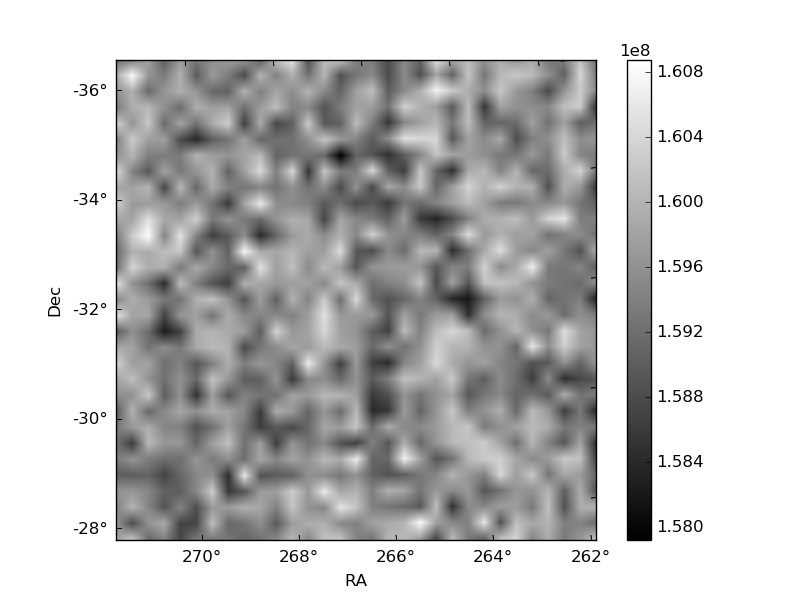
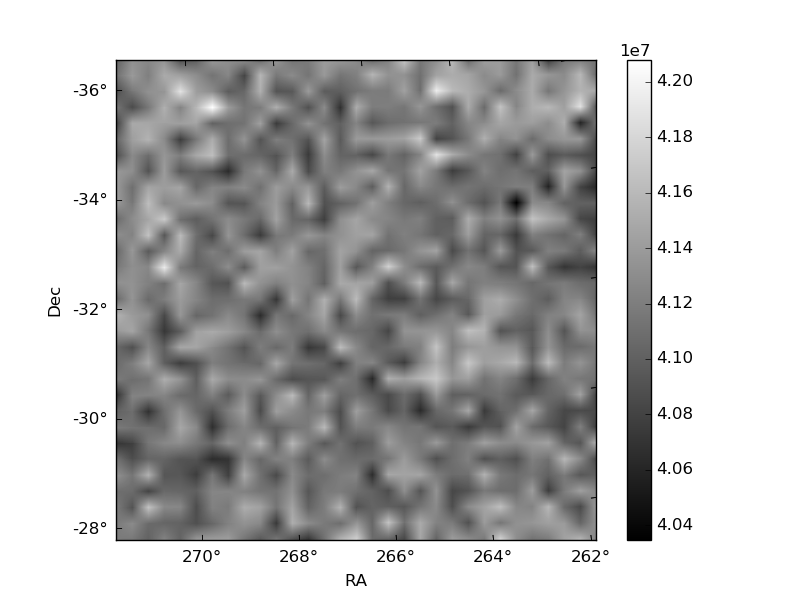
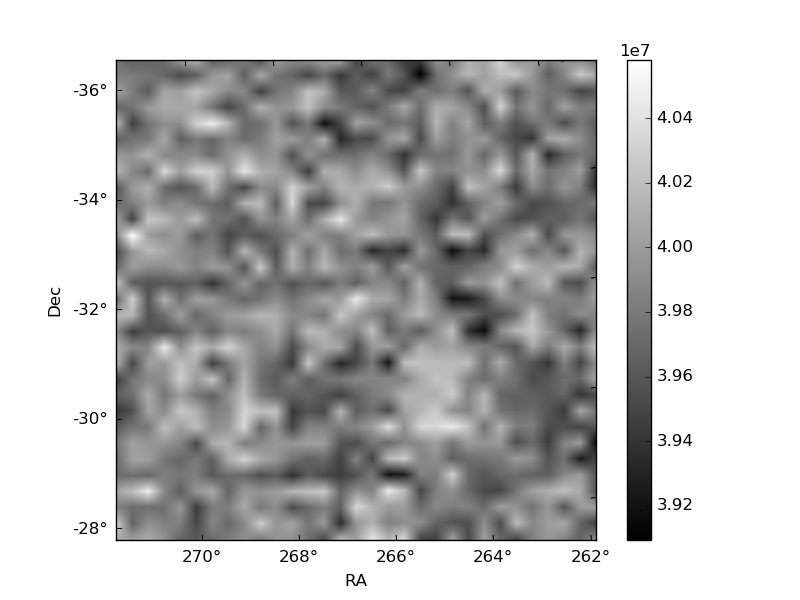
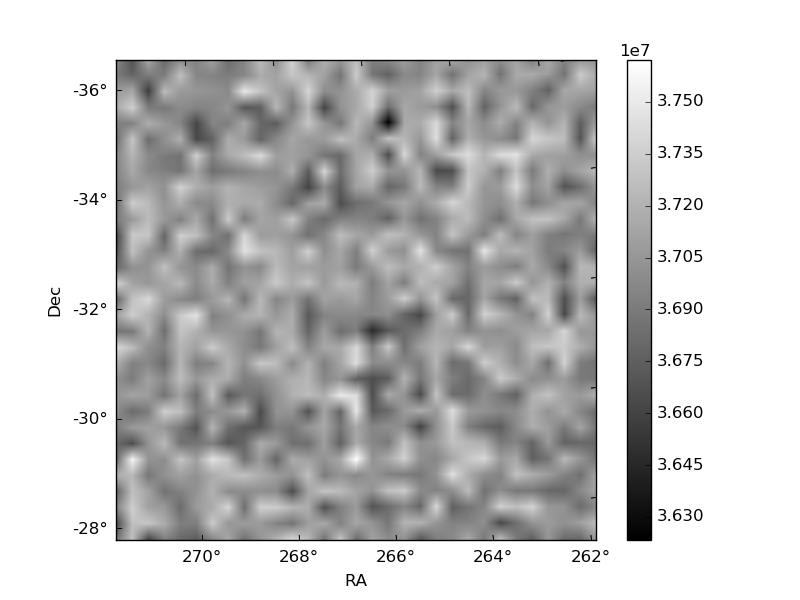
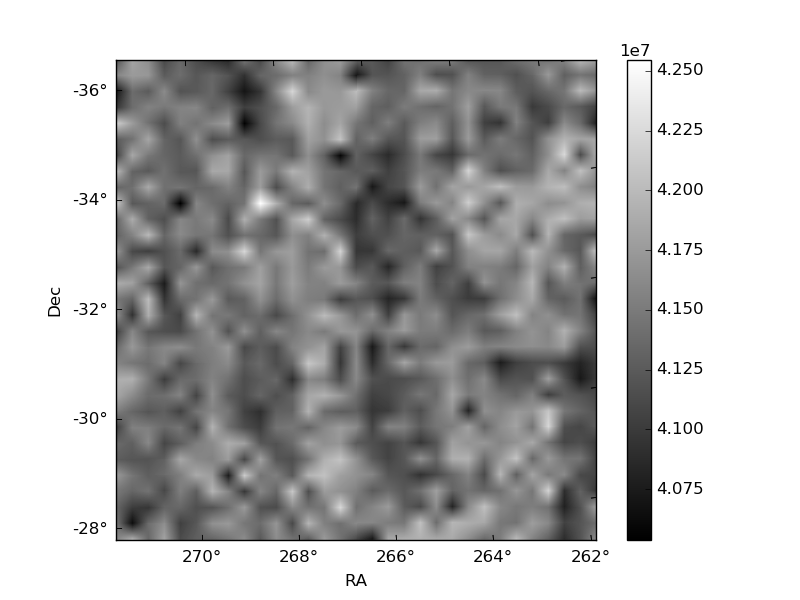
Histogram calculated using DETX and DETY for each event in the final _common_clean file
| Quadrant A | 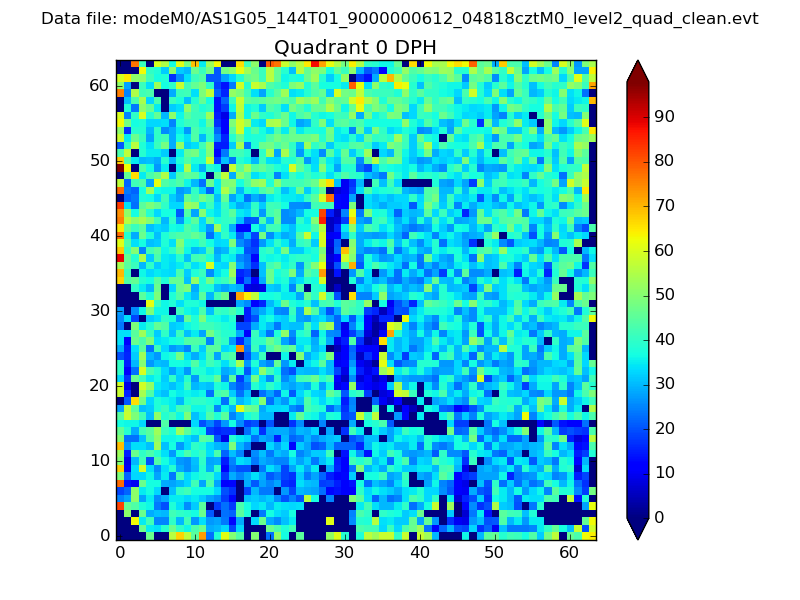 |
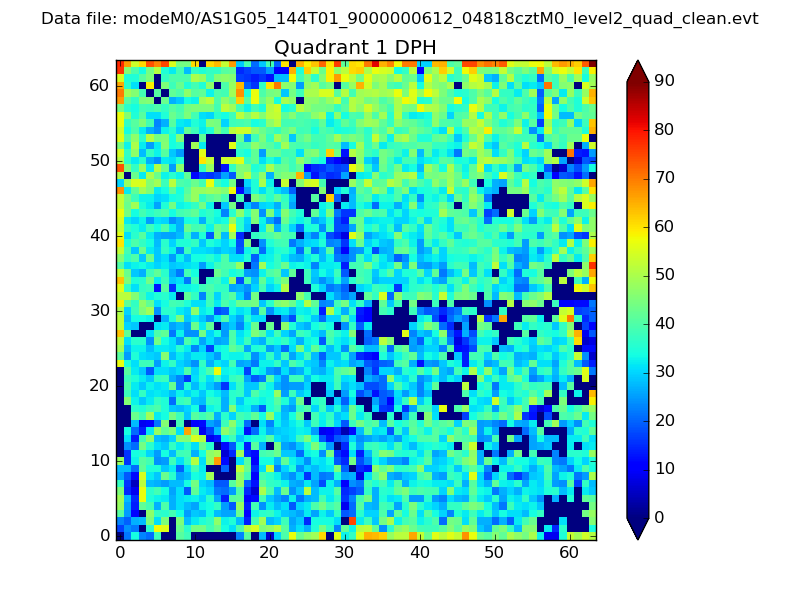 |
Quadrant B |
|---|---|---|---|
| Quadrant D | 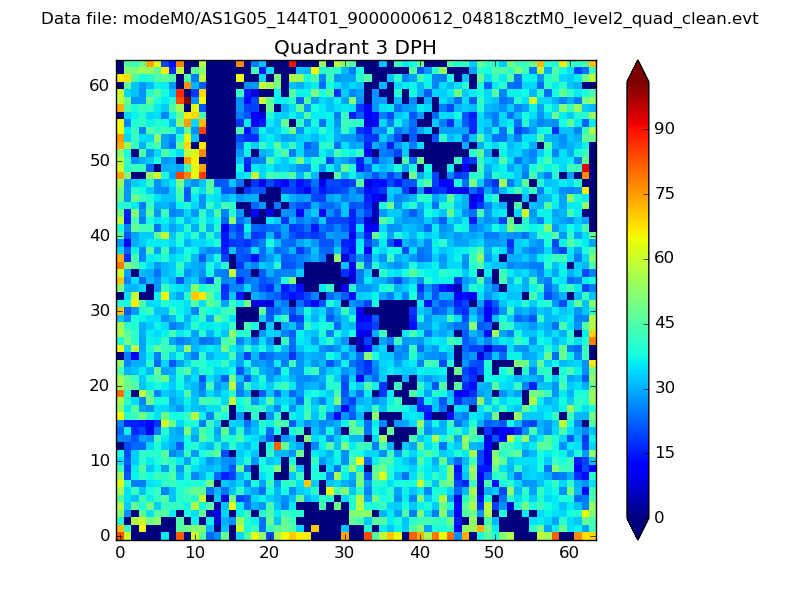 |
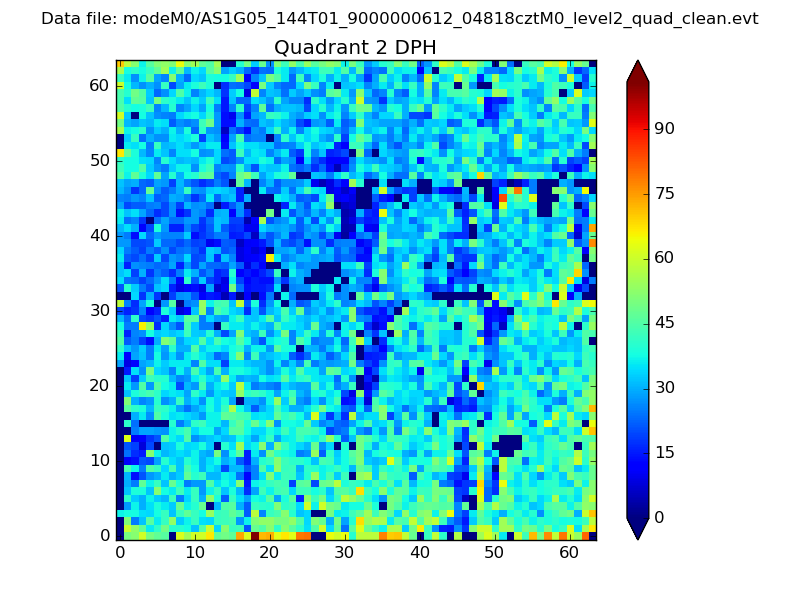 |
Quadrant C |
| Plot type | Count rate plots | Images |
|---|---|---|
| Comparison with Poisson distribution Blue bars denote a histogram of data divided into 1 sec bins. Red curve is a Poisson curve with rate = median count rate of data. |
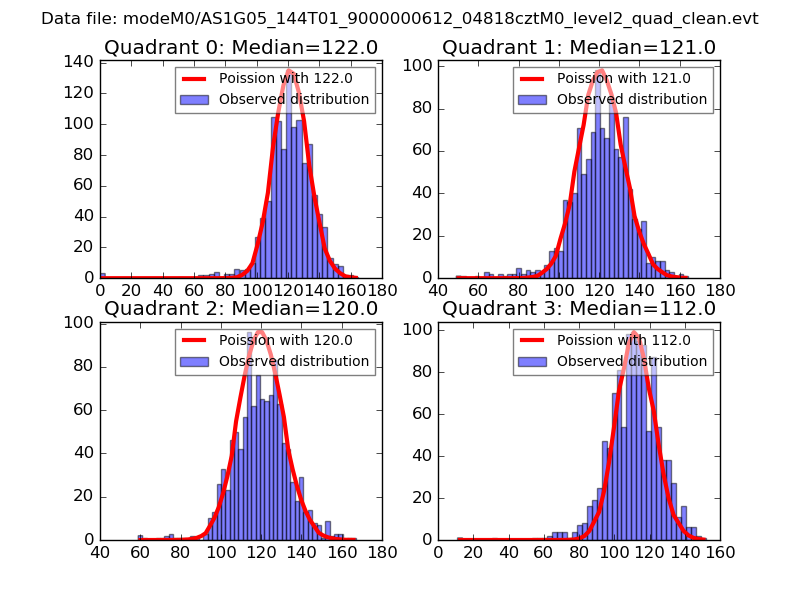 |
 |
| Quadrant-wise count rates Data is divided into 100 sec bins |
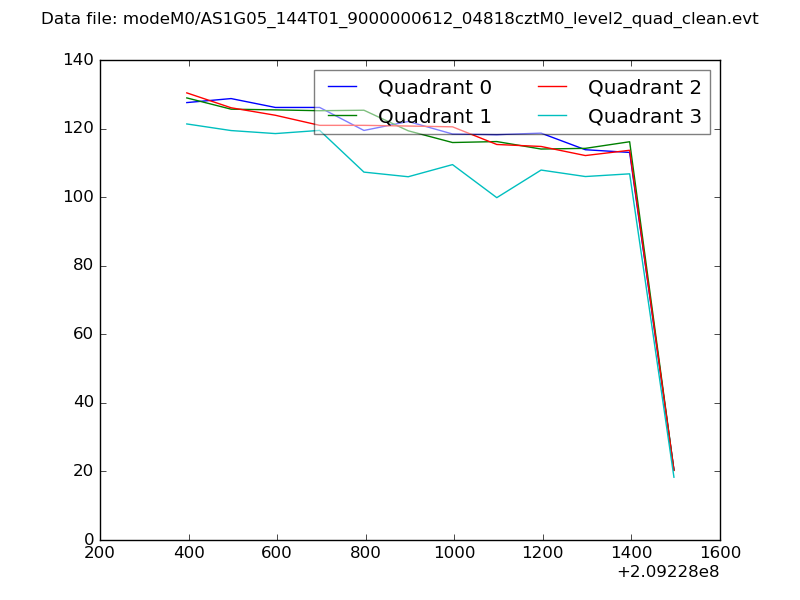 |
|
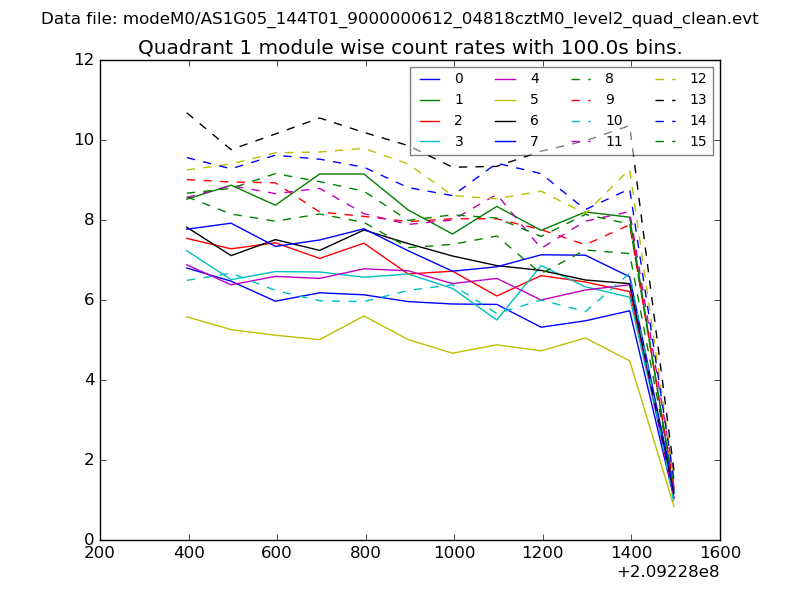
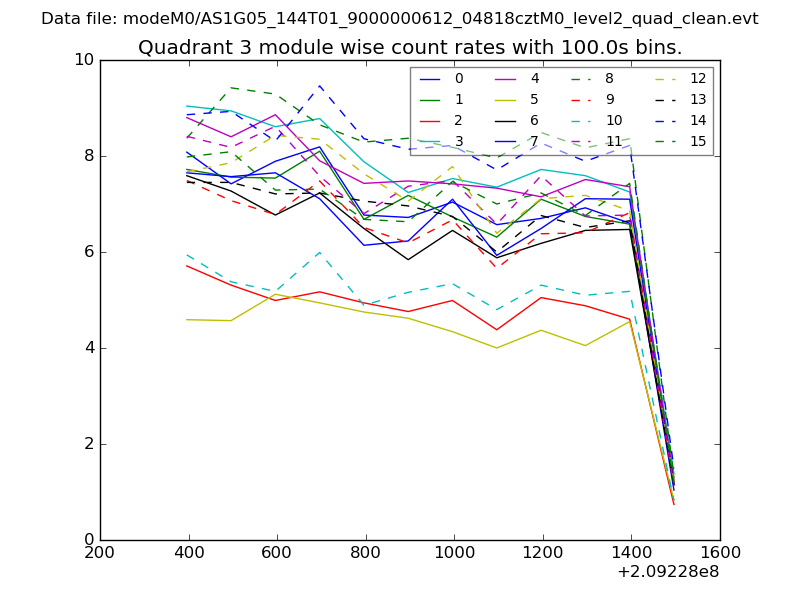
| Module-wise count rates for Quadrant A Data is divided into 100 sec bins |
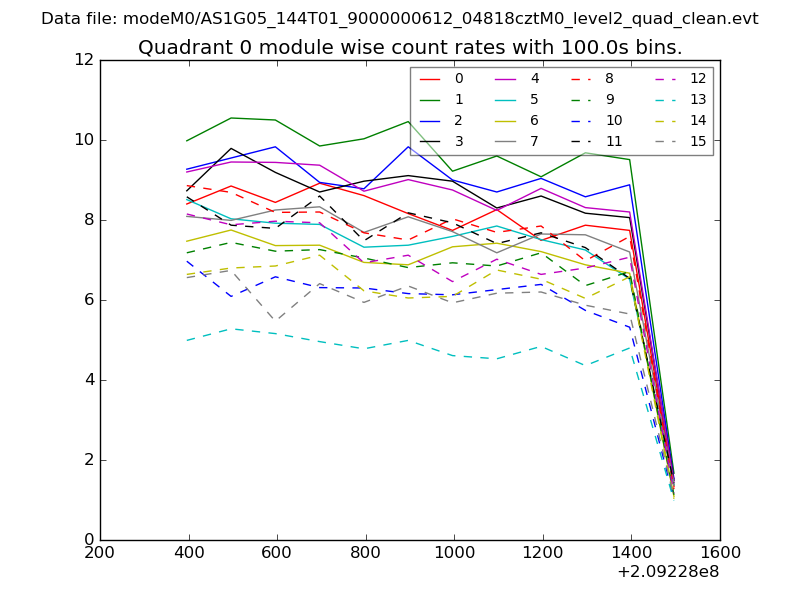 |
 |
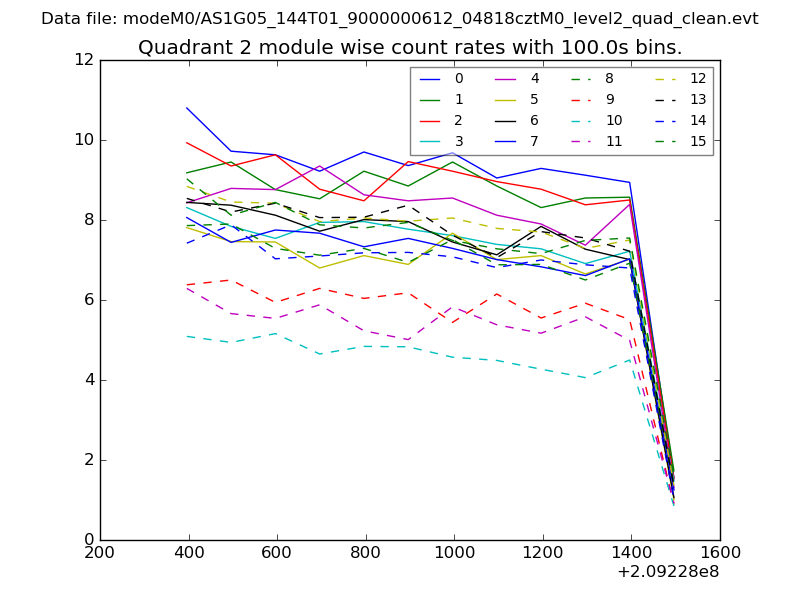
| Module-wise count rates for Quadrant B Data is divided into 100 sec bins |
 |
 |
| Module-wise count rates for Quadrant C Data is divided into 100 sec bins |
 |
 |
| Module-wise count rates for Quadrant D Data is divided into 100 sec bins |
 |
 |
| Parameter | Plot |
|---|---|
| CZT HV Monitor | 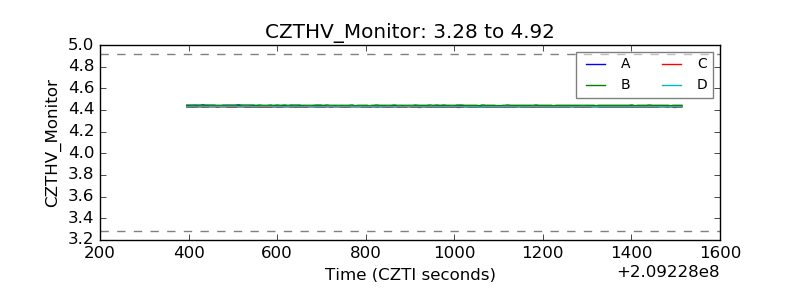 |
| D_VDD | 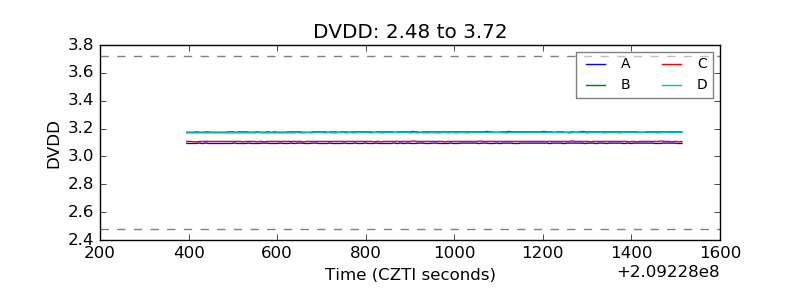 |
| Temperature 1 | 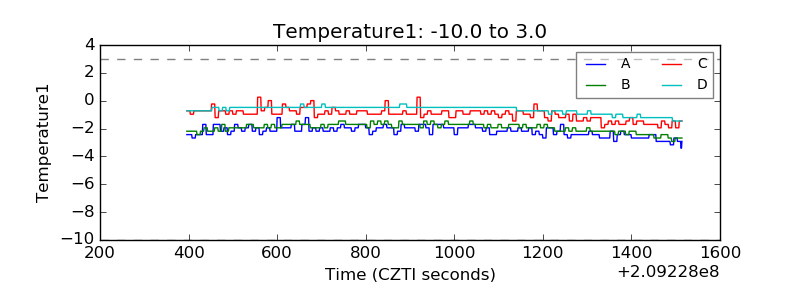 |
| Veto HV Monitor | 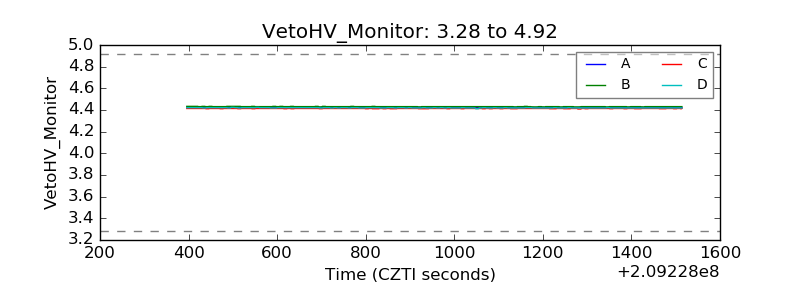 |
| Veto LLD | 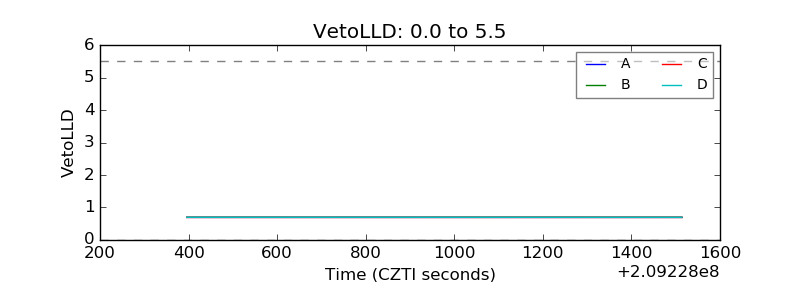 |
| Alpha Counter | 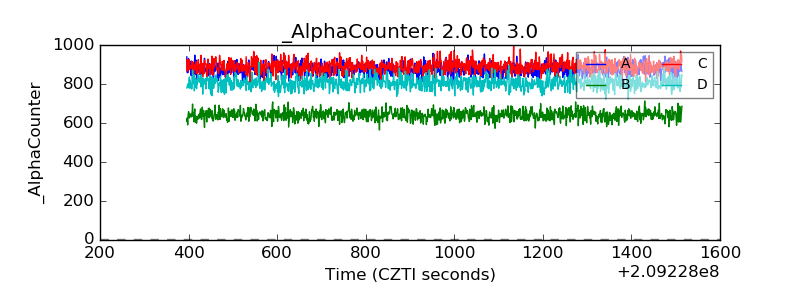 |
| _CPM_Rate | 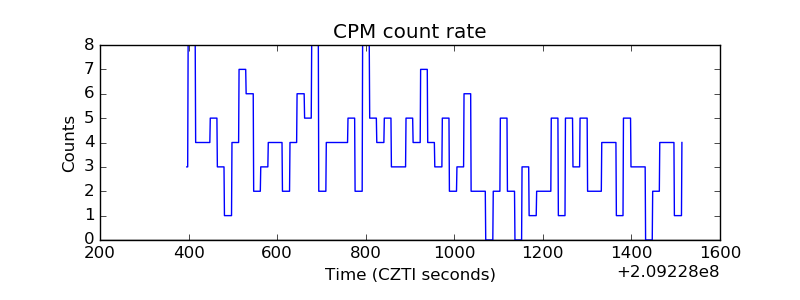 |
| CZT Counter | 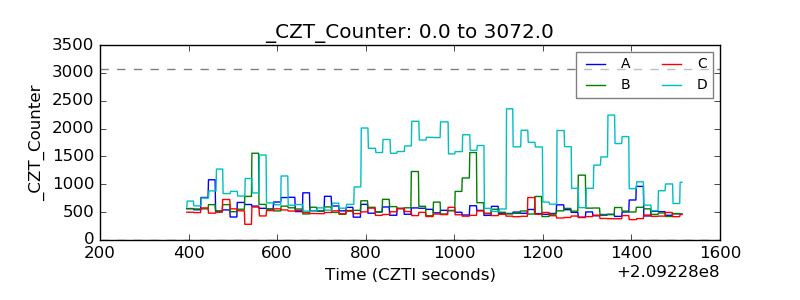 |
| +2.5 Volts monitor | 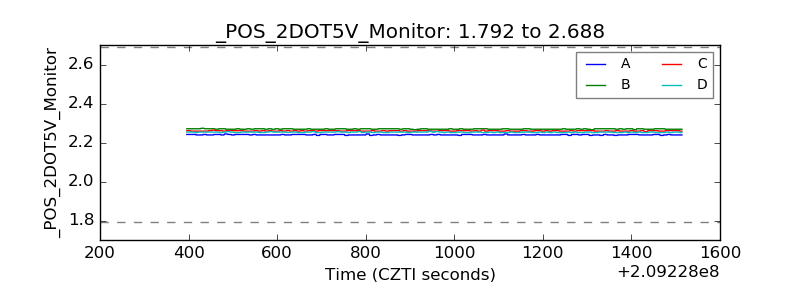 |
| +5 Volts monitor | 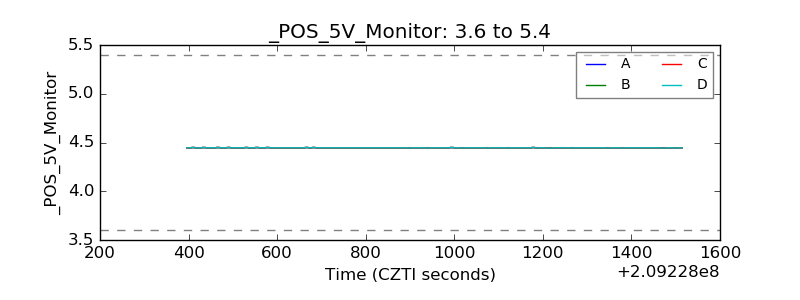 |
| _ROLL_ROT | 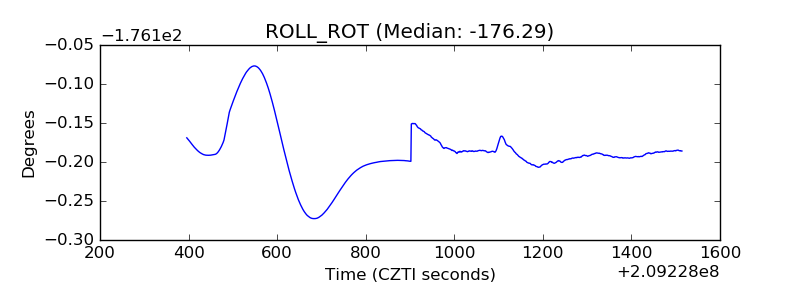 |
| _Roll_DEC | 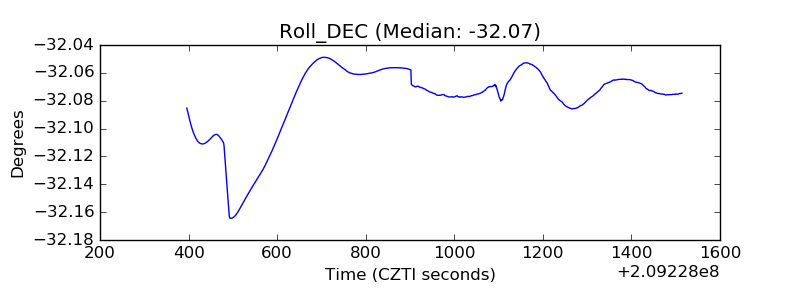 |
| _Roll_RA | 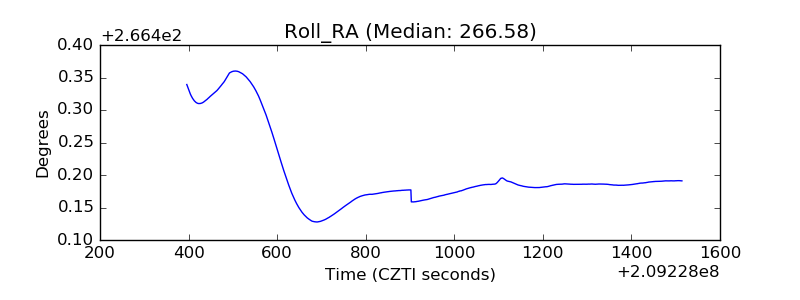 |
| Veto Counter | 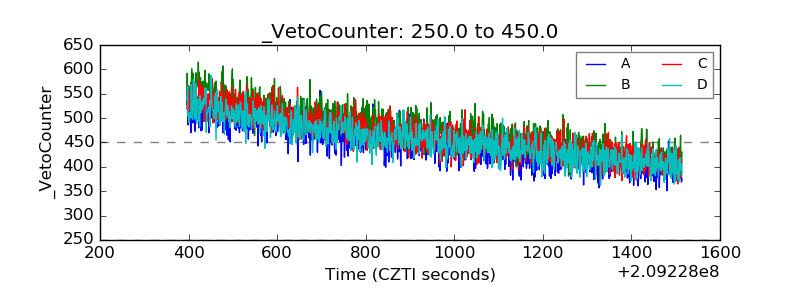 |