| Param | Original file | Final file |
|---|---|---|
| Filename | modeM0/AS1G05_144T01_9000000612_04821cztM0_level2.evt | modeM0/AS1G05_144T01_9000000612_04821cztM0_level2_quad_clean.evt |
| Size (bytes) | 459,953,280 | 76,063,680 |
| Size | 438.6 MB | 72.5 MB |
| Events in quadrant A | 3,097,236 | 470,374 |
| Events in quadrant B | 3,499,193 | 473,767 |
| Events in quadrant C | 2,983,399 | 471,261 |
| Events in quadrant D | 3,918,778 | 445,118 |
| Mode M0 | |||
|---|---|---|---|
| Quadrant | BADHDUFLAG | Total packets | Discarded packets |
| A | 0 | 13584 | 3 |
| B | 0 | 14628 | 2 |
| C | 0 | 13462 | 2 |
| D | 0 | 16085 | 2 |
| Mode M9 | |||
|---|---|---|---|
| Quadrant | BADHDUFLAG | Total packets | Discarded packets |
| A | 0 | 14 | 0 |
| B | 0 | 14 | 0 |
| C | 0 | 14 | 0 |
| D | 0 | 15 | 0 |
| Mode SS | |||
|---|---|---|---|
| Quadrant | BADHDUFLAG | Total packets | Discarded packets |
| A | 0 | 128 | 0 |
| B | 0 | 128 | 0 |
| C | 0 | 128 | 0 |
| D | 0 | 128 | 0 |
| Quadrant | Total seconds | Saturated seconds | Saturation percentage |
|---|---|---|---|
| A | 6347 | 130 | 2.048212% |
| B | 6347 | 93 | 1.465259% |
| C | 6347 | 35 | 0.551442% |
| D | 6347 | 196 | 3.088073% |
Noise dominated data is calculated using 1-second bins in cleaned event files. If a bin has >2000 counts, and if more than 50% of those come from <1% of pixels, then it is considered to be noise-dominated and hence unusable.
| Quadrant | # 1 sec bins | Bins with >0 counts | Bins with >2000 counts | High rate bins dominated by noise | Noise dominated (total time) | Noise dominated (detector-on time) | Marked lightcurve |
|---|---|---|---|---|---|---|---|
| A | 7512 | 6348 | 8 | 8 | 0.11% | 0.13% | 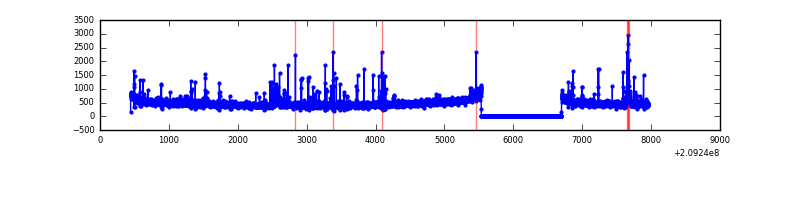 |
| B | 7512 | 6348 | 30 | 30 | 0.40% | 0.47% | 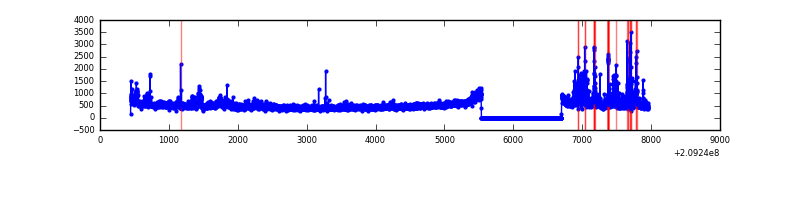 |
| C | 7512 | 6348 | 5 | 5 | 0.07% | 0.08% | 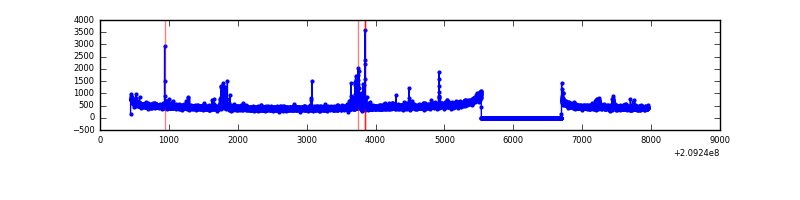 |
| D | 7512 | 6348 | 152 | 152 | 2.02% | 2.39% | 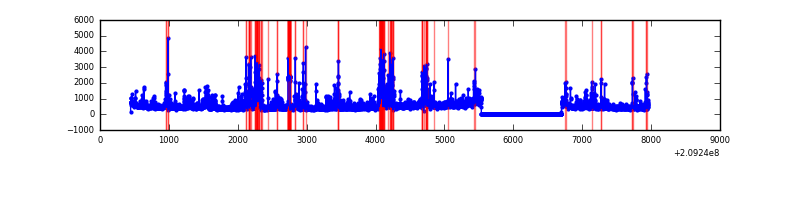 |
Top three noisy pixels from each quadrant. If the there are fewer than three noisy pixels in the level2.evt file, extra rows are filled as -1
| Pixel properties | Quadrant properties | ||||||
|---|---|---|---|---|---|---|---|
| Quadrant | DetID | PixID | Counts | Sigma | Mean | Median | Sigma |
| A | 13 | 251 | 129838 | 842.49 | 748 | 731 | 153.2 |
| A | 8 | 15 | 30561 | 194.66 | 748 | 731 | 153.2 |
| A | 0 | 149 | 26628 | 168.99 | 748 | 731 | 153.2 |
| B | 4 | 80 | 176826 | 1203.89 | 760 | 742 | 146.3 |
| B | 10 | 16 | 154819 | 1053.43 | 760 | 742 | 146.3 |
| B | 8 | 3 | 132247 | 899.1 | 760 | 742 | 146.3 |
| C | 9 | 247 | 139661 | 824.39 | 723 | 727 | 168.5 |
| C | 8 | 208 | 11713 | 65.19 | 723 | 727 | 168.5 |
| C | 13 | 61 | 5933 | 30.89 | 723 | 727 | 168.5 |
| D | 13 | 235 | 497929 | 2864.46 | 711 | 689 | 173.6 |
| D | 2 | 136 | 244970 | 1407.23 | 711 | 689 | 173.6 |
| D | 13 | 53 | 147833 | 847.65 | 711 | 689 | 173.6 |
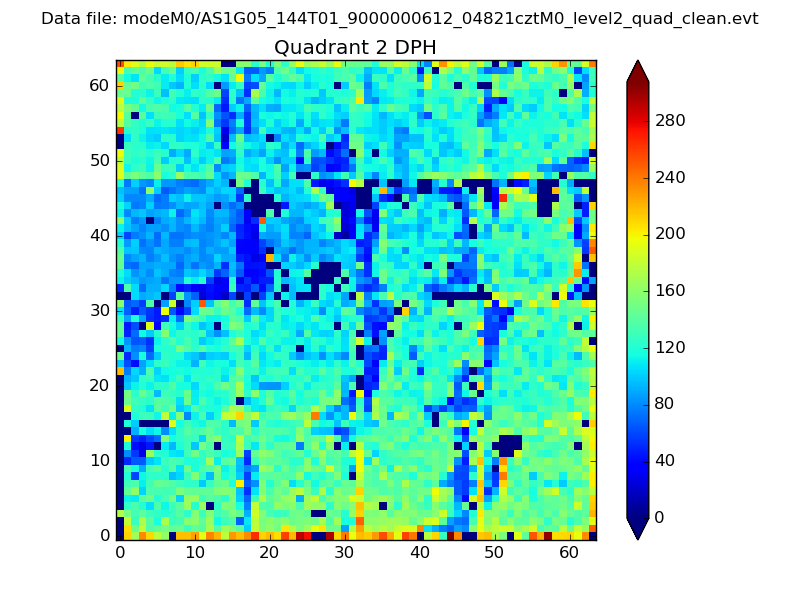
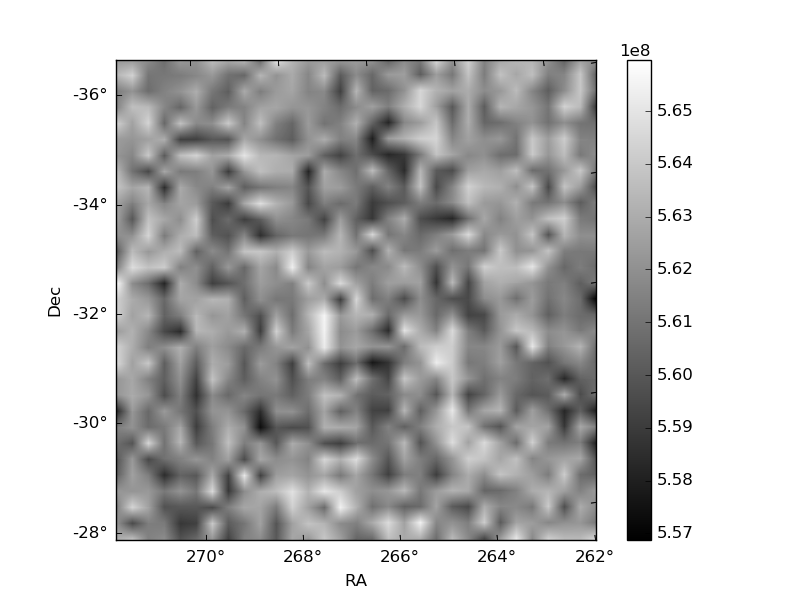
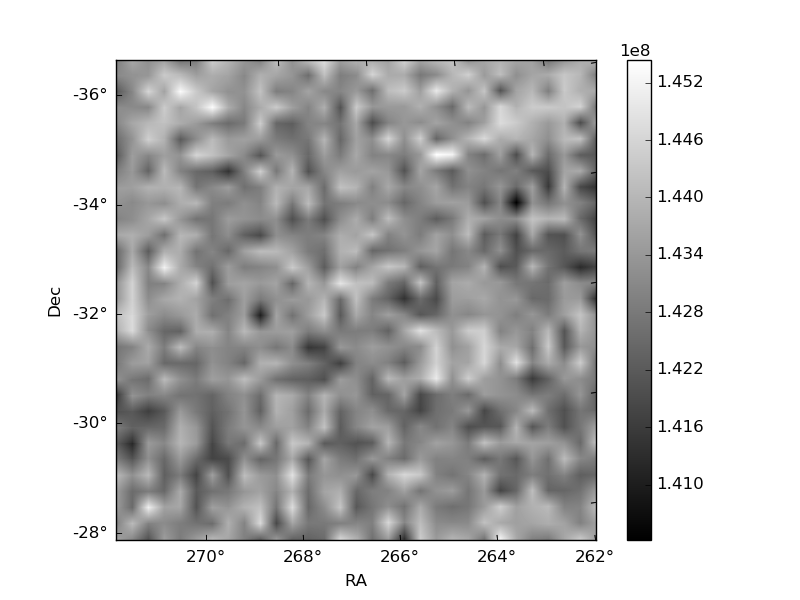
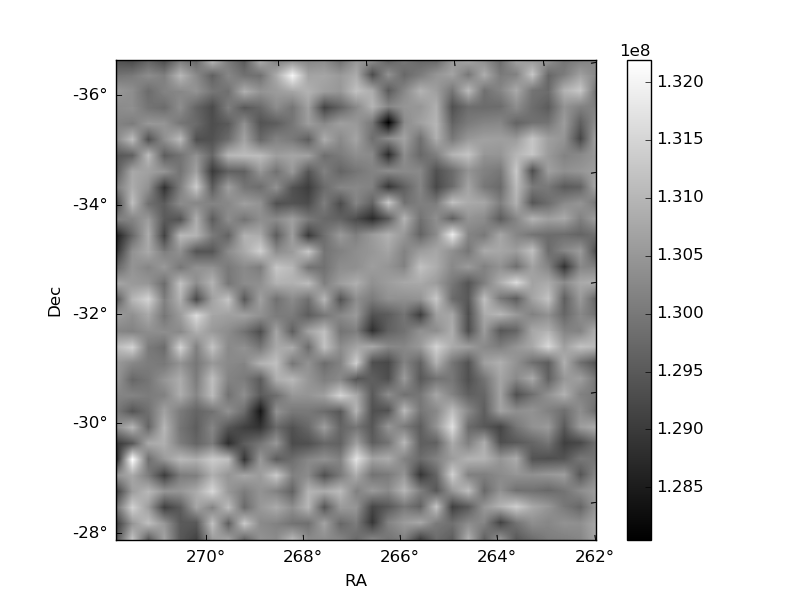
Histogram calculated using DETX and DETY for each event in the final _common_clean file
| Quadrant A | 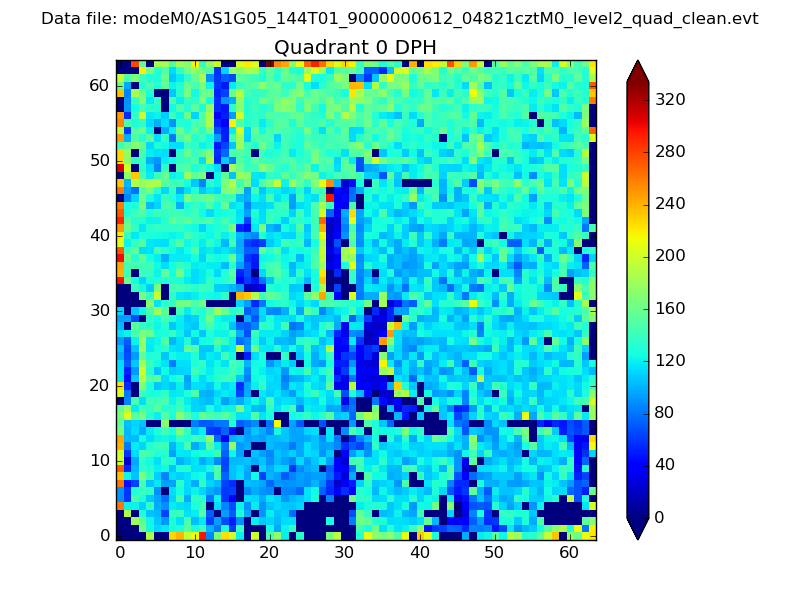 |
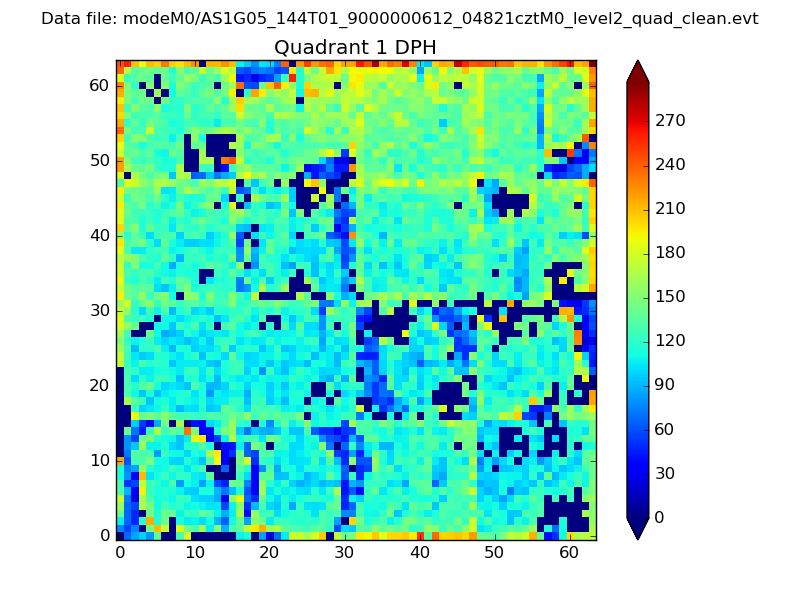 |
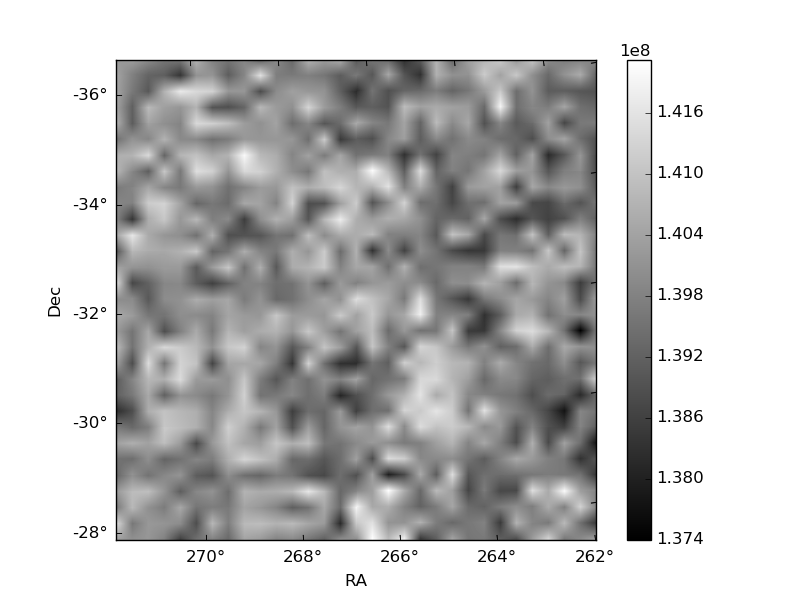
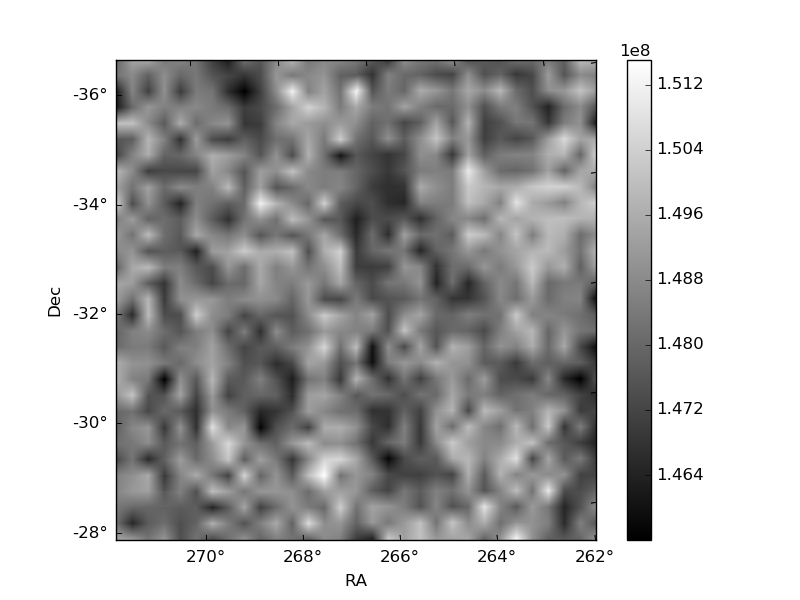
Quadrant B |
|---|---|---|---|
| Quadrant D | 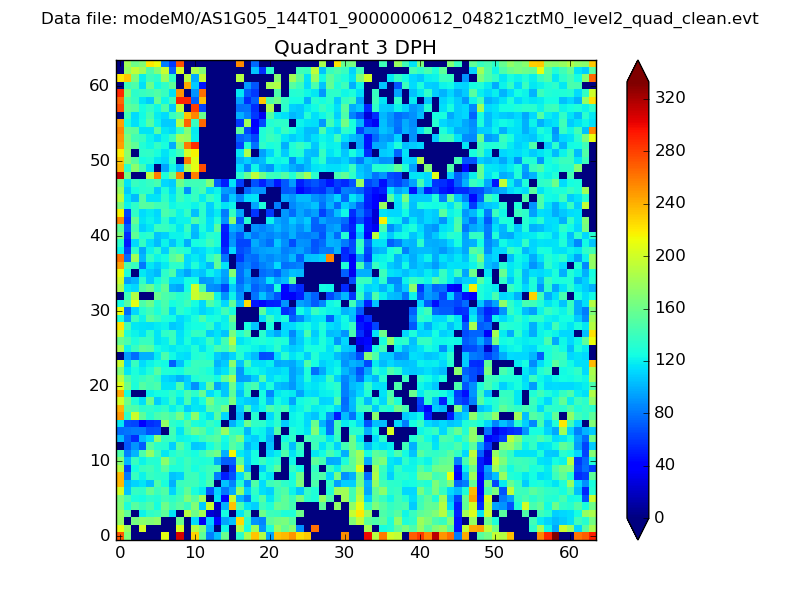 |
 |
Quadrant C |
| Plot type | Count rate plots | Images |
|---|---|---|
| Comparison with Poisson distribution Blue bars denote a histogram of data divided into 1 sec bins. Red curve is a Poisson curve with rate = median count rate of data. |
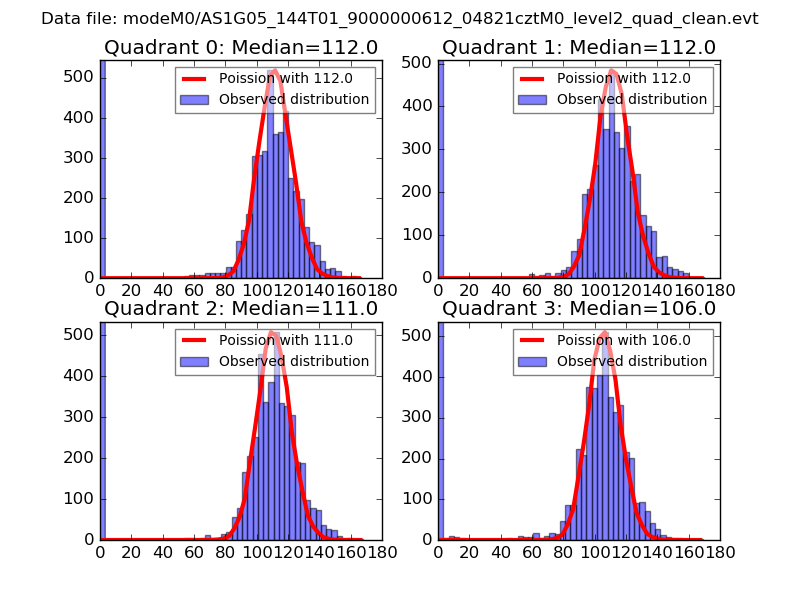 |
 |
| Quadrant-wise count rates Data is divided into 100 sec bins |
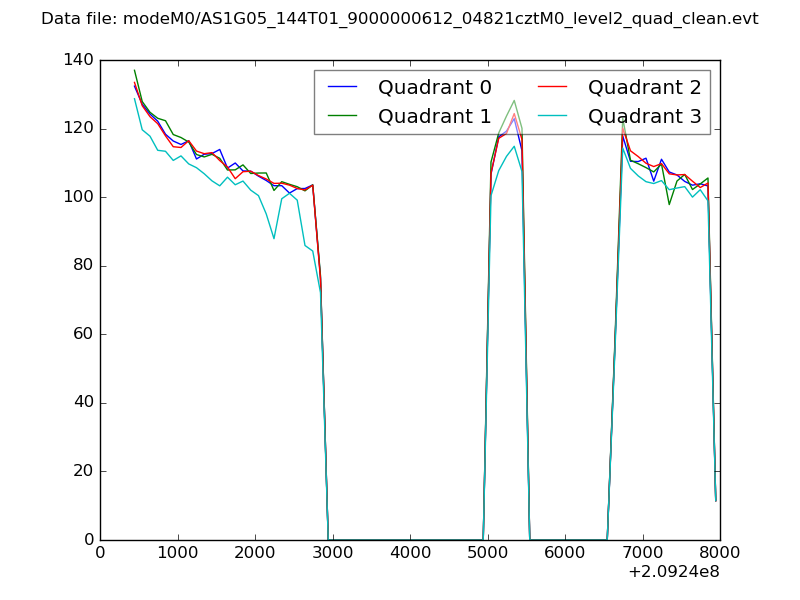 |
|
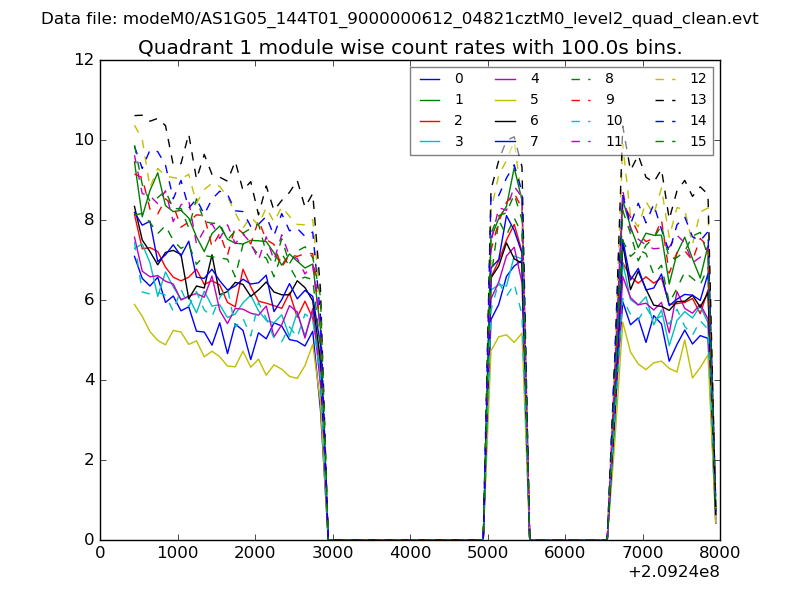
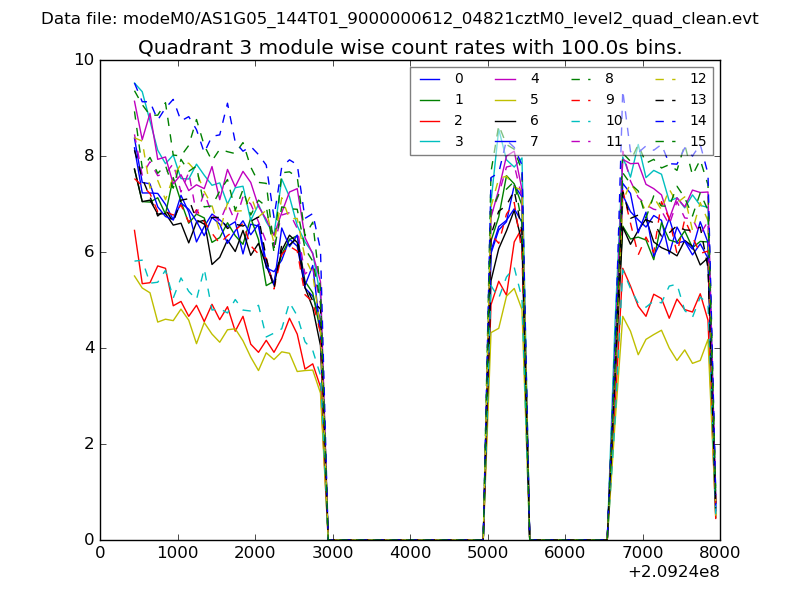
| Module-wise count rates for Quadrant A Data is divided into 100 sec bins |
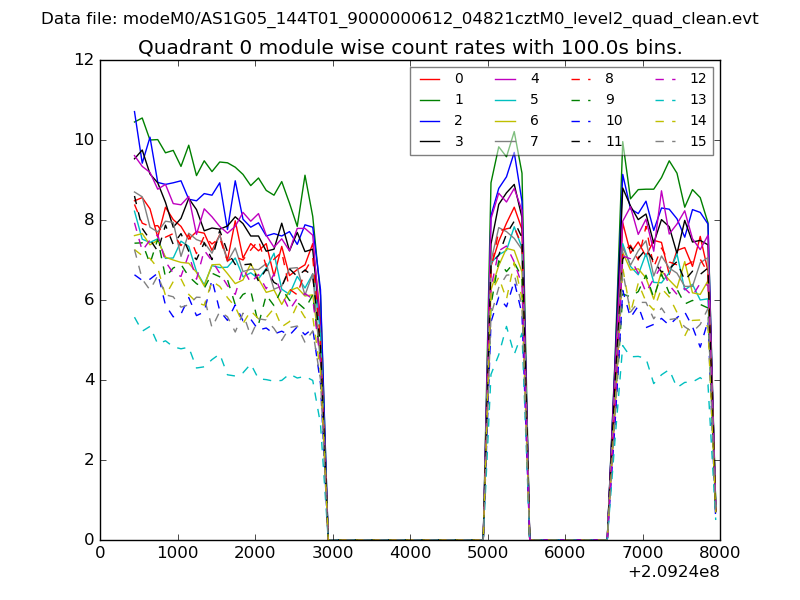 |
 |
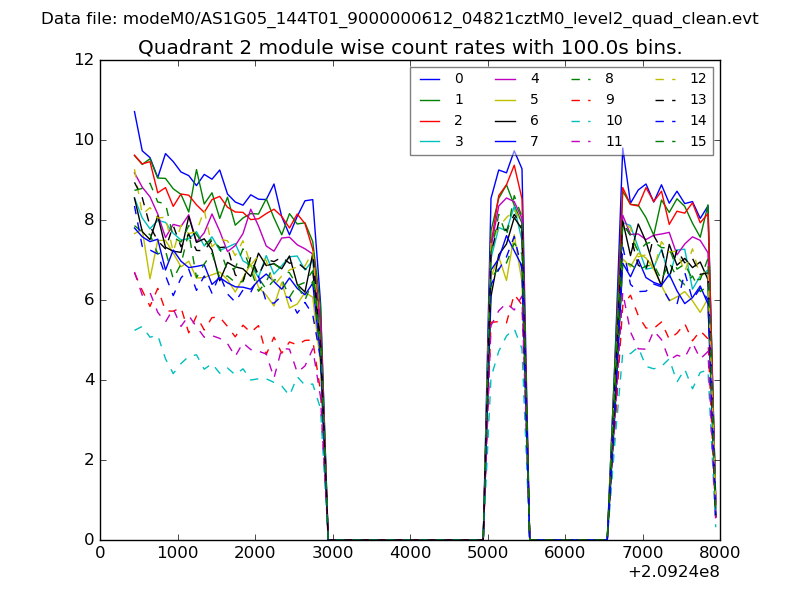
| Module-wise count rates for Quadrant B Data is divided into 100 sec bins |
 |
 |
| Module-wise count rates for Quadrant C Data is divided into 100 sec bins |
 |
 |
| Module-wise count rates for Quadrant D Data is divided into 100 sec bins |
 |
 |
| Parameter | Plot |
|---|---|
| CZT HV Monitor | 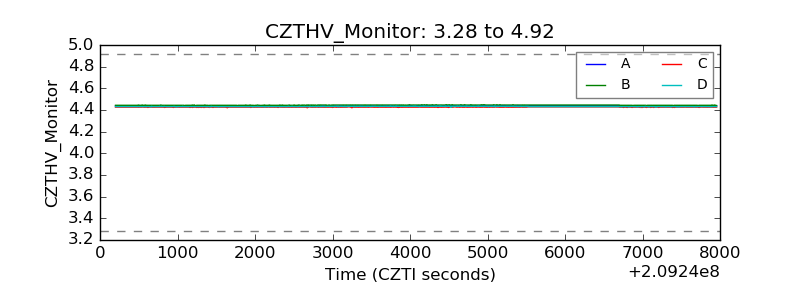 |
| D_VDD | 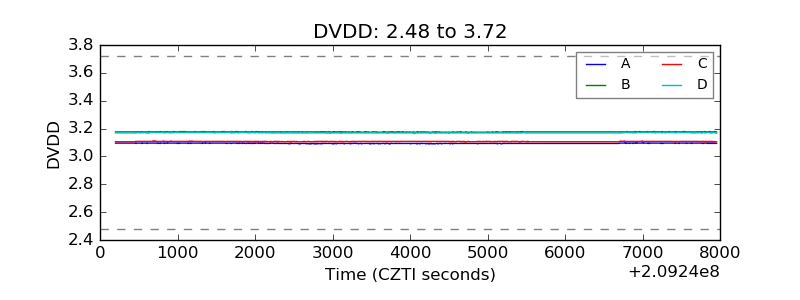 |
| Temperature 1 | 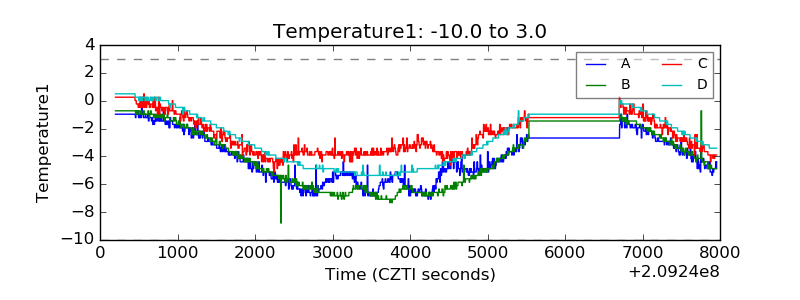 |
| Veto HV Monitor | 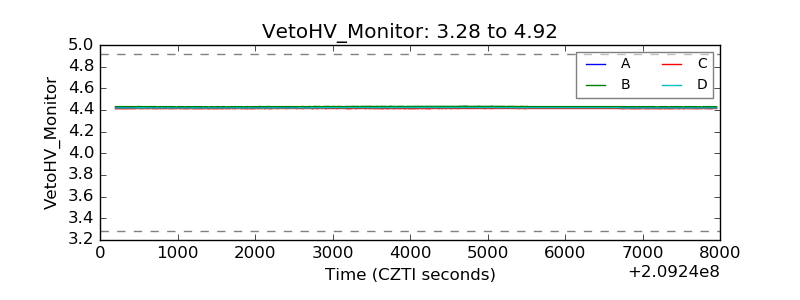 |
| Veto LLD | 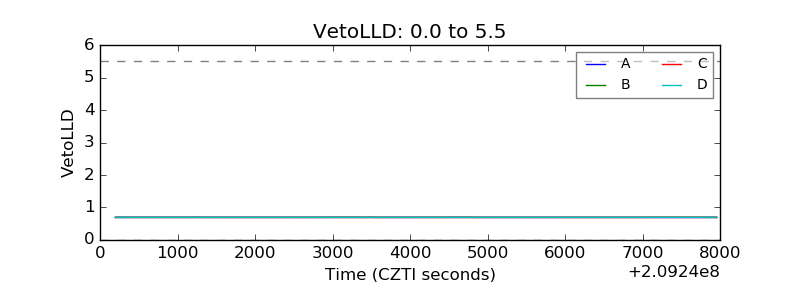 |
| Alpha Counter | 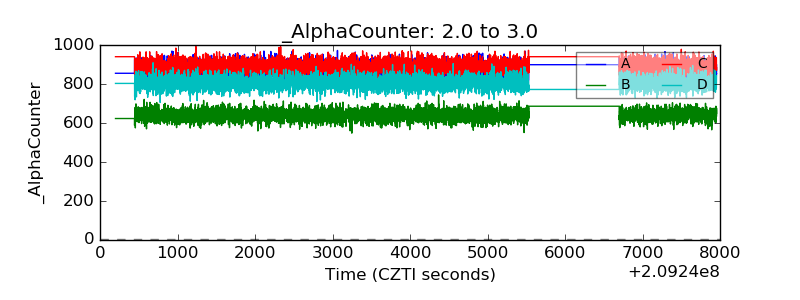 |
| _CPM_Rate | 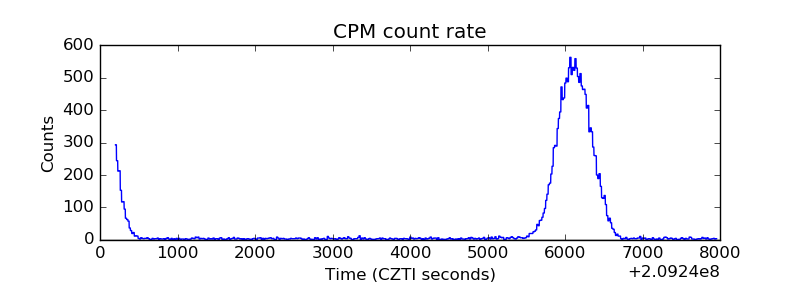 |
| CZT Counter | 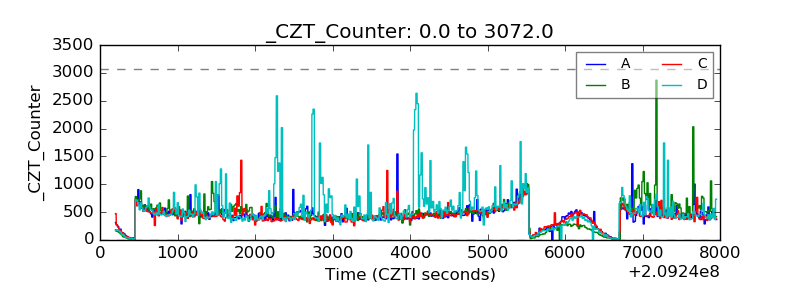 |
| +2.5 Volts monitor | 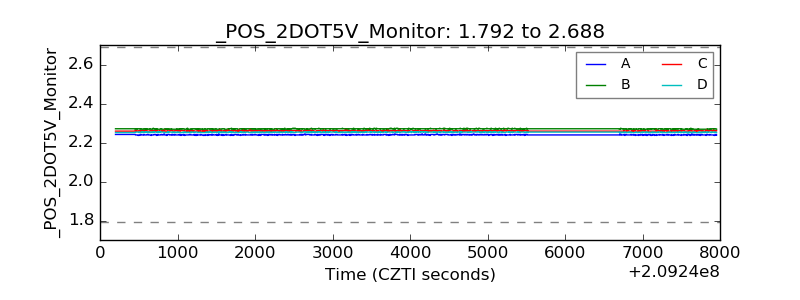 |
| +5 Volts monitor | 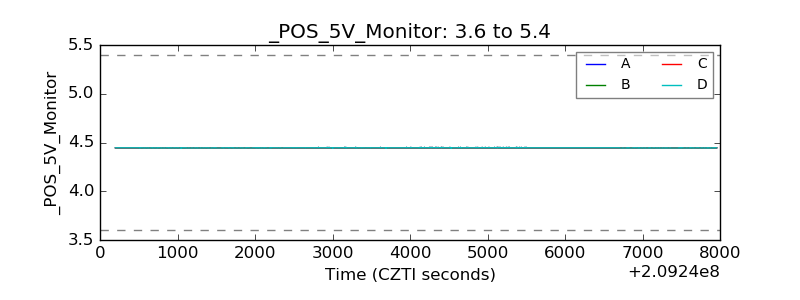 |
| _ROLL_ROT | 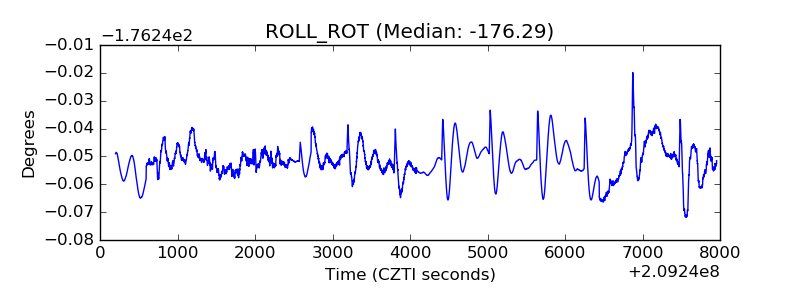 |
| _Roll_DEC | 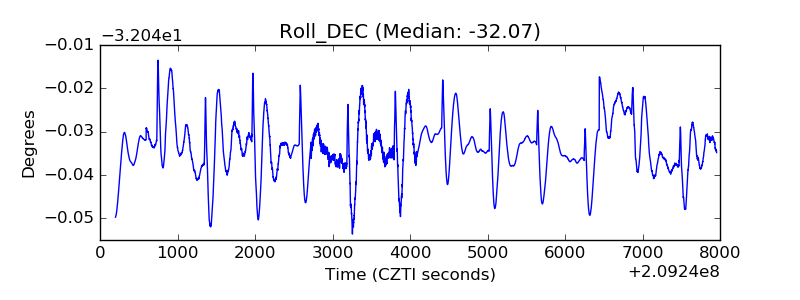 |
| _Roll_RA | 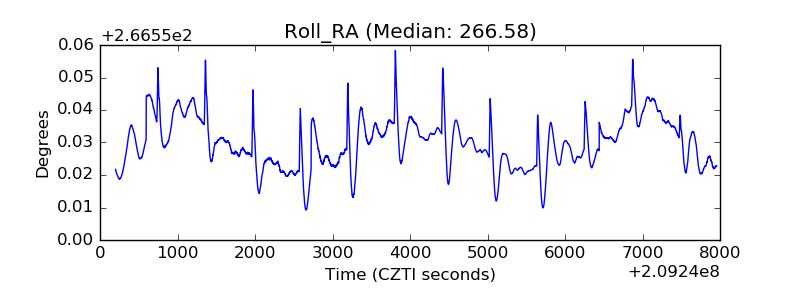 |
| Veto Counter | 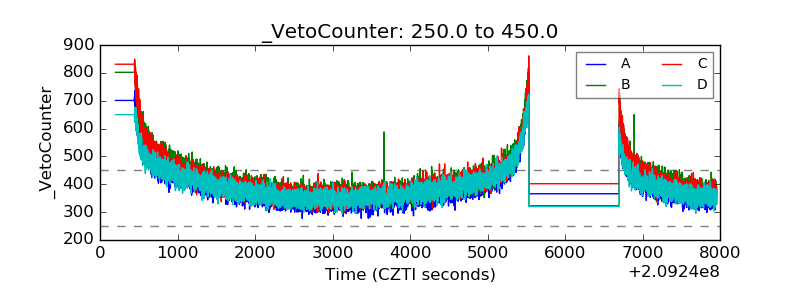 |