| Param | Original file | Final file |
|---|---|---|
| Filename | modeM0/AS1G05_144T01_9000000612_04822cztM0_level2.evt | modeM0/AS1G05_144T01_9000000612_04822cztM0_level2_quad_clean.evt |
| Size (bytes) | 493,015,680 | 81,360,000 |
| Size | 470.2 MB | 77.6 MB |
| Events in quadrant A | 3,287,381 | 502,521 |
| Events in quadrant B | 3,884,097 | 503,819 |
| Events in quadrant C | 3,076,044 | 506,547 |
| Events in quadrant D | 4,221,926 | 477,115 |
| Mode M0 | |||
|---|---|---|---|
| Quadrant | BADHDUFLAG | Total packets | Discarded packets |
| A | 0 | 14607 | 4 |
| B | 0 | 16061 | 3 |
| C | 0 | 14143 | 3 |
| D | 0 | 17383 | 3 |
| Mode M9 | |||
|---|---|---|---|
| Quadrant | BADHDUFLAG | Total packets | Discarded packets |
| A | 0 | 21 | 0 |
| B | 0 | 21 | 0 |
| C | 0 | 21 | 0 |
| D | 0 | 21 | 0 |
| Mode SS | |||
|---|---|---|---|
| Quadrant | BADHDUFLAG | Total packets | Discarded packets |
| A | 0 | 138 | 0 |
| B | 0 | 138 | 0 |
| C | 0 | 138 | 0 |
| D | 0 | 138 | 0 |
| Quadrant | Total seconds | Saturated seconds | Saturation percentage |
|---|---|---|---|
| A | 6802 | 131 | 1.925904% |
| B | 6802 | 134 | 1.970009% |
| C | 6802 | 39 | 0.573361% |
| D | 6802 | 199 | 2.925610% |
Noise dominated data is calculated using 1-second bins in cleaned event files. If a bin has >2000 counts, and if more than 50% of those come from <1% of pixels, then it is considered to be noise-dominated and hence unusable.
| Quadrant | # 1 sec bins | Bins with >0 counts | Bins with >2000 counts | High rate bins dominated by noise | Noise dominated (total time) | Noise dominated (detector-on time) | Marked lightcurve |
|---|---|---|---|---|---|---|---|
| A | 8892 | 6805 | 23 | 23 | 0.26% | 0.34% | 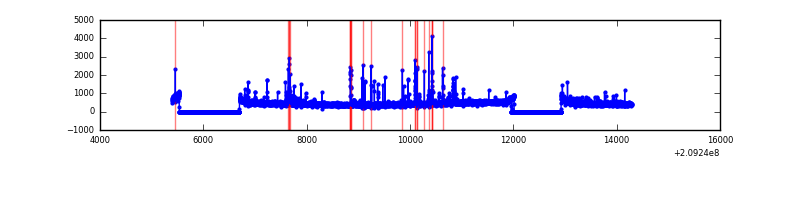 |
| B | 8892 | 6805 | 47 | 47 | 0.53% | 0.69% | 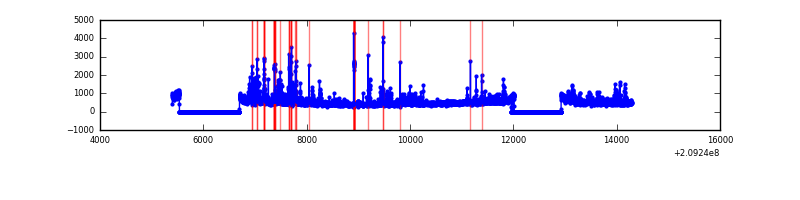 |
| C | 8892 | 6805 | 0 | 0 | 0.00% | 0.00% | 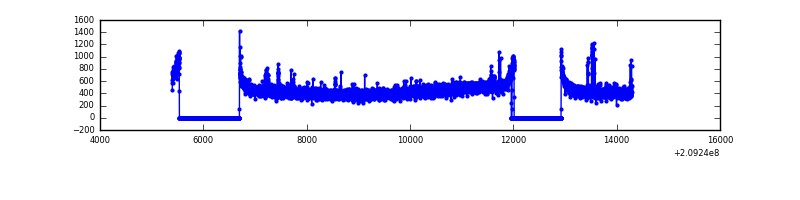 |
| D | 8892 | 6805 | 148 | 148 | 1.66% | 2.17% | 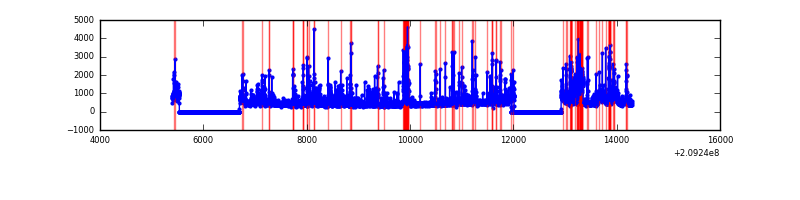 |
Top three noisy pixels from each quadrant. If the there are fewer than three noisy pixels in the level2.evt file, extra rows are filled as -1
| Pixel properties | Quadrant properties | ||||||
|---|---|---|---|---|---|---|---|
| Quadrant | DetID | PixID | Counts | Sigma | Mean | Median | Sigma |
| A | 13 | 251 | 123433 | 756.87 | 788 | 771 | 162.1 |
| A | 0 | 50 | 55796 | 339.53 | 788 | 771 | 162.1 |
| A | 0 | 149 | 33434 | 201.54 | 788 | 771 | 162.1 |
| B | 4 | 80 | 284677 | 1824.41 | 804 | 785 | 155.6 |
| B | 10 | 16 | 252156 | 1615.42 | 804 | 785 | 155.6 |
| B | 15 | 204 | 94725 | 603.7 | 804 | 785 | 155.6 |
| C | 8 | 208 | 33872 | 184.17 | 768 | 771 | 179.7 |
| C | 9 | 247 | 25379 | 136.92 | 768 | 771 | 179.7 |
| C | 12 | 4 | 11821 | 61.48 | 768 | 771 | 179.7 |
| D | 13 | 235 | 321426 | 1753.05 | 754 | 732 | 182.9 |
| D | 2 | 136 | 288639 | 1573.83 | 754 | 732 | 182.9 |
| D | 5 | 239 | 270589 | 1475.16 | 754 | 732 | 182.9 |
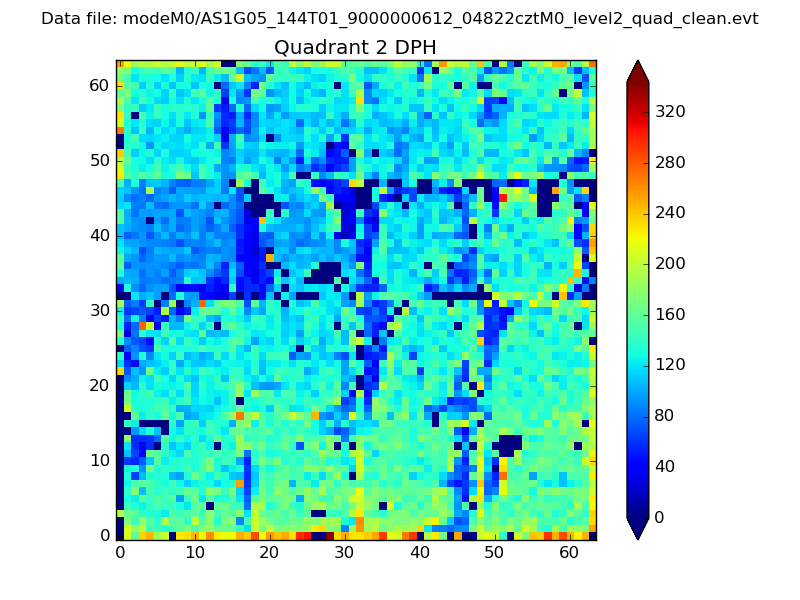
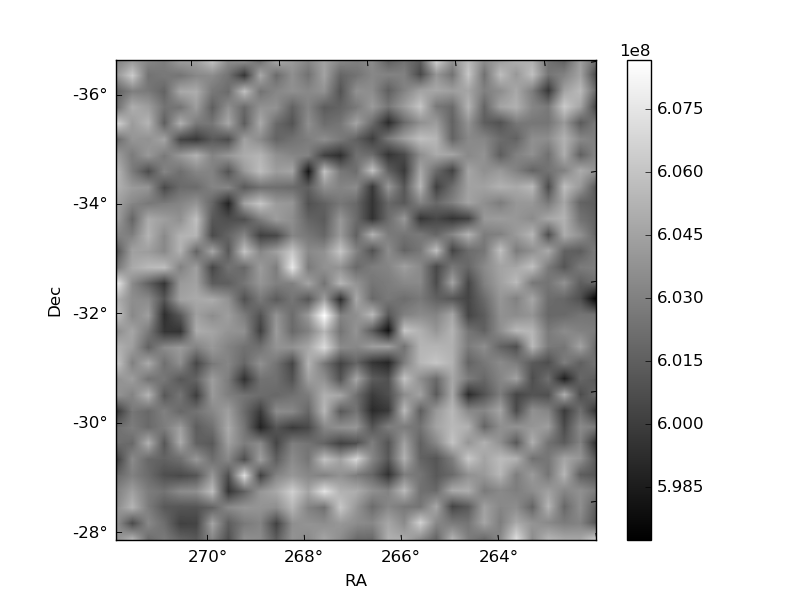
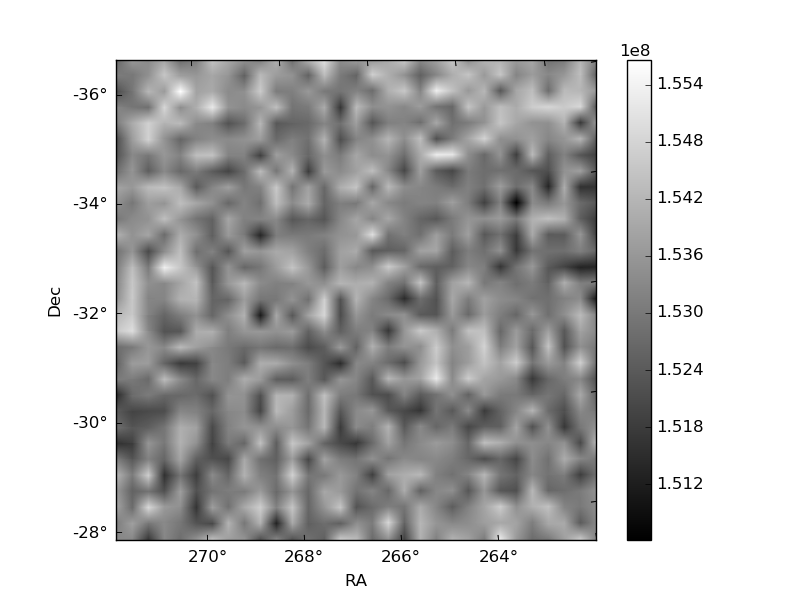
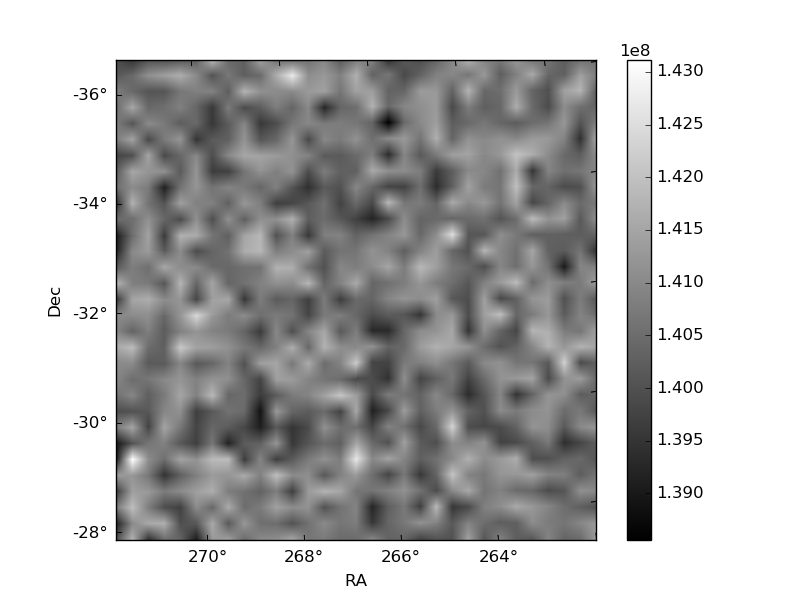
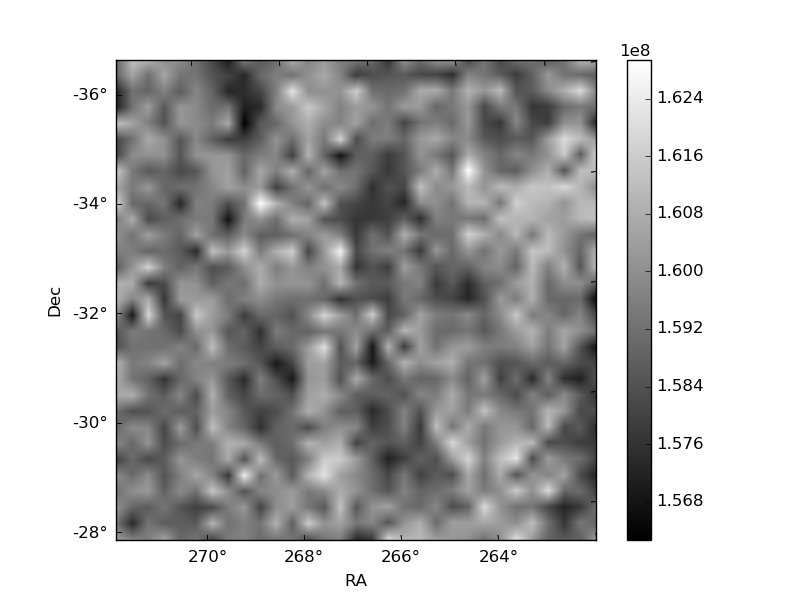
Histogram calculated using DETX and DETY for each event in the final _common_clean file
| Quadrant A | 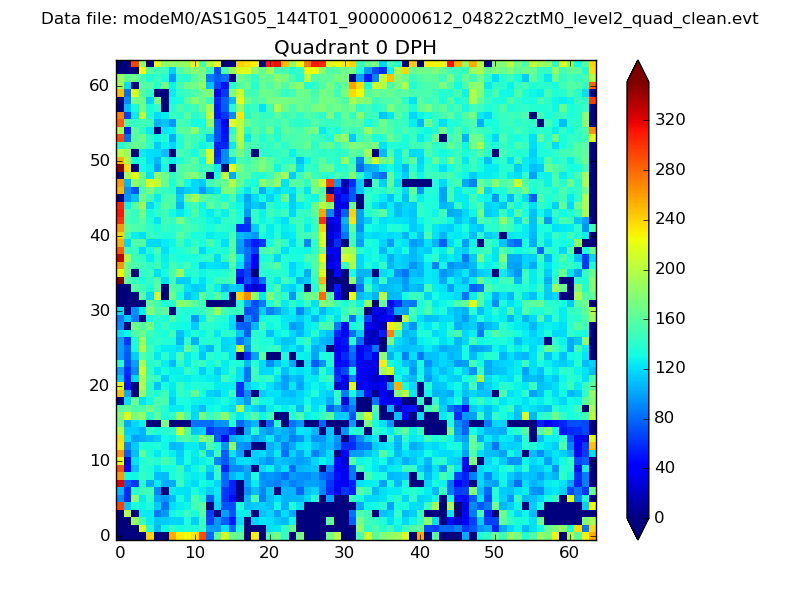 |
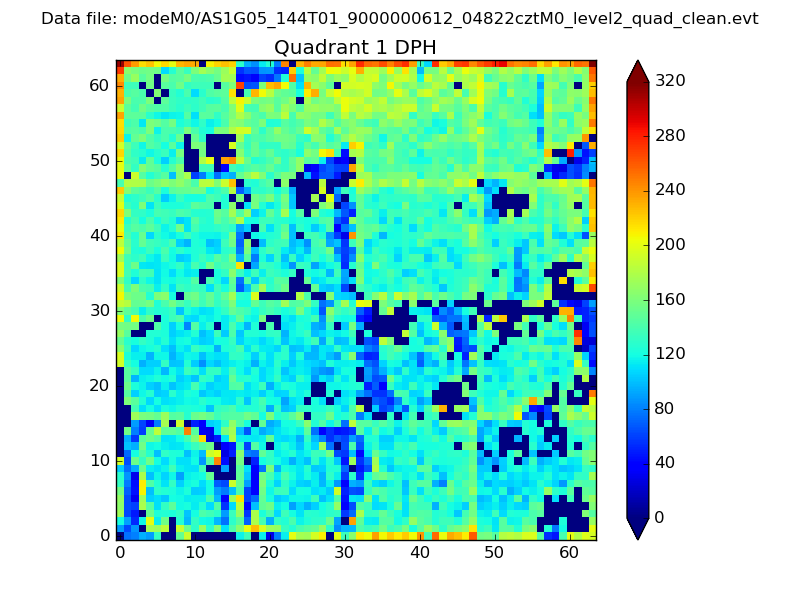 |
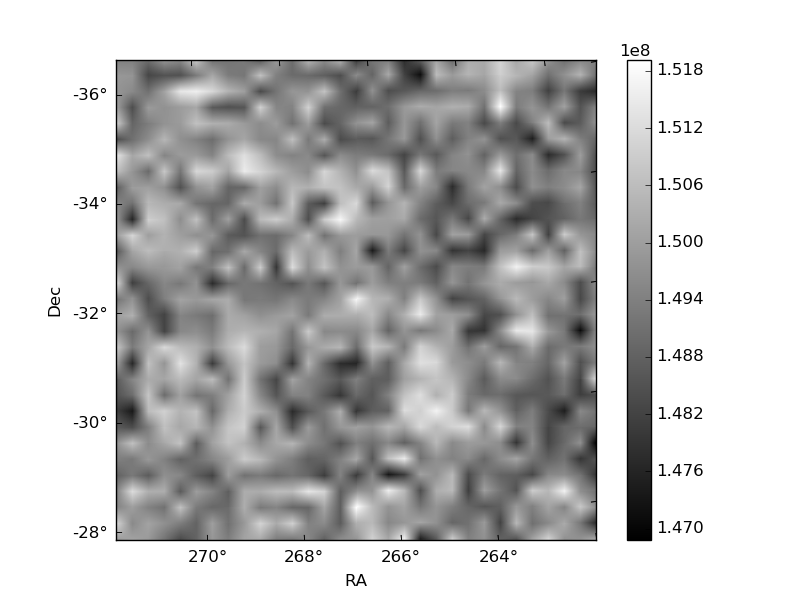
Quadrant B |
|---|---|---|---|
| Quadrant D | 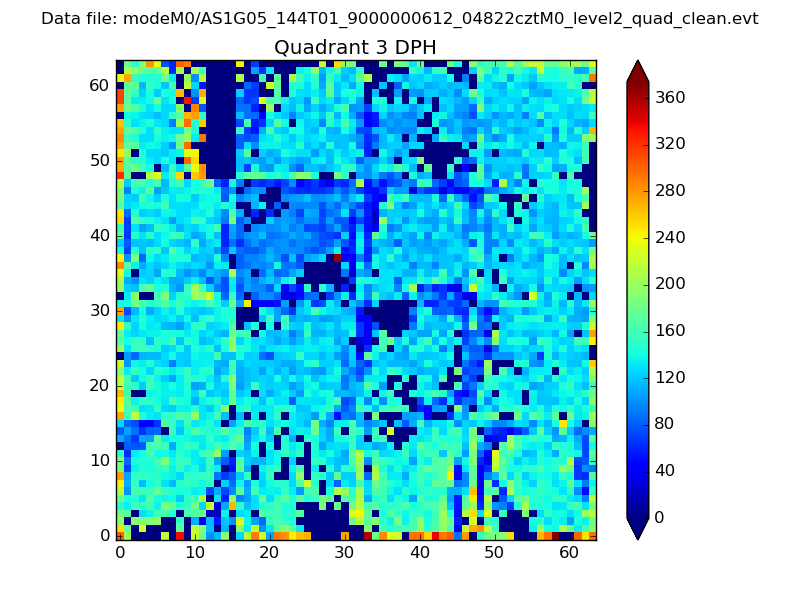 |
 |
Quadrant C |
| Plot type | Count rate plots | Images |
|---|---|---|
| Comparison with Poisson distribution Blue bars denote a histogram of data divided into 1 sec bins. Red curve is a Poisson curve with rate = median count rate of data. |
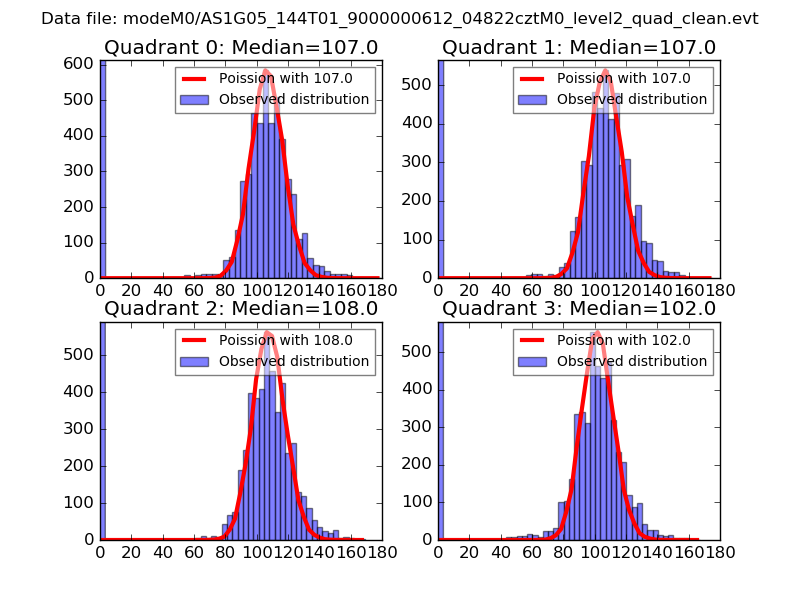 |
 |
| Quadrant-wise count rates Data is divided into 100 sec bins |
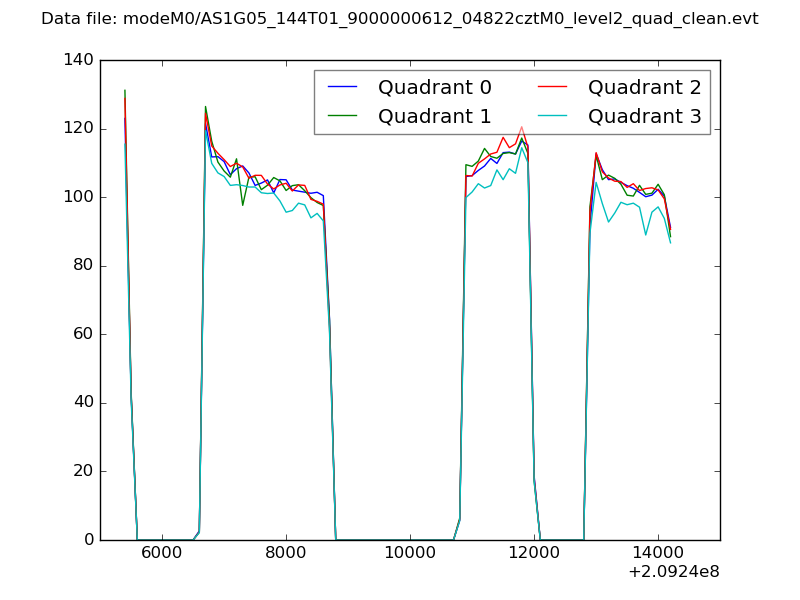 |
|
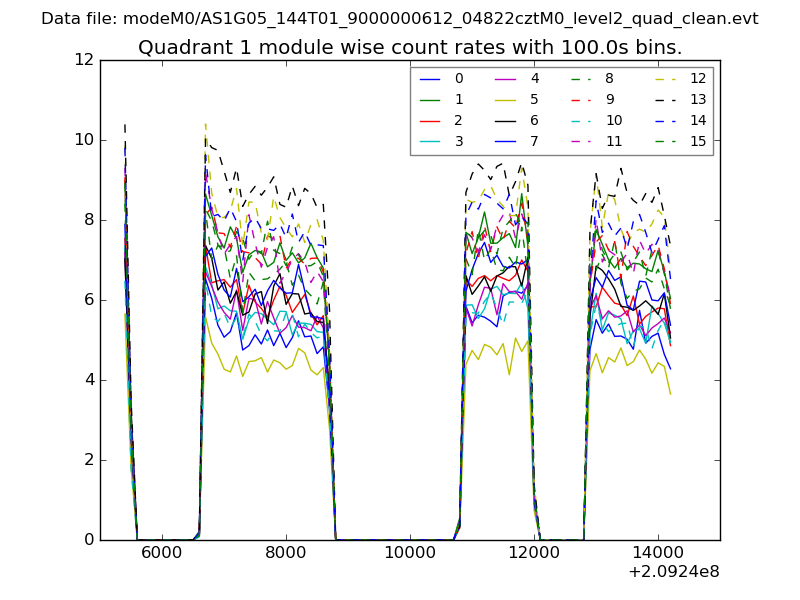
| Module-wise count rates for Quadrant A Data is divided into 100 sec bins |
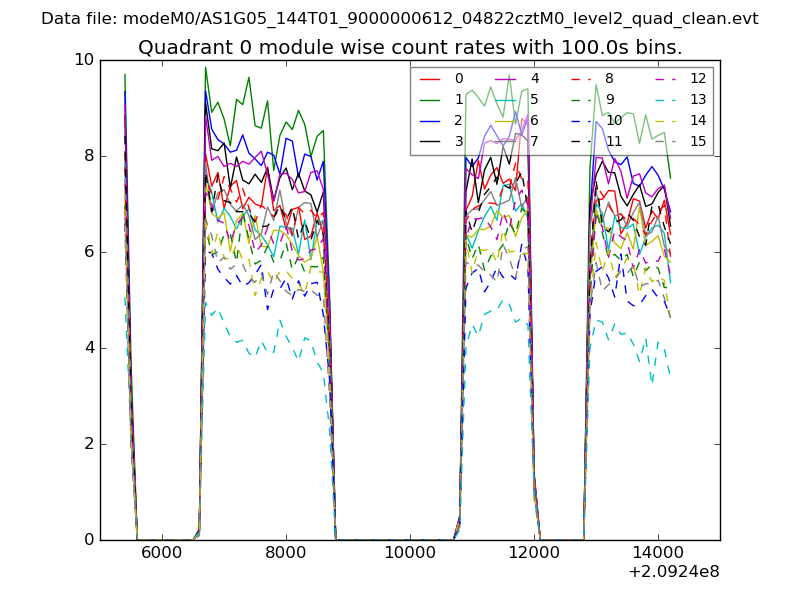 |
 |
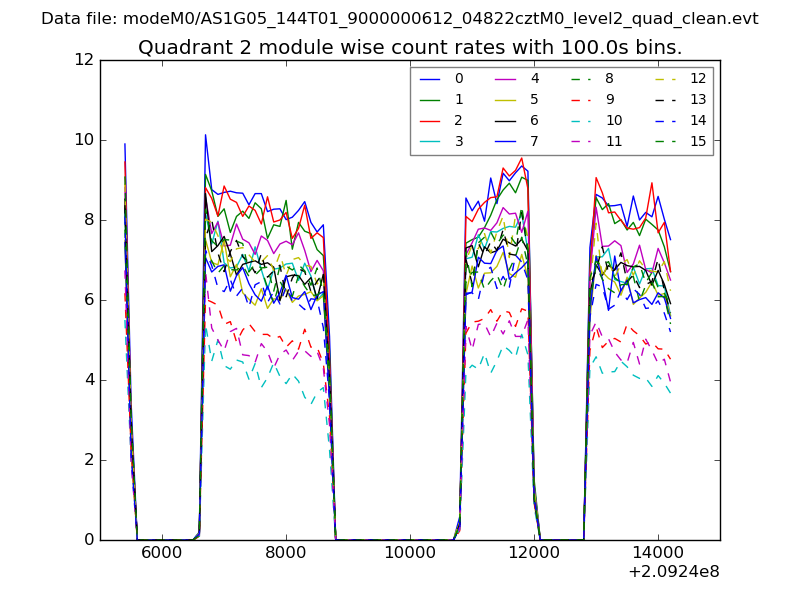
| Module-wise count rates for Quadrant B Data is divided into 100 sec bins |
 |
 |
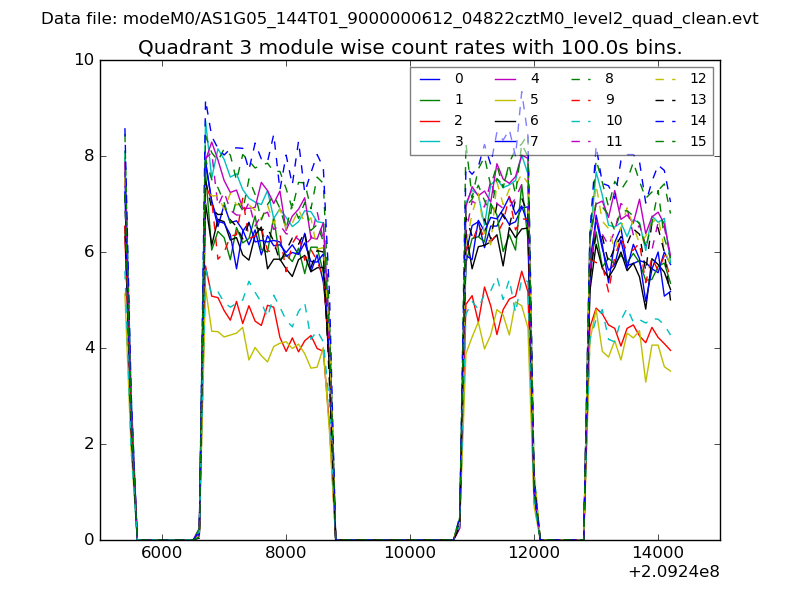
| Module-wise count rates for Quadrant C Data is divided into 100 sec bins |
 |
 |
| Module-wise count rates for Quadrant D Data is divided into 100 sec bins |
 |
 |
| Parameter | Plot |
|---|---|
| CZT HV Monitor | 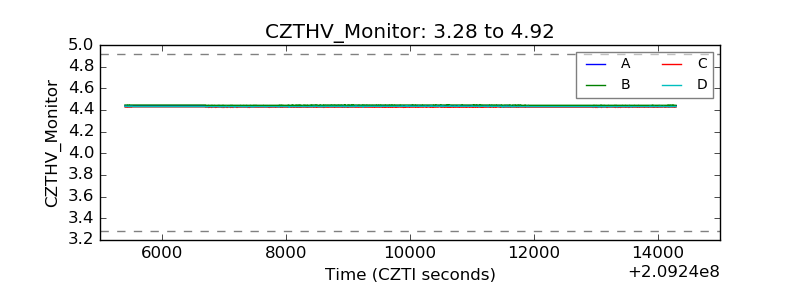 |
| D_VDD | 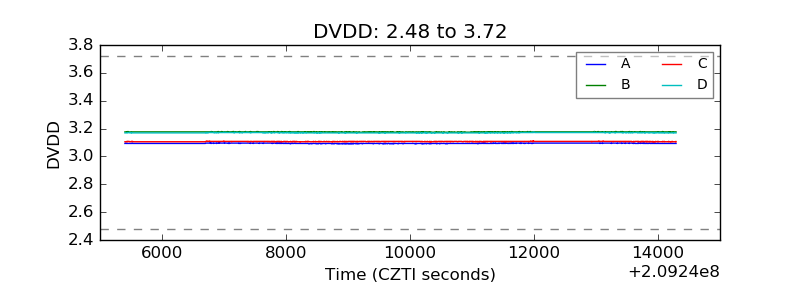 |
| Temperature 1 | 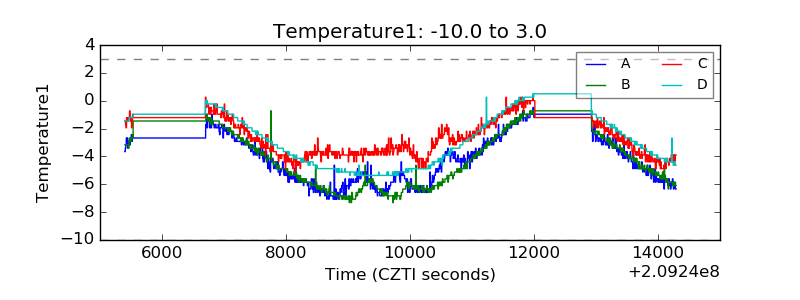 |
| Veto HV Monitor | 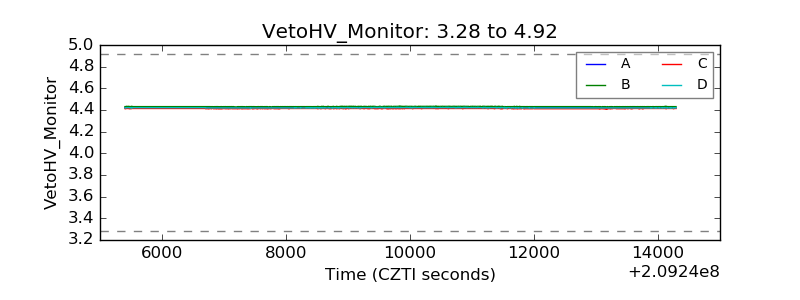 |
| Veto LLD | 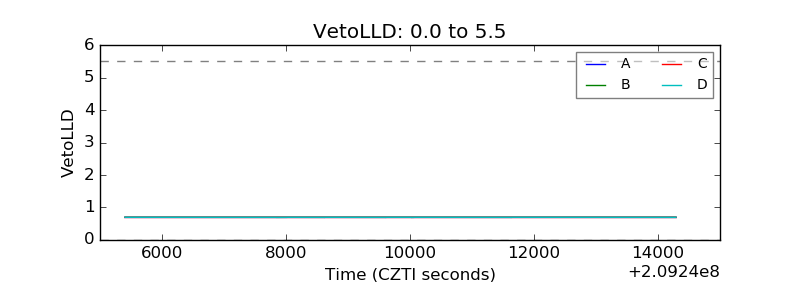 |
| Alpha Counter | 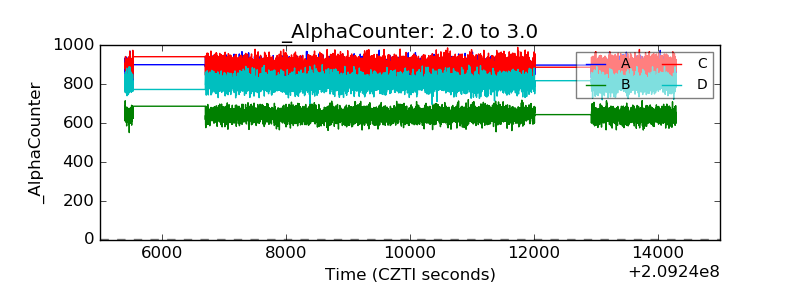 |
| _CPM_Rate | 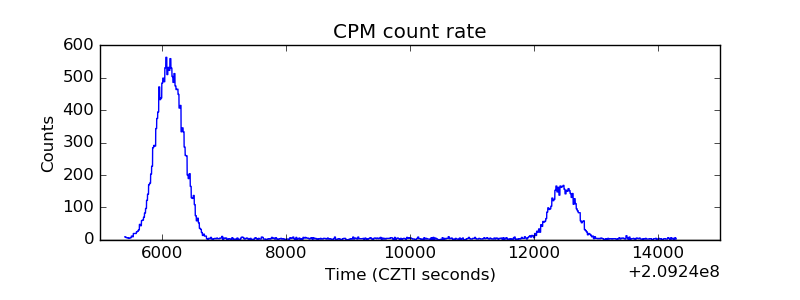 |
| CZT Counter | 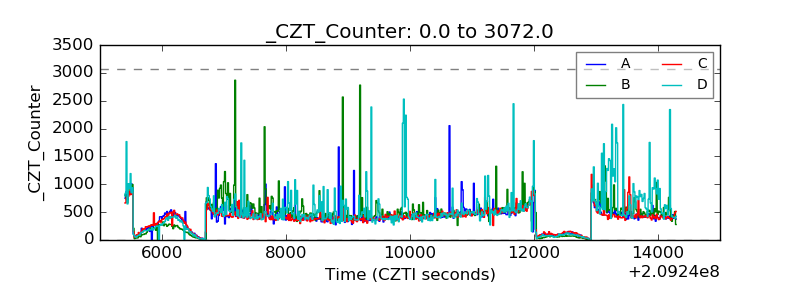 |
| +2.5 Volts monitor |  |
| +5 Volts monitor |  |
| _ROLL_ROT | 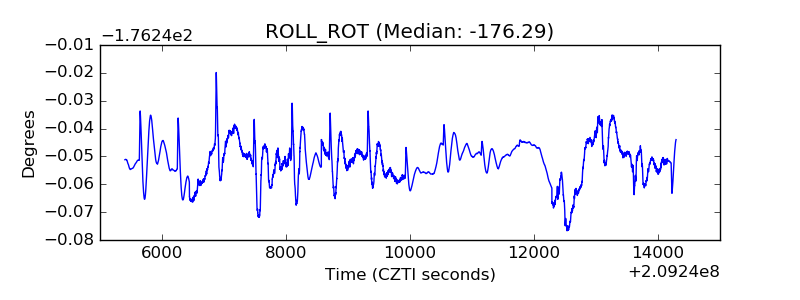 |
| _Roll_DEC | 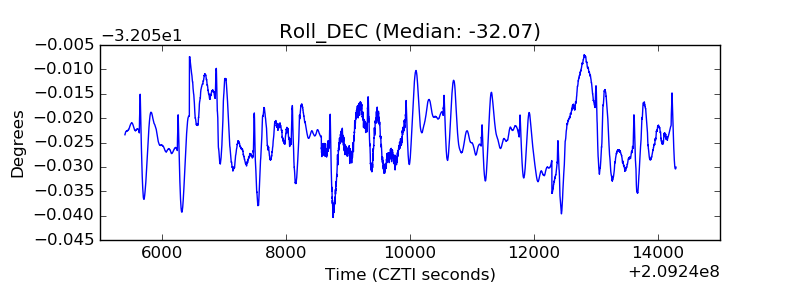 |
| _Roll_RA | 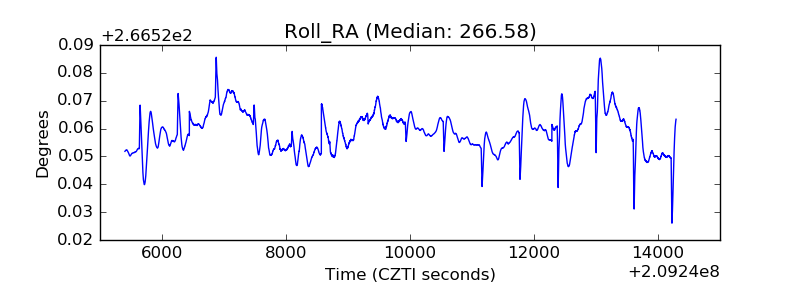 |
| Veto Counter | 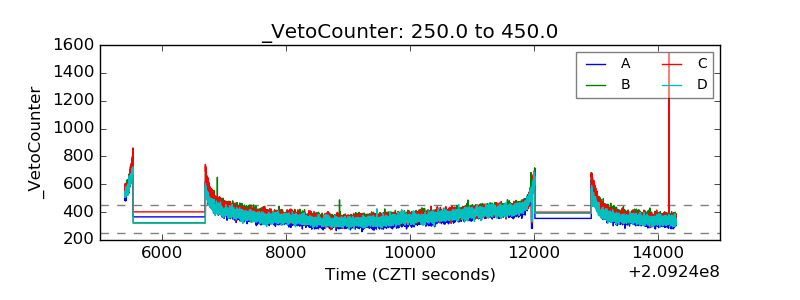 |