| Param | Original file | Final file |
|---|---|---|
| Filename | modeM0/AS1G05_144T01_9000000612_04823cztM0_level2.evt | modeM0/AS1G05_144T01_9000000612_04823cztM0_level2_quad_clean.evt |
| Size (bytes) | 575,628,480 | 89,098,560 |
| Size | 549.0 MB | 85.0 MB |
| Events in quadrant A | 3,970,607 | 549,530 |
| Events in quadrant B | 4,798,106 | 541,066 |
| Events in quadrant C | 3,729,686 | 556,409 |
| Events in quadrant D | 4,425,479 | 528,492 |
| Mode M0 | |||
|---|---|---|---|
| Quadrant | BADHDUFLAG | Total packets | Discarded packets |
| A | 0 | 17080 | 4 |
| B | 0 | 19338 | 3 |
| C | 0 | 16444 | 3 |
| D | 0 | 18519 | 3 |
| Mode M9 | |||
|---|---|---|---|
| Quadrant | BADHDUFLAG | Total packets | Discarded packets |
| A | 0 | 14 | 0 |
| B | 0 | 14 | 0 |
| C | 0 | 14 | 0 |
| D | 0 | 14 | 0 |
| Mode SS | |||
|---|---|---|---|
| Quadrant | BADHDUFLAG | Total packets | Discarded packets |
| A | 0 | 156 | 0 |
| B | 0 | 156 | 0 |
| C | 0 | 156 | 0 |
| D | 0 | 156 | 0 |
| Quadrant | Total seconds | Saturated seconds | Saturation percentage |
|---|---|---|---|
| A | 7500 | 251 | 3.346667% |
| B | 7500 | 328 | 4.373333% |
| C | 7500 | 57 | 0.760000% |
| D | 7500 | 157 | 2.093333% |
Noise dominated data is calculated using 1-second bins in cleaned event files. If a bin has >2000 counts, and if more than 50% of those come from <1% of pixels, then it is considered to be noise-dominated and hence unusable.
| Quadrant | # 1 sec bins | Bins with >0 counts | Bins with >2000 counts | High rate bins dominated by noise | Noise dominated (total time) | Noise dominated (detector-on time) | Marked lightcurve |
|---|---|---|---|---|---|---|---|
| A | 8955 | 7503 | 93 | 93 | 1.04% | 1.24% | 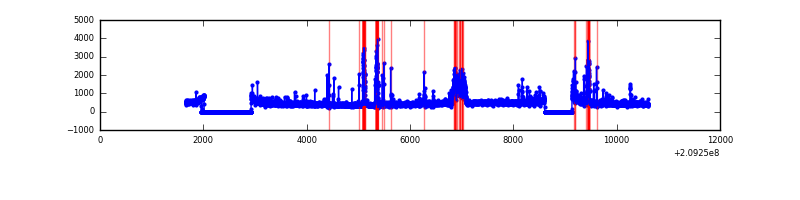 |
| B | 8955 | 7503 | 200 | 200 | 2.23% | 2.67% | 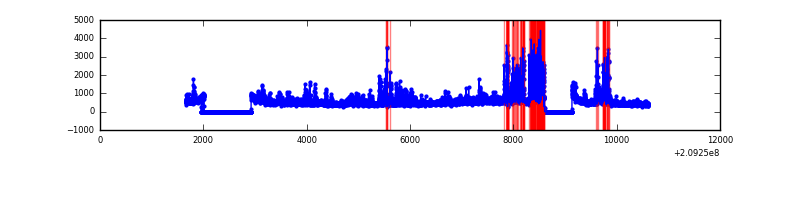 |
| C | 8955 | 7503 | 19 | 19 | 0.21% | 0.25% | 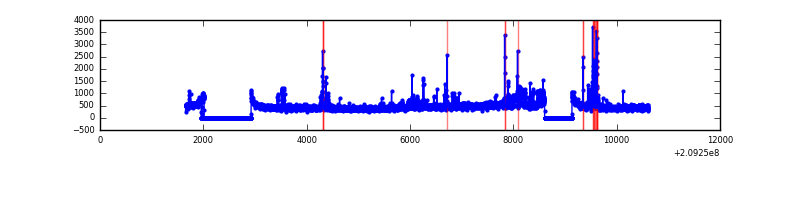 |
| D | 8955 | 7503 | 117 | 117 | 1.31% | 1.56% | 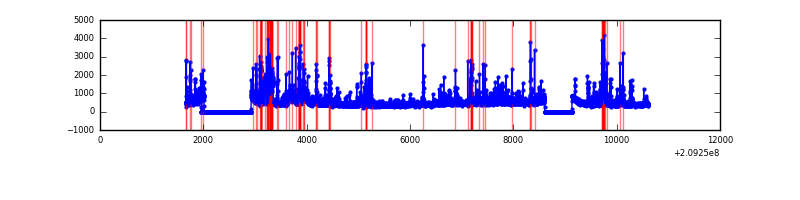 |
Top three noisy pixels from each quadrant. If the there are fewer than three noisy pixels in the level2.evt file, extra rows are filled as -1
| Pixel properties | Quadrant properties | ||||||
|---|---|---|---|---|---|---|---|
| Quadrant | DetID | PixID | Counts | Sigma | Mean | Median | Sigma |
| A | 0 | 50 | 444553 | 2487.31 | 859 | 839 | 178.4 |
| A | 13 | 251 | 90859 | 504.62 | 859 | 839 | 178.4 |
| A | 0 | 149 | 63711 | 352.44 | 859 | 839 | 178.4 |
| B | 10 | 16 | 923595 | 5509.2 | 863 | 841 | 167.5 |
| B | 8 | 3 | 172358 | 1024.02 | 863 | 841 | 167.5 |
| B | 14 | 167 | 155649 | 924.26 | 863 | 841 | 167.5 |
| C | 8 | 208 | 249923 | 1269.57 | 838 | 840 | 196.2 |
| C | 9 | 247 | 170497 | 864.74 | 838 | 840 | 196.2 |
| C | 12 | 4 | 28343 | 140.18 | 838 | 840 | 196.2 |
| D | 13 | 235 | 327731 | 1609.8 | 830 | 805 | 203.1 |
| D | 2 | 136 | 289323 | 1420.67 | 830 | 805 | 203.1 |
| D | 5 | 239 | 281259 | 1380.97 | 830 | 805 | 203.1 |
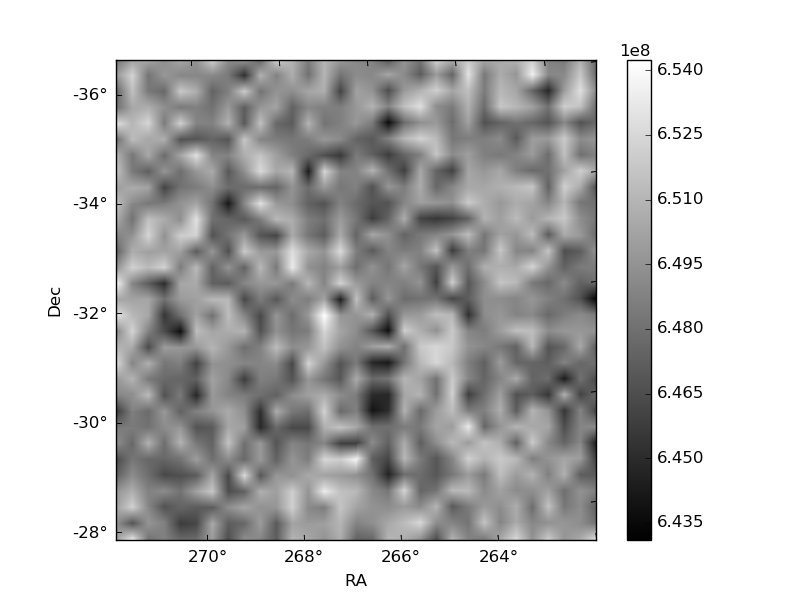
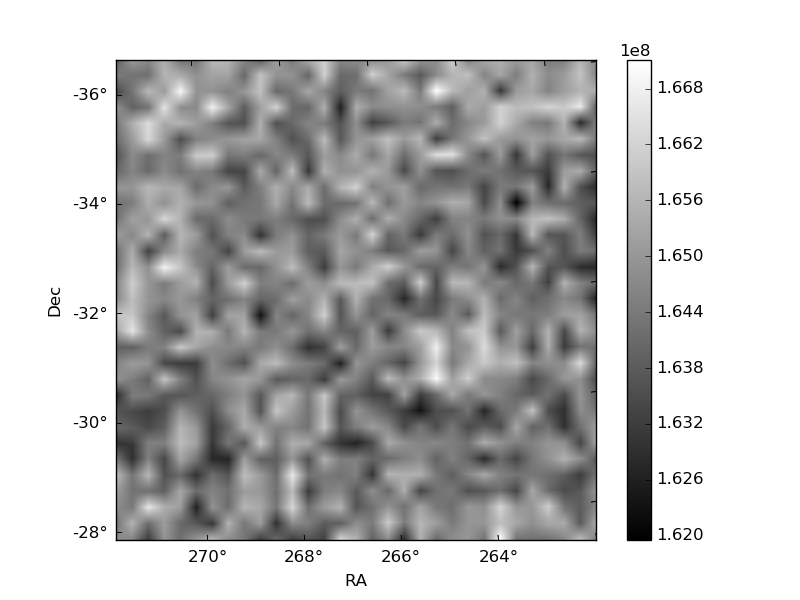
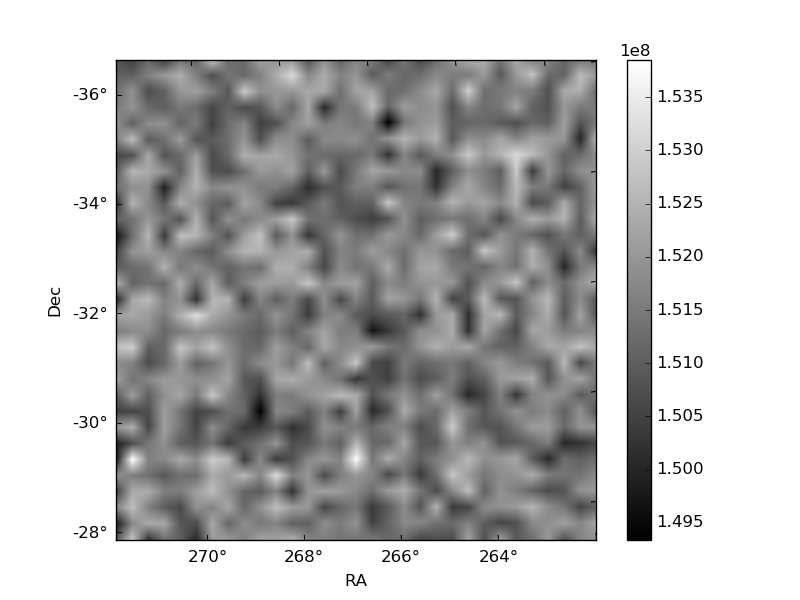
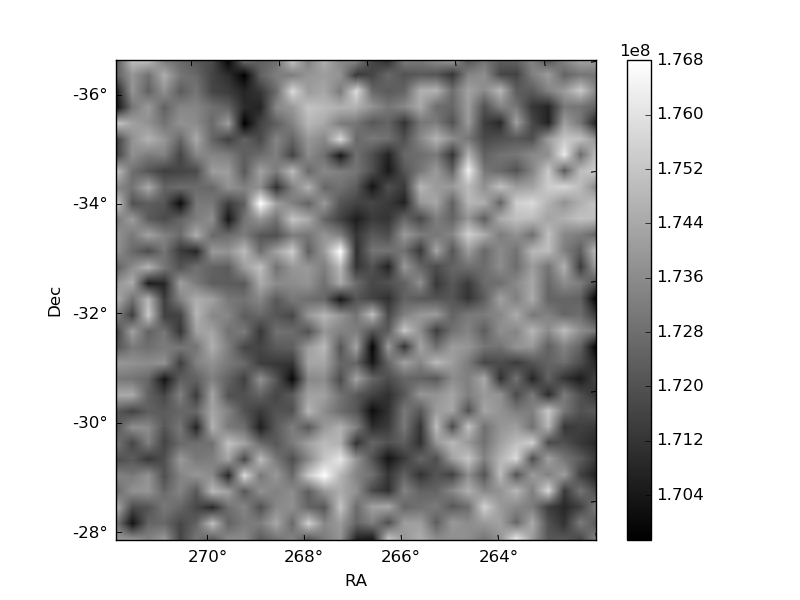
Histogram calculated using DETX and DETY for each event in the final _common_clean file
| Quadrant A | 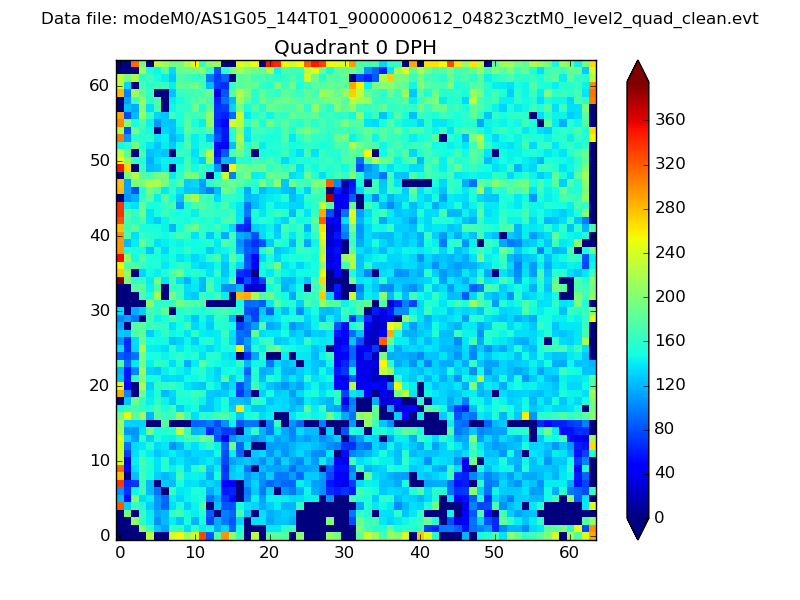 |
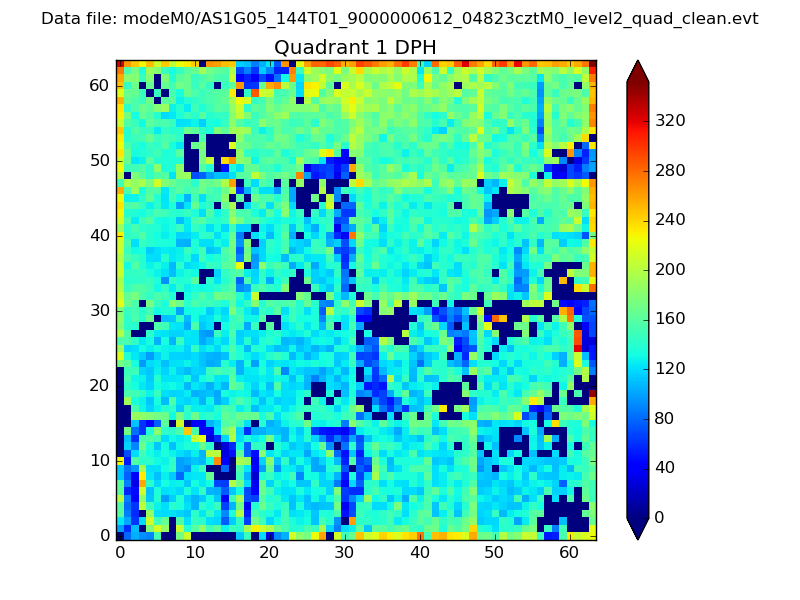 |
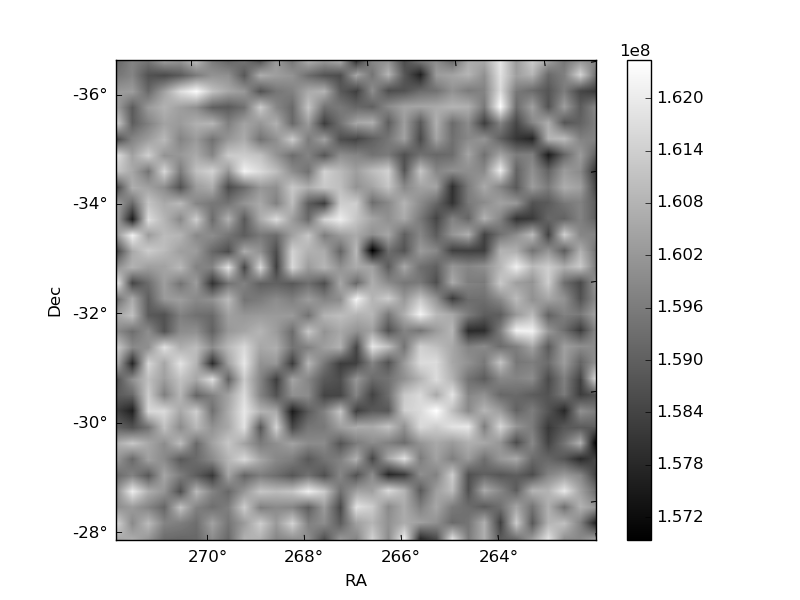
Quadrant B |
|---|---|---|---|
| Quadrant D | 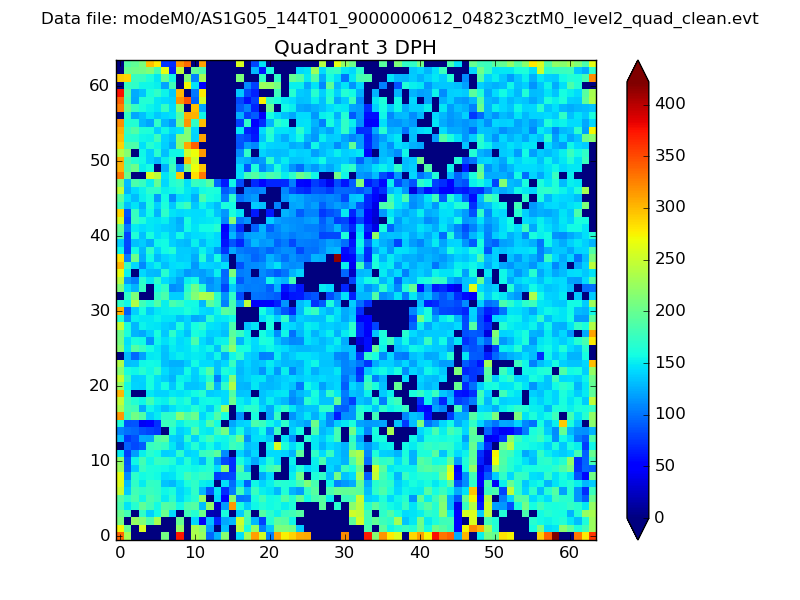 |
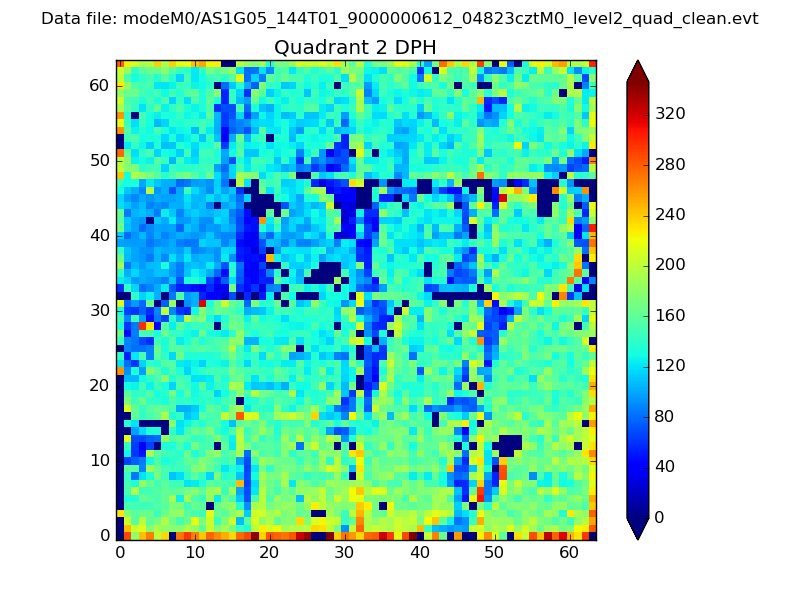 |
Quadrant C |
| Plot type | Count rate plots | Images |
|---|---|---|
| Comparison with Poisson distribution Blue bars denote a histogram of data divided into 1 sec bins. Red curve is a Poisson curve with rate = median count rate of data. |
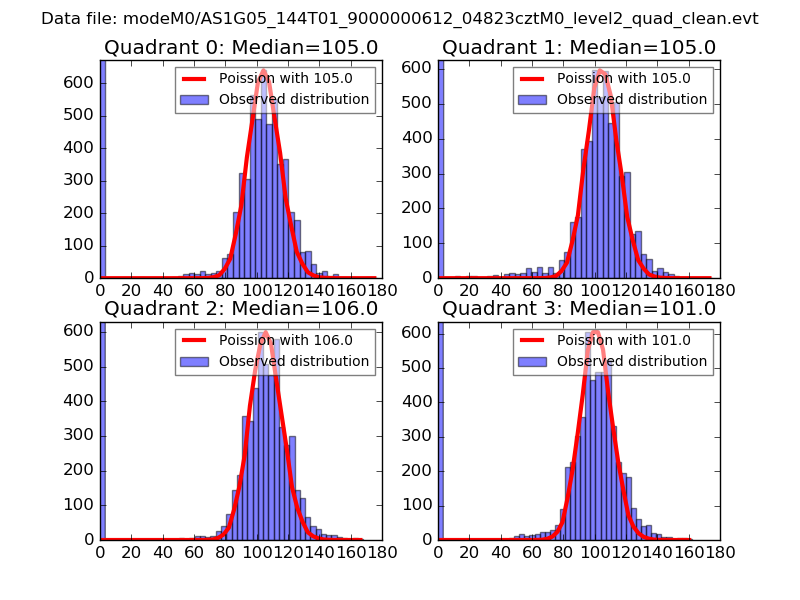 |
 |
| Quadrant-wise count rates Data is divided into 100 sec bins |
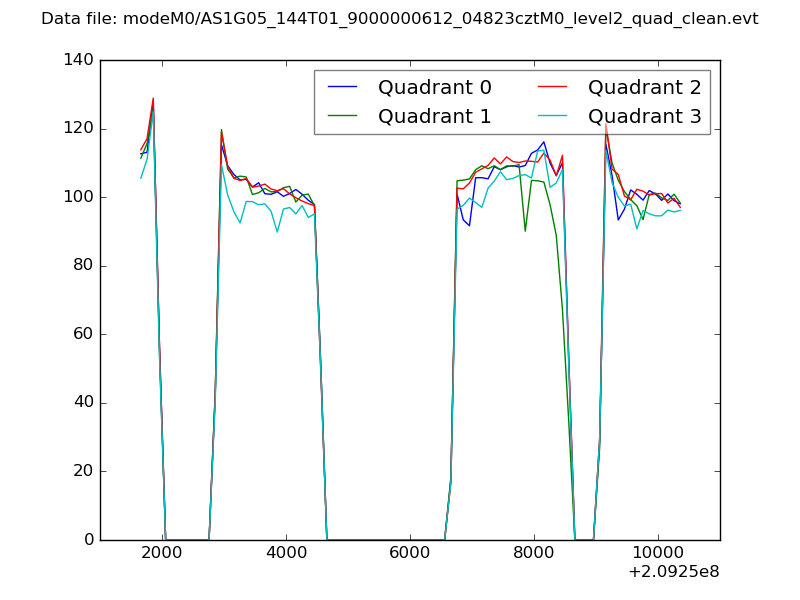 |
|
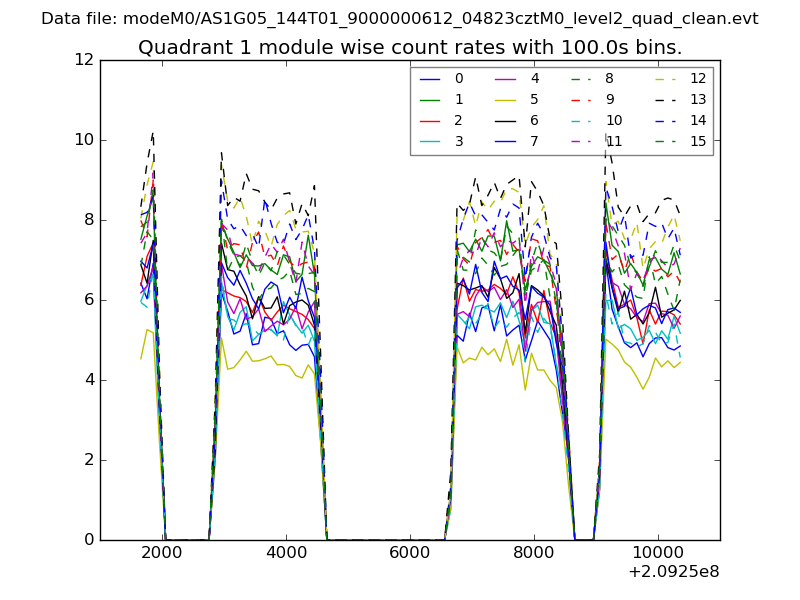
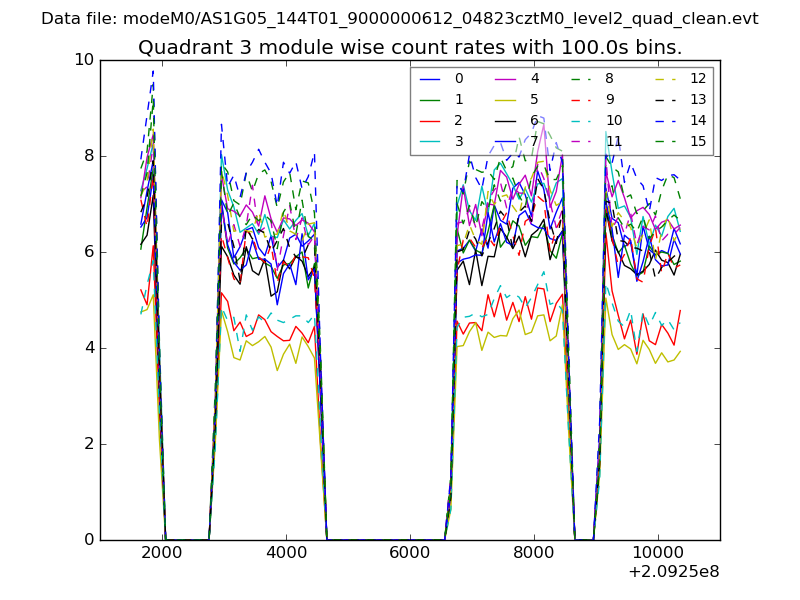
| Module-wise count rates for Quadrant A Data is divided into 100 sec bins |
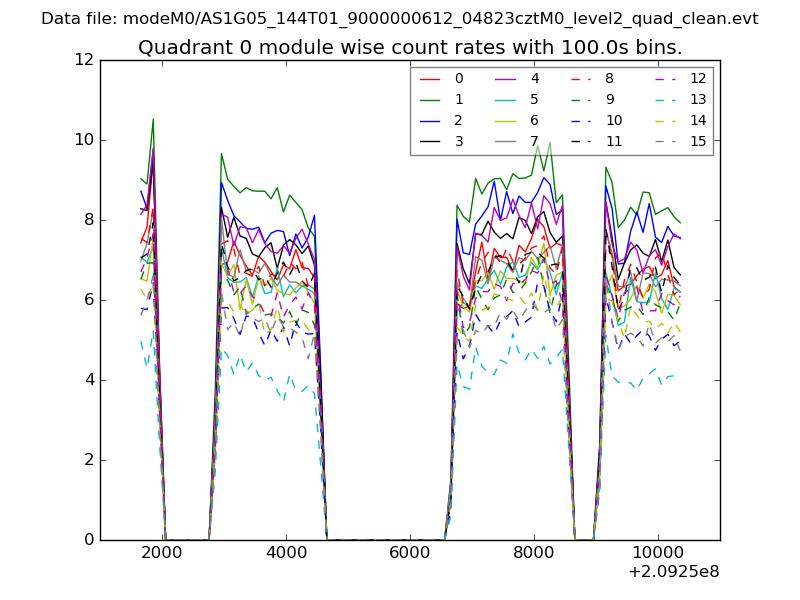 |
 |
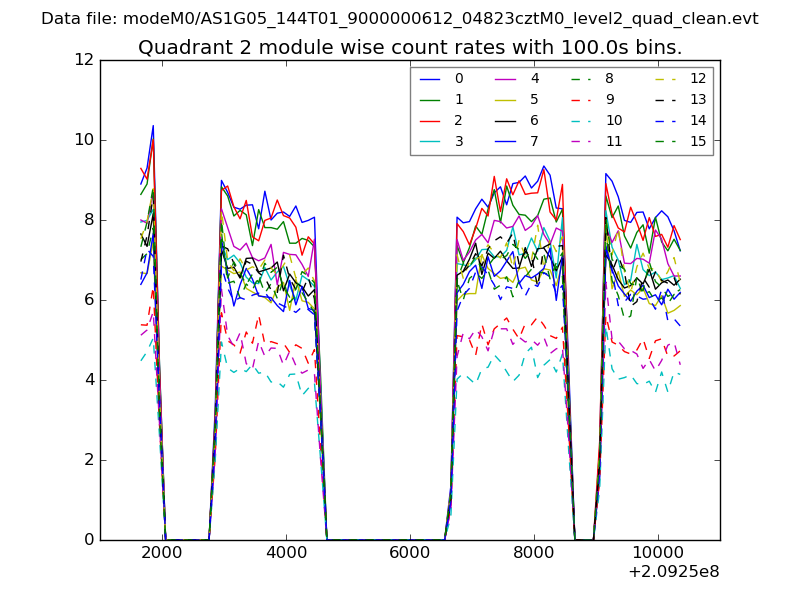
| Module-wise count rates for Quadrant B Data is divided into 100 sec bins |
 |
 |
| Module-wise count rates for Quadrant C Data is divided into 100 sec bins |
 |
 |
| Module-wise count rates for Quadrant D Data is divided into 100 sec bins |
 |
 |
| Parameter | Plot |
|---|---|
| CZT HV Monitor | 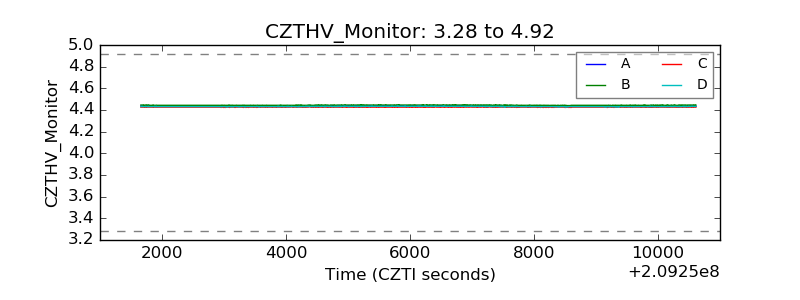 |
| D_VDD | 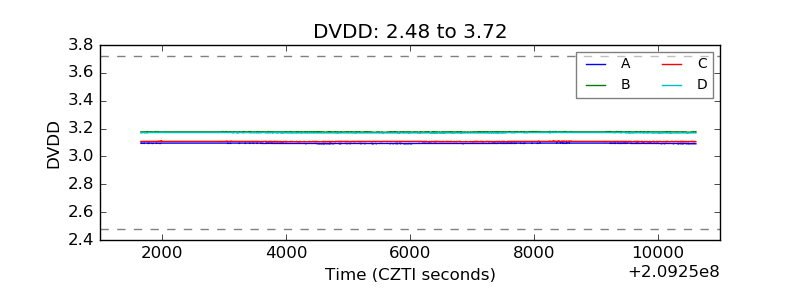 |
| Temperature 1 | 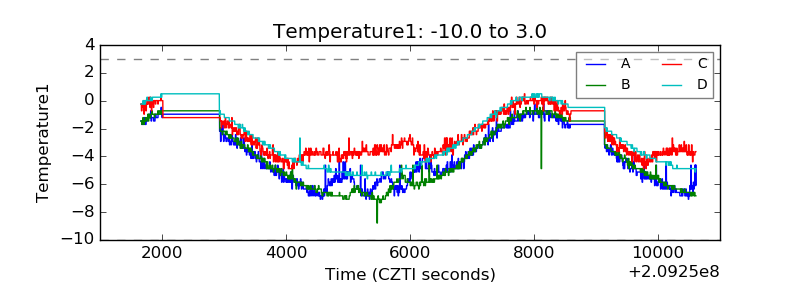 |
| Veto HV Monitor | 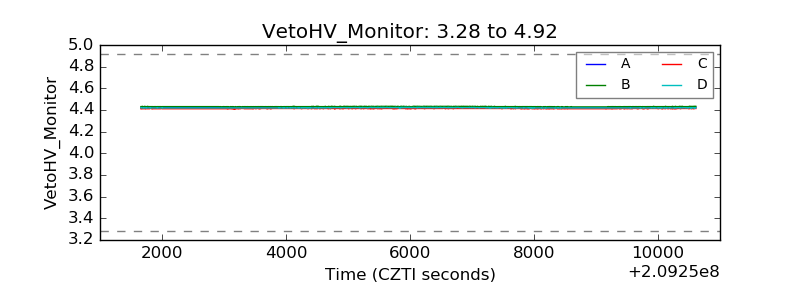 |
| Veto LLD | 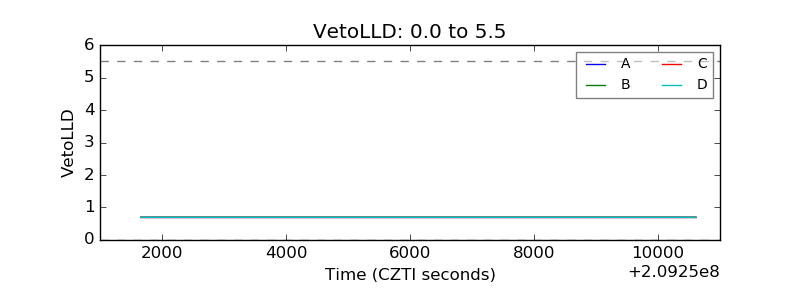 |
| Alpha Counter | 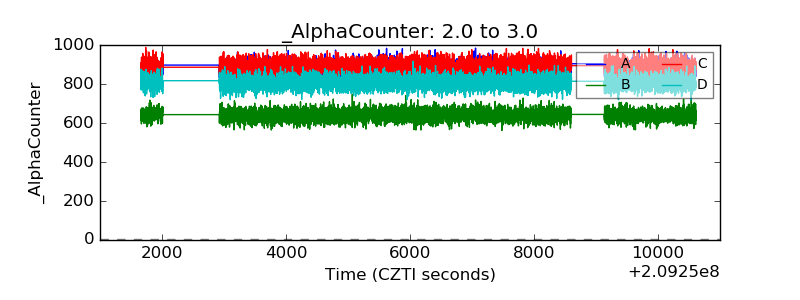 |
| _CPM_Rate | 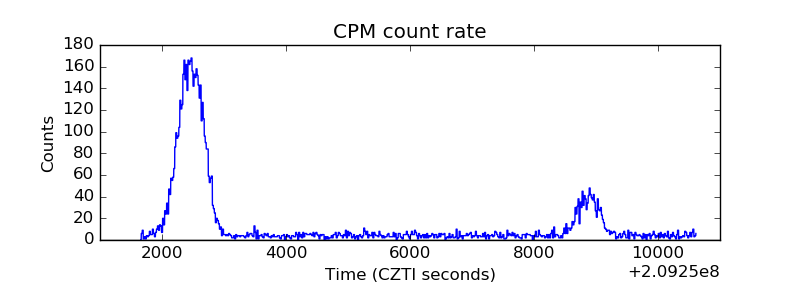 |
| CZT Counter | 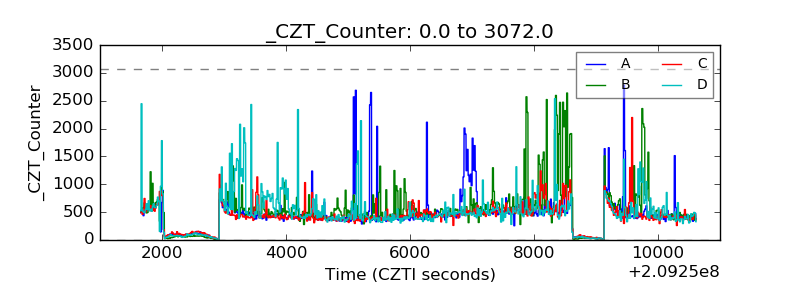 |
| +2.5 Volts monitor | 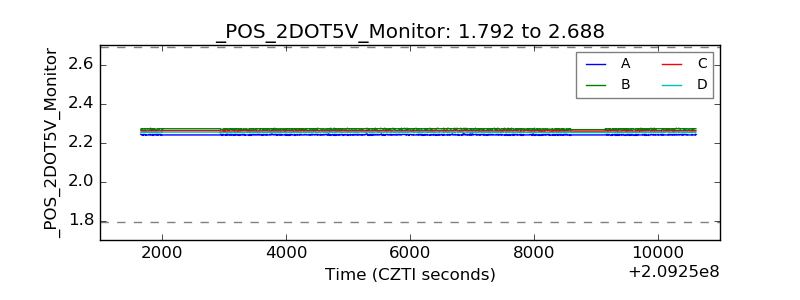 |
| +5 Volts monitor | 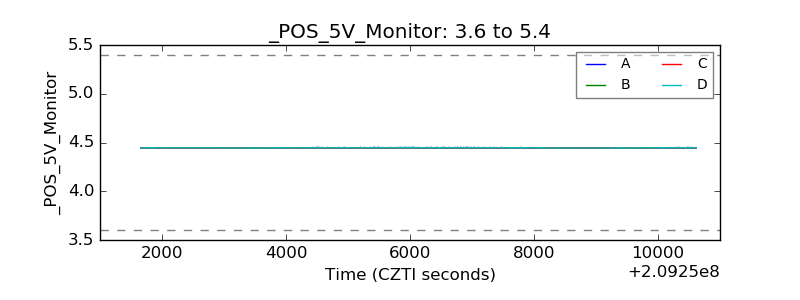 |
| _ROLL_ROT | 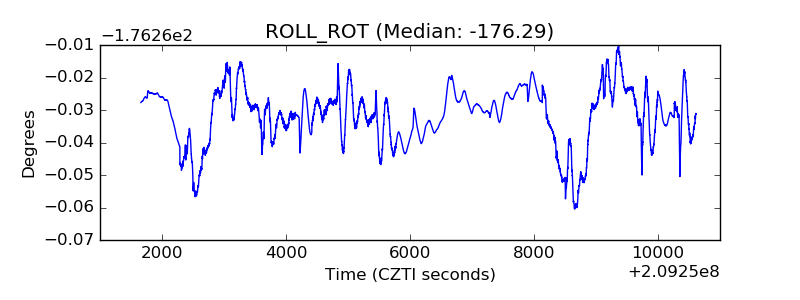 |
| _Roll_DEC | 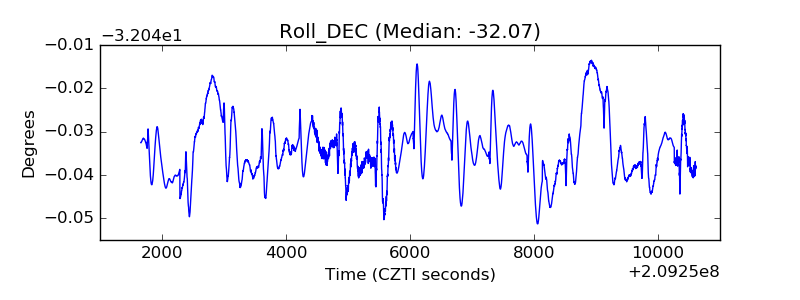 |
| _Roll_RA | 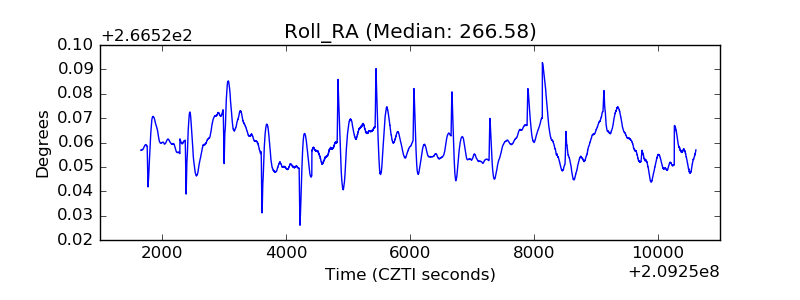 |
| Veto Counter | 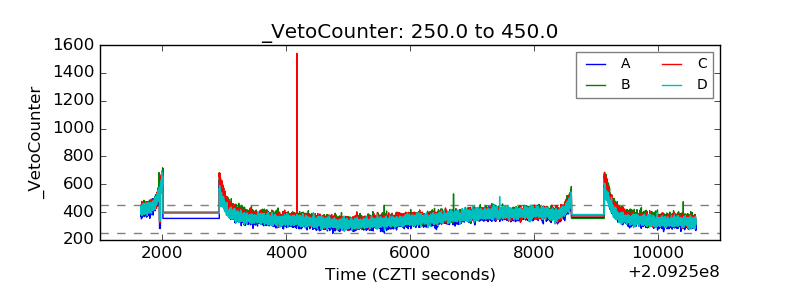 |