| Param | Original file | Final file |
|---|---|---|
| Filename | modeM0/AS1G05_144T01_9000000612_04825cztM0_level2.evt | modeM0/AS1G05_144T01_9000000612_04825cztM0_level2_quad_clean.evt |
| Size (bytes) | 587,511,360 | 75,015,360 |
| Size | 560.3 MB | 71.5 MB |
| Events in quadrant A | 3,613,577 | 447,094 |
| Events in quadrant B | 5,373,146 | 422,881 |
| Events in quadrant C | 3,837,820 | 449,638 |
| Events in quadrant D | 4,457,246 | 426,965 |
| Mode M0 | |||
|---|---|---|---|
| Quadrant | BADHDUFLAG | Total packets | Discarded packets |
| A | 0 | 16180 | 3 |
| B | 0 | 21216 | 2 |
| C | 0 | 16459 | 2 |
| D | 0 | 18680 | 2 |
| Mode M9 | |||
|---|---|---|---|
| Quadrant | BADHDUFLAG | Total packets | Discarded packets |
| A | 0 | 5 | 0 |
| B | 0 | 5 | 0 |
| C | 0 | 5 | 0 |
| D | 0 | 6 | 0 |
| Mode SS | |||
|---|---|---|---|
| Quadrant | BADHDUFLAG | Total packets | Discarded packets |
| A | 0 | 152 | 0 |
| B | 0 | 152 | 0 |
| C | 0 | 152 | 0 |
| D | 0 | 152 | 0 |
| Quadrant | Total seconds | Saturated seconds | Saturation percentage |
|---|---|---|---|
| A | 7540 | 88 | 1.167109% |
| B | 7540 | 576 | 7.639257% |
| C | 7540 | 94 | 1.246684% |
| D | 7540 | 240 | 3.183024% |
Noise dominated data is calculated using 1-second bins in cleaned event files. If a bin has >2000 counts, and if more than 50% of those come from <1% of pixels, then it is considered to be noise-dominated and hence unusable.
| Quadrant | # 1 sec bins | Bins with >0 counts | Bins with >2000 counts | High rate bins dominated by noise | Noise dominated (total time) | Noise dominated (detector-on time) | Marked lightcurve |
|---|---|---|---|---|---|---|---|
| A | 7840 | 7541 | 9 | 9 | 0.11% | 0.12% | 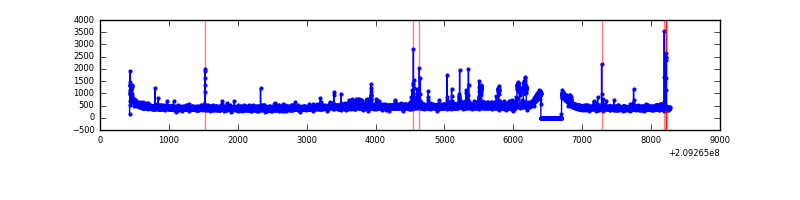 |
| B | 7840 | 7541 | 377 | 377 | 4.81% | 5.00% | 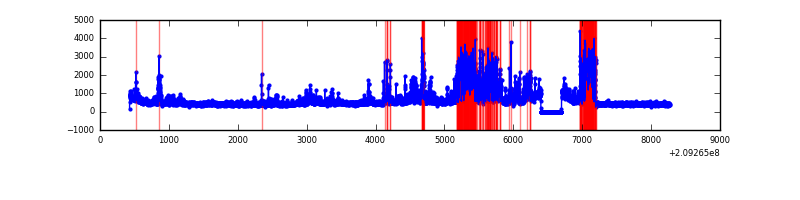 |
| C | 7840 | 7541 | 21 | 21 | 0.27% | 0.28% | 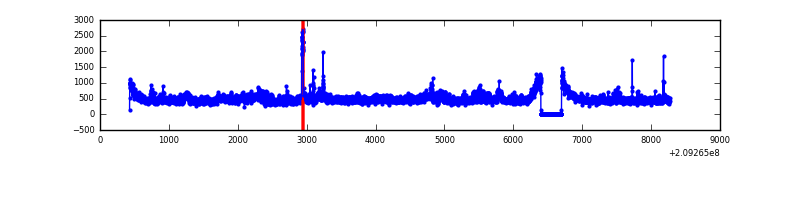 |
| D | 7840 | 7541 | 155 | 155 | 1.98% | 2.06% | 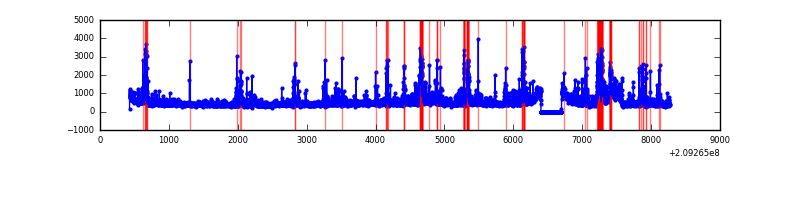 |
Top three noisy pixels from each quadrant. If the there are fewer than three noisy pixels in the level2.evt file, extra rows are filled as -1
| Pixel properties | Quadrant properties | ||||||
|---|---|---|---|---|---|---|---|
| Quadrant | DetID | PixID | Counts | Sigma | Mean | Median | Sigma |
| A | 13 | 251 | 214956 | 1209.88 | 861 | 841 | 177.0 |
| A | 0 | 50 | 41908 | 232.05 | 861 | 841 | 177.0 |
| A | 8 | 15 | 25418 | 138.88 | 861 | 841 | 177.0 |
| B | 10 | 16 | 1468422 | 8847.66 | 853 | 833 | 165.9 |
| B | 8 | 3 | 399401 | 2402.85 | 853 | 833 | 165.9 |
| B | 14 | 167 | 75812 | 452.03 | 853 | 833 | 165.9 |
| C | 8 | 208 | 465278 | 2339.78 | 840 | 843 | 198.5 |
| C | 9 | 247 | 71442 | 355.67 | 840 | 843 | 198.5 |
| C | 12 | 4 | 12044 | 56.43 | 840 | 843 | 198.5 |
| D | 12 | 22 | 314834 | 1547.16 | 826 | 800 | 203.0 |
| D | 7 | 237 | 261483 | 1284.32 | 826 | 800 | 203.0 |
| D | 13 | 235 | 249619 | 1225.87 | 826 | 800 | 203.0 |
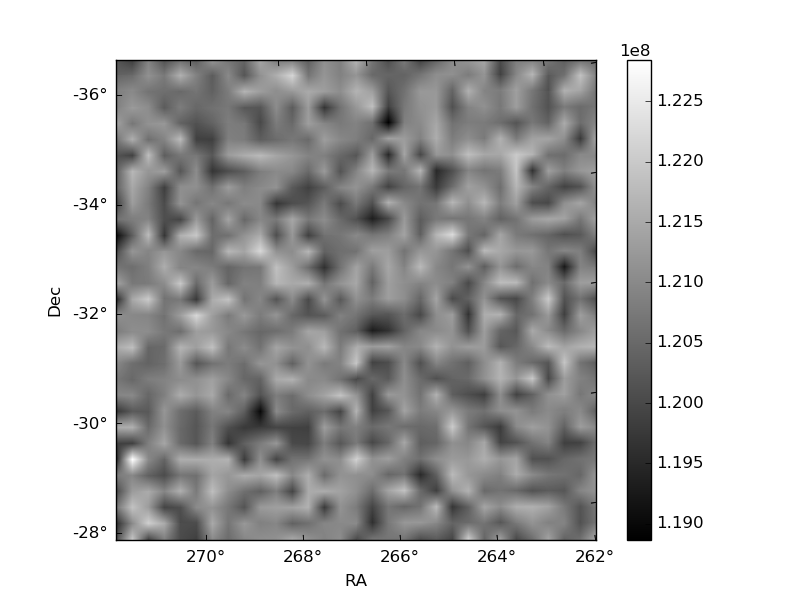
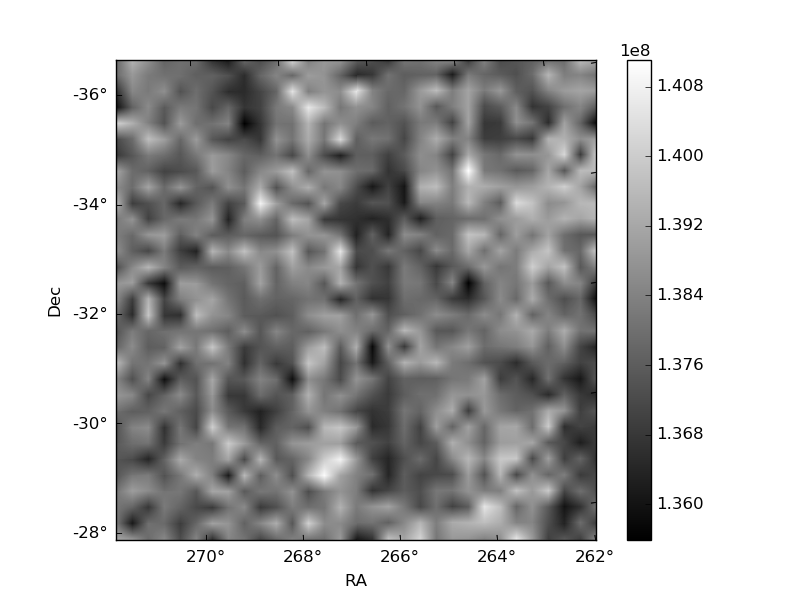
Histogram calculated using DETX and DETY for each event in the final _common_clean file
| Quadrant A | 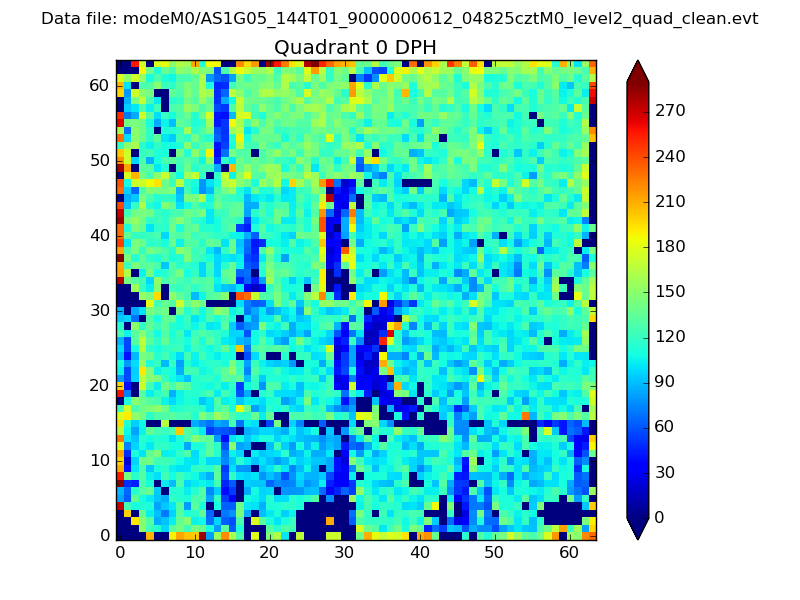 |
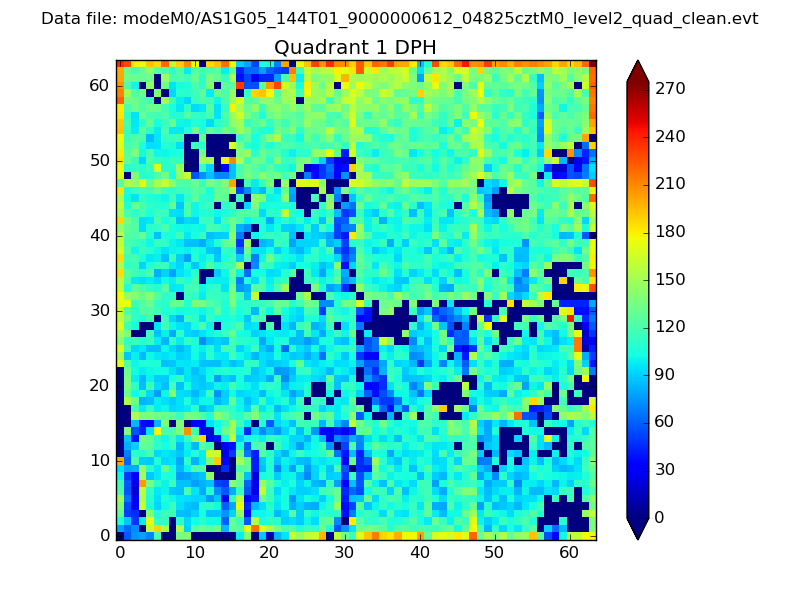 |
Quadrant B |
|---|---|---|---|
| Quadrant D | 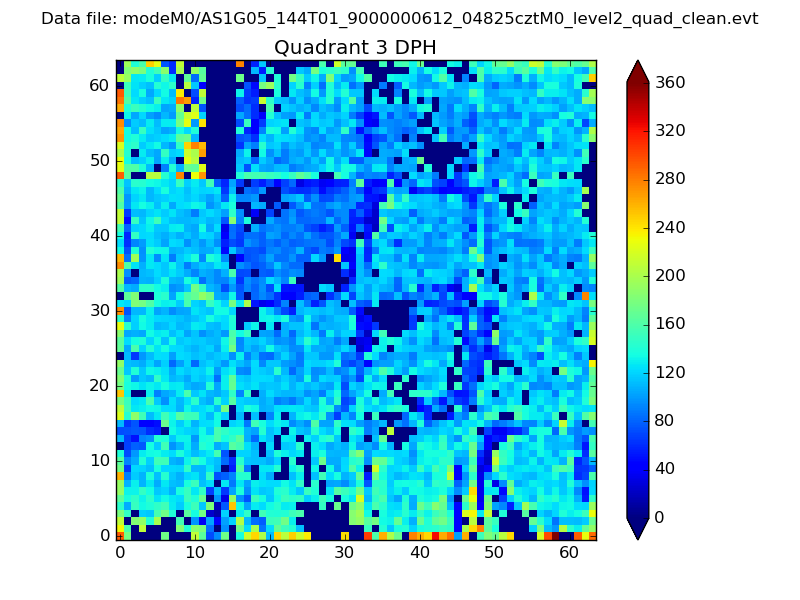 |
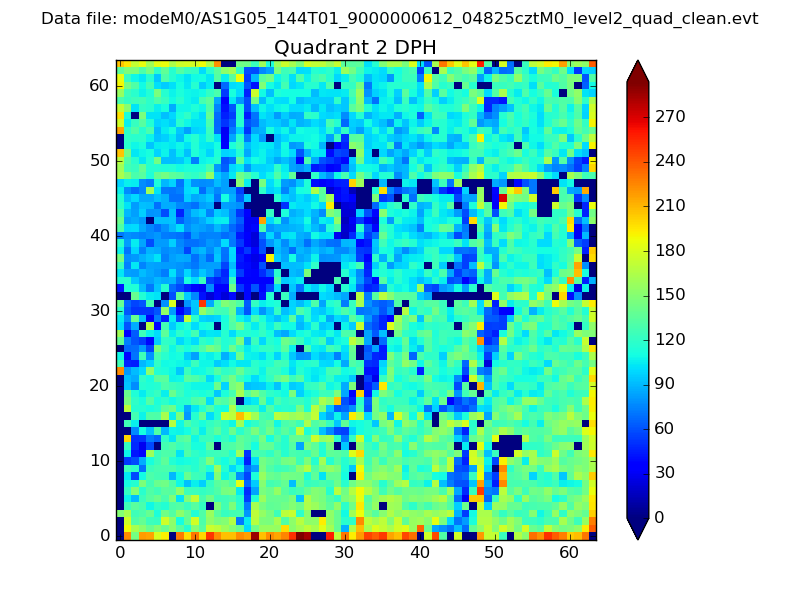 |
Quadrant C |
| Plot type | Count rate plots | Images |
|---|---|---|
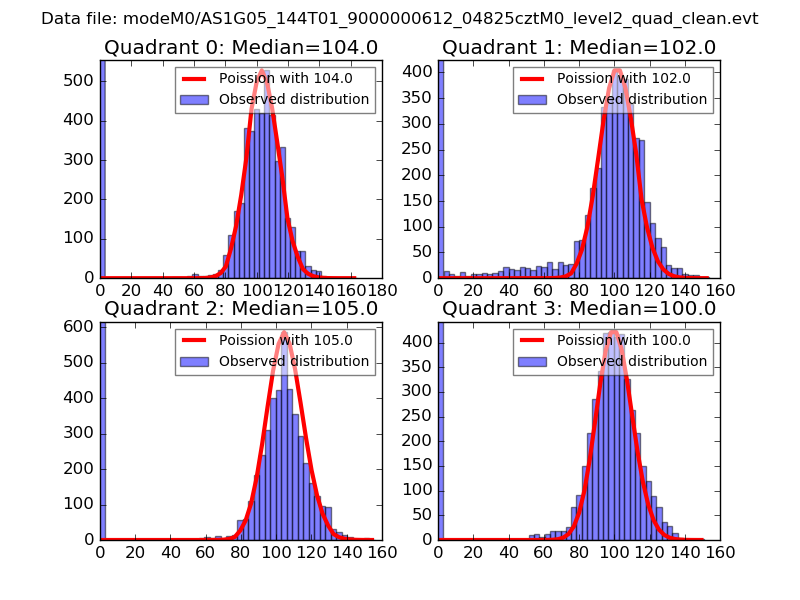
| Comparison with Poisson distribution Blue bars denote a histogram of data divided into 1 sec bins. Red curve is a Poisson curve with rate = median count rate of data. |
 |
 |
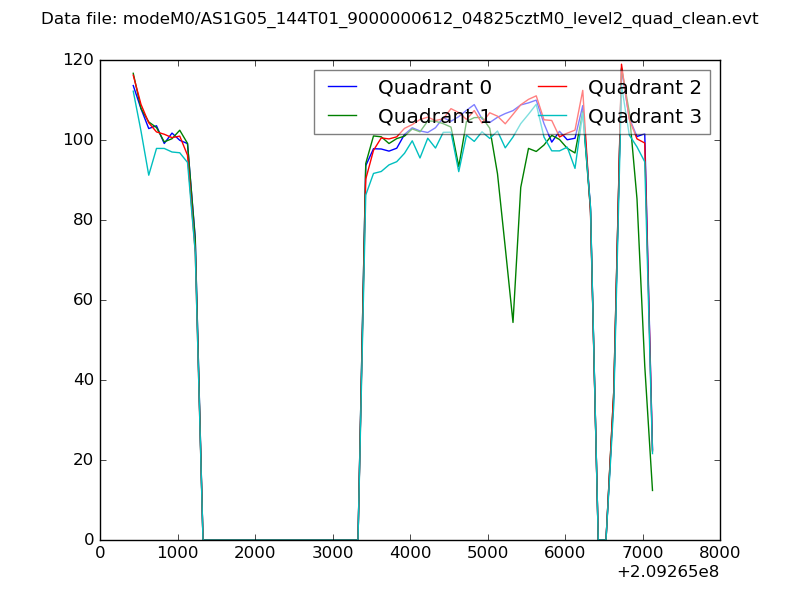
| Quadrant-wise count rates Data is divided into 100 sec bins |
 |
|
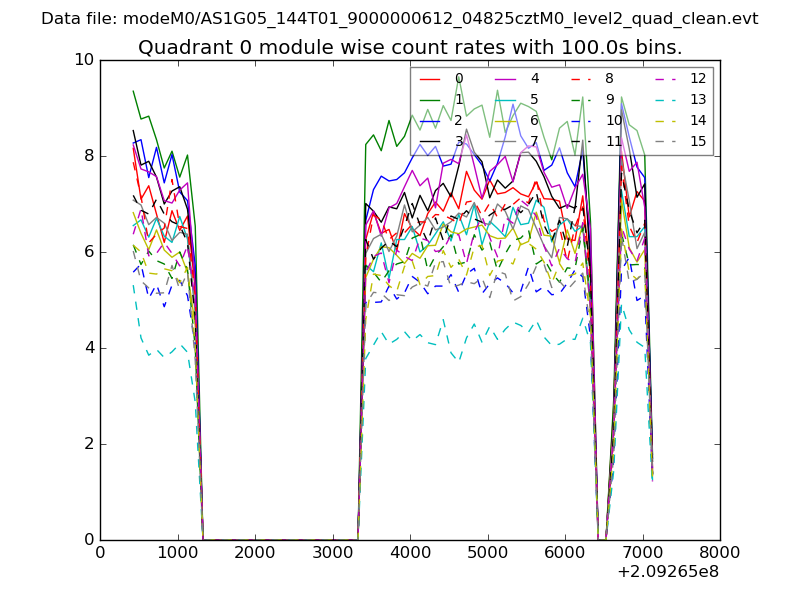
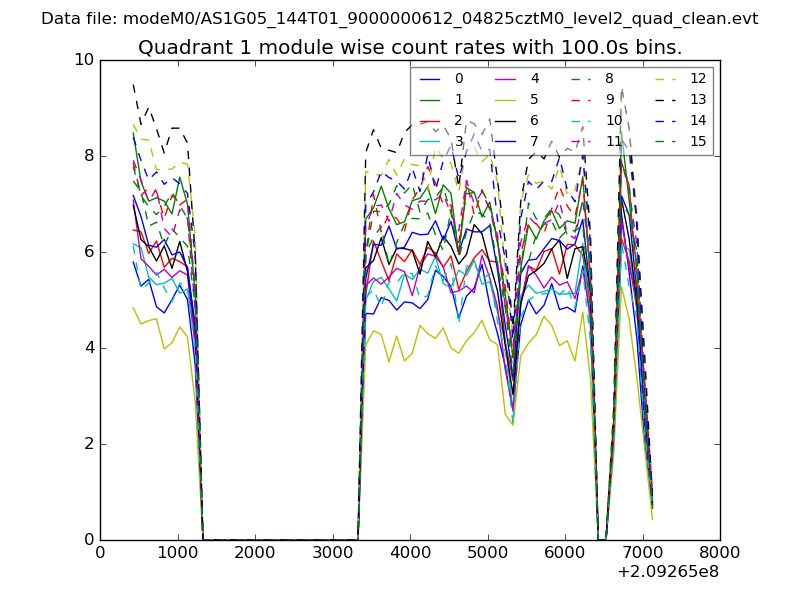
| Module-wise count rates for Quadrant A Data is divided into 100 sec bins |
 |
 |
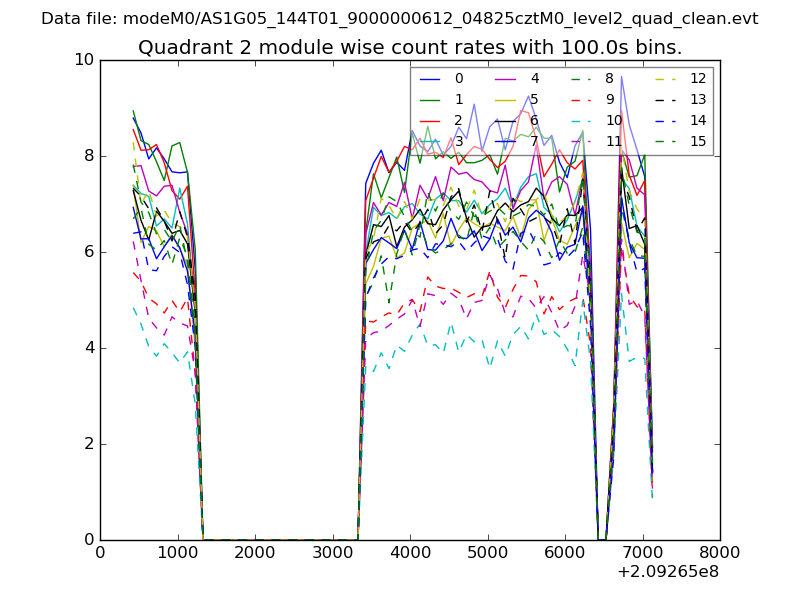
| Module-wise count rates for Quadrant B Data is divided into 100 sec bins |
 |
 |
| Module-wise count rates for Quadrant C Data is divided into 100 sec bins |
 |
 |
| Module-wise count rates for Quadrant D Data is divided into 100 sec bins |
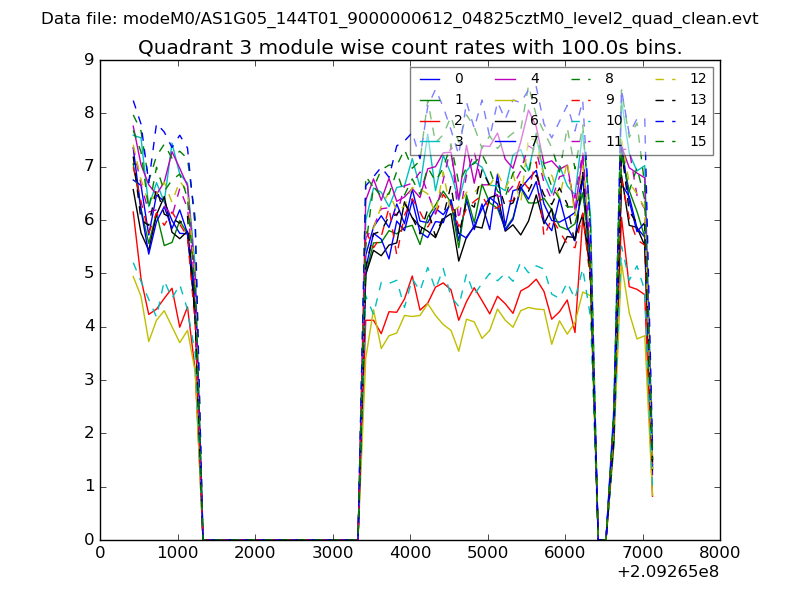 |
 |
| Parameter | Plot |
|---|---|
| CZT HV Monitor | 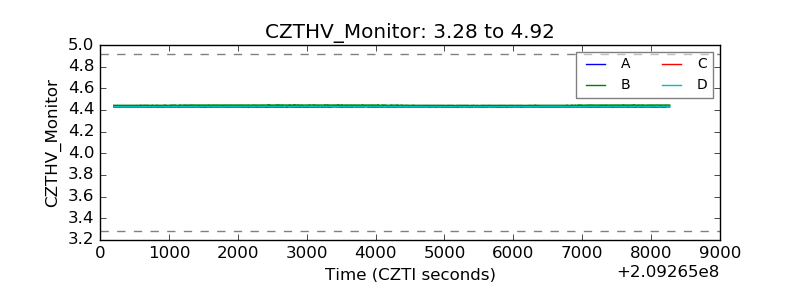 |
| D_VDD | 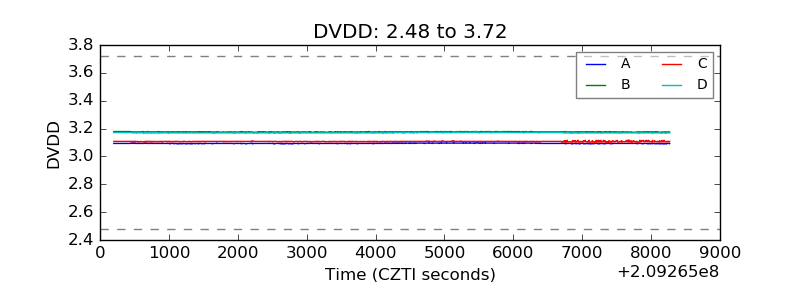 |
| Temperature 1 | 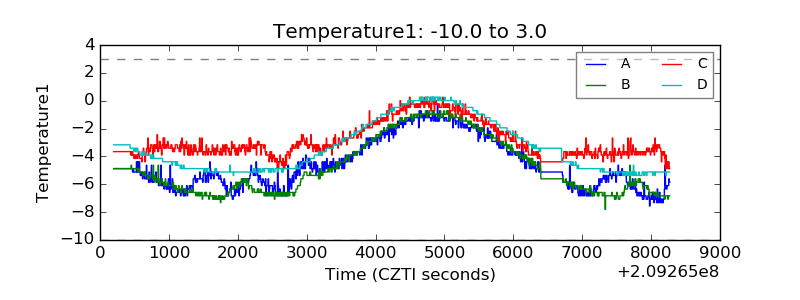 |
| Veto HV Monitor | 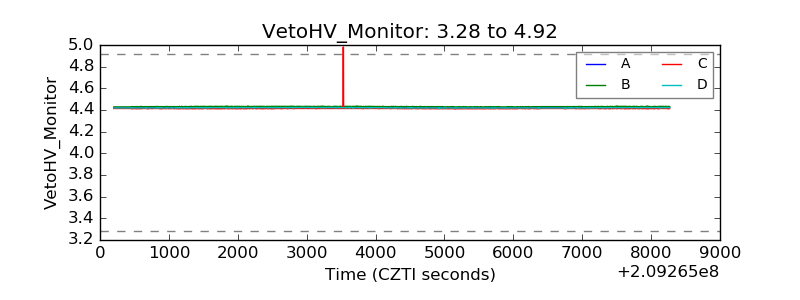 |
| Veto LLD | 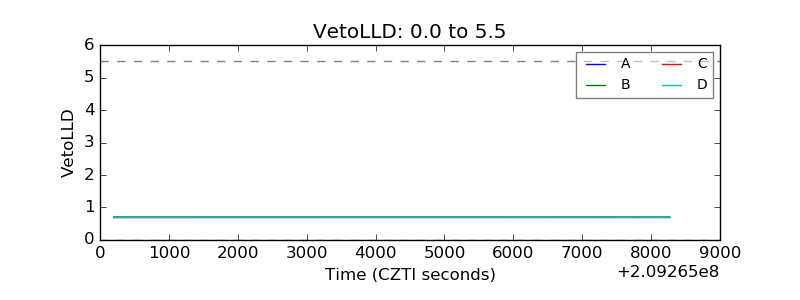 |
| Alpha Counter | 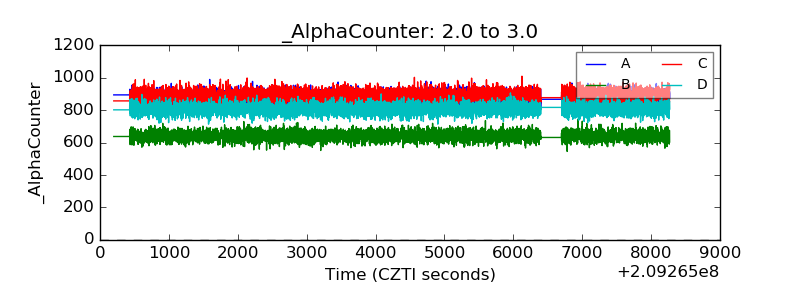 |
| _CPM_Rate | 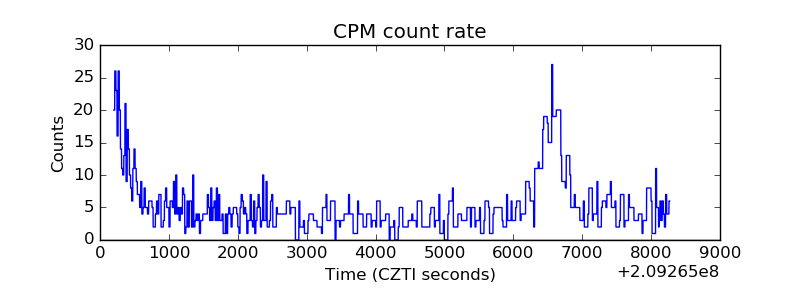 |
| CZT Counter | 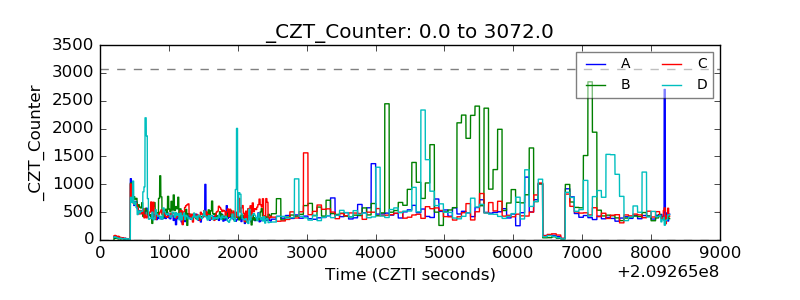 |
| +2.5 Volts monitor | 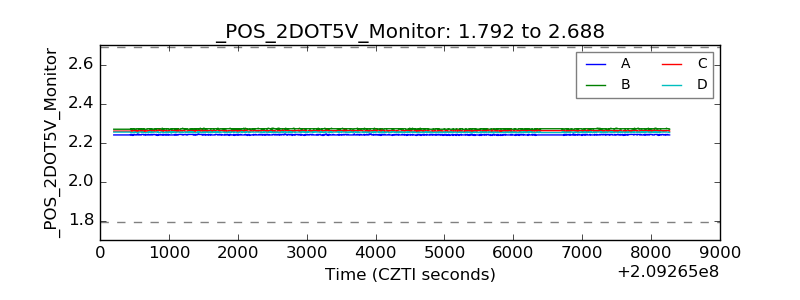 |
| +5 Volts monitor | 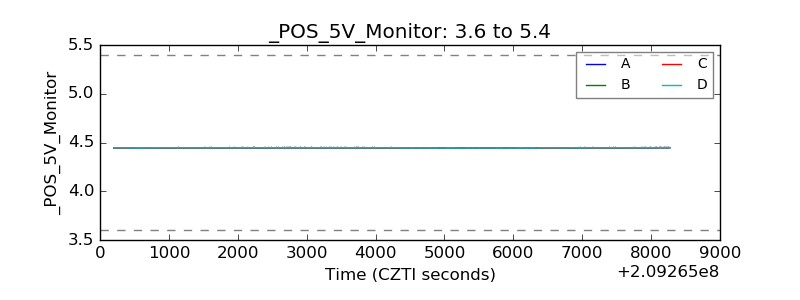 |
| _ROLL_ROT | 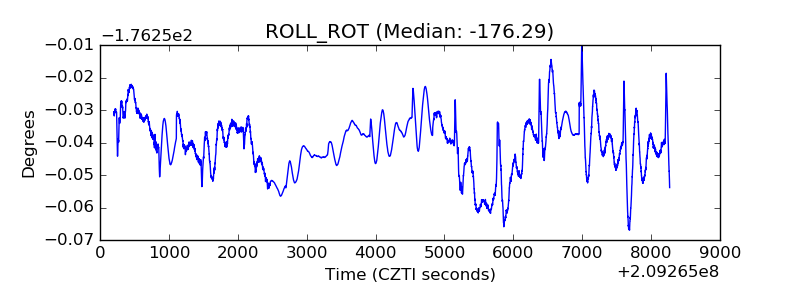 |
| _Roll_DEC | 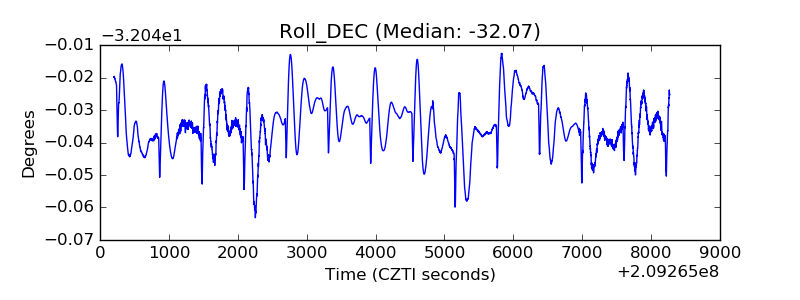 |
| _Roll_RA | 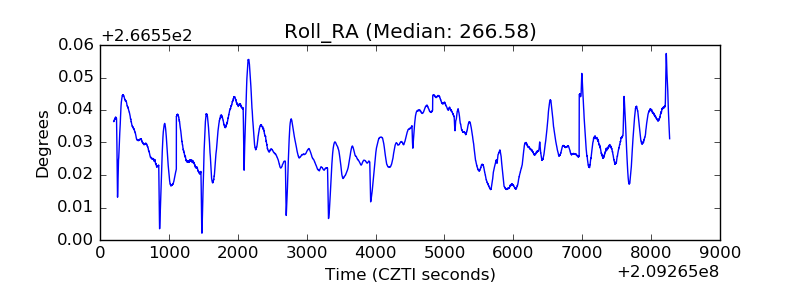 |
| Veto Counter | 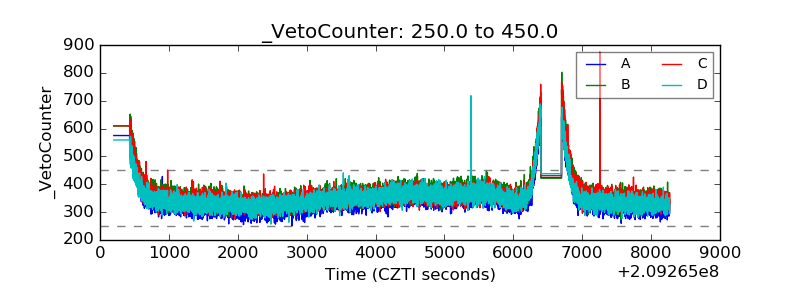 |