| Param | Original file | Final file |
|---|---|---|
| Filename | modeM0/AS1G05_144T01_9000000612_04828cztM0_level2.evt | modeM0/AS1G05_144T01_9000000612_04828cztM0_level2_quad_clean.evt |
| Size (bytes) | 656,308,800 | 77,014,080 |
| Size | 625.9 MB | 73.4 MB |
| Events in quadrant A | 4,065,429 | 441,954 |
| Events in quadrant B | 5,958,827 | 424,851 |
| Events in quadrant C | 4,199,906 | 446,279 |
| Events in quadrant D | 5,072,905 | 424,988 |
| Mode M0 | |||
|---|---|---|---|
| Quadrant | BADHDUFLAG | Total packets | Discarded packets |
| A | 0 | 18287 | 2 |
| B | 0 | 23576 | 2 |
| C | 0 | 18456 | 2 |
| D | 0 | 21247 | 4 |
| Mode M9 | |||
|---|---|---|---|
| Quadrant | BADHDUFLAG | Total packets | Discarded packets |
| A | 0 | 8 | 0 |
| B | 0 | 8 | 0 |
| C | 0 | 8 | 0 |
| D | 0 | 8 | 0 |
| Mode SS | |||
|---|---|---|---|
| Quadrant | BADHDUFLAG | Total packets | Discarded packets |
| A | 0 | 176 | 0 |
| B | 0 | 176 | 0 |
| C | 0 | 176 | 0 |
| D | 0 | 176 | 0 |
| Quadrant | Total seconds | Saturated seconds | Saturation percentage |
|---|---|---|---|
| A | 8542 | 150 | 1.756029% |
| B | 8542 | 630 | 7.375322% |
| C | 8542 | 118 | 1.381410% |
| D | 8541 | 312 | 3.652968% |
Noise dominated data is calculated using 1-second bins in cleaned event files. If a bin has >2000 counts, and if more than 50% of those come from <1% of pixels, then it is considered to be noise-dominated and hence unusable.
| Quadrant | # 1 sec bins | Bins with >0 counts | Bins with >2000 counts | High rate bins dominated by noise | Noise dominated (total time) | Noise dominated (detector-on time) | Marked lightcurve |
|---|---|---|---|---|---|---|---|
| A | 9327 | 8544 | 36 | 36 | 0.39% | 0.42% | 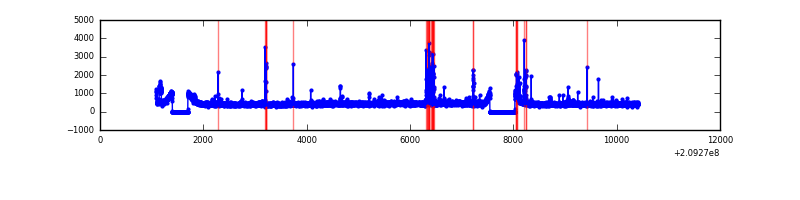 |
| B | 9327 | 8544 | 366 | 366 | 3.92% | 4.28% | 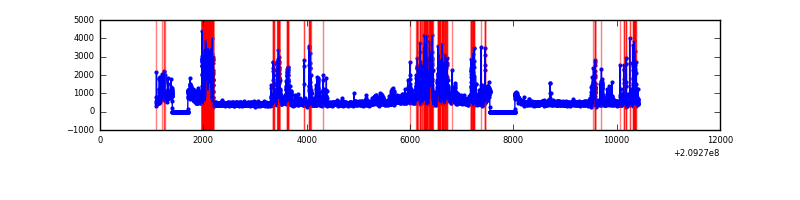 |
| C | 9327 | 8544 | 10 | 10 | 0.11% | 0.12% | 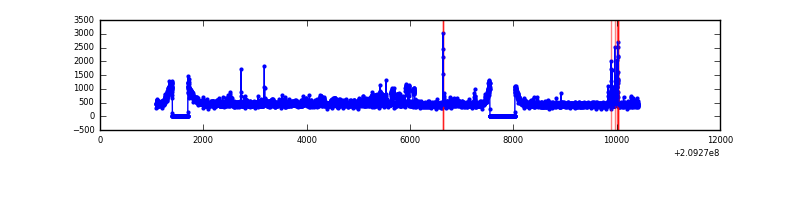 |
| D | 9327 | 8544 | 187 | 187 | 2.00% | 2.19% | 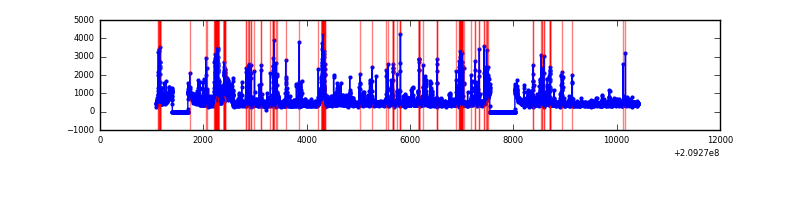 |
Top three noisy pixels from each quadrant. If the there are fewer than three noisy pixels in the level2.evt file, extra rows are filled as -1
| Pixel properties | Quadrant properties | ||||||
|---|---|---|---|---|---|---|---|
| Quadrant | DetID | PixID | Counts | Sigma | Mean | Median | Sigma |
| A | 13 | 251 | 214525 | 1063.38 | 978 | 957 | 200.8 |
| A | 0 | 50 | 46557 | 227.05 | 978 | 957 | 200.8 |
| A | 8 | 15 | 26218 | 125.78 | 978 | 957 | 200.8 |
| B | 10 | 16 | 1840883 | 9766.37 | 973 | 947 | 188.4 |
| B | 8 | 3 | 158794 | 837.85 | 973 | 947 | 188.4 |
| B | 15 | 204 | 122416 | 644.76 | 973 | 947 | 188.4 |
| C | 8 | 208 | 296809 | 1303.84 | 959 | 963 | 226.9 |
| C | 9 | 247 | 125154 | 547.33 | 959 | 963 | 226.9 |
| C | 8 | 128 | 16206 | 67.18 | 959 | 963 | 226.9 |
| D | 13 | 235 | 320610 | 1362.56 | 943 | 911 | 234.6 |
| D | 7 | 237 | 262608 | 1115.36 | 943 | 911 | 234.6 |
| D | 2 | 234 | 161362 | 683.85 | 943 | 911 | 234.6 |
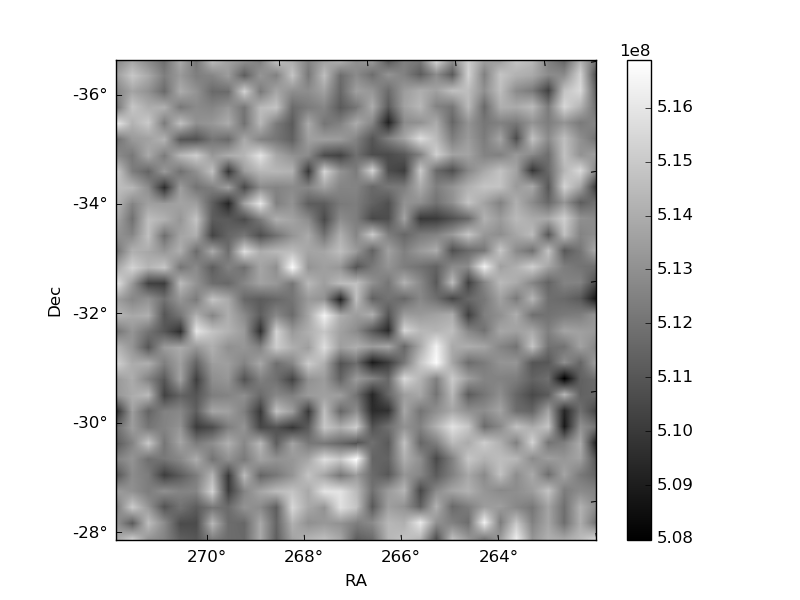
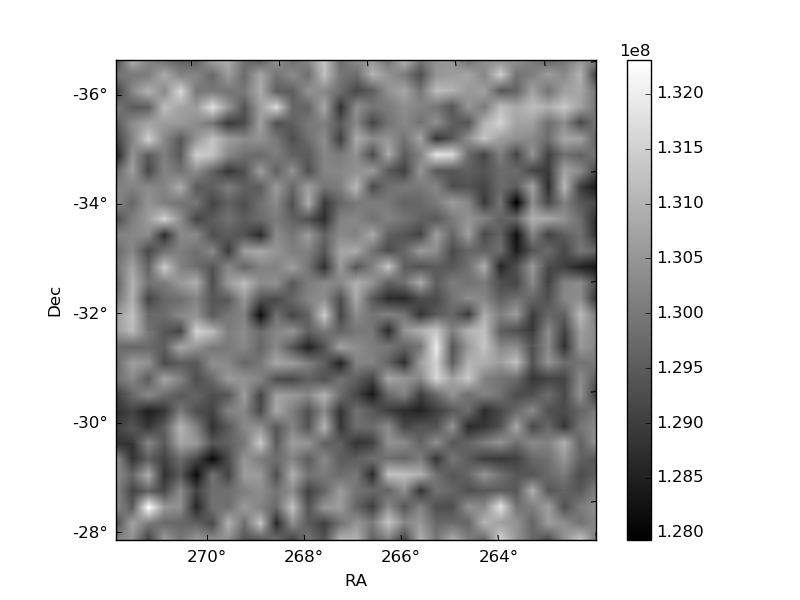
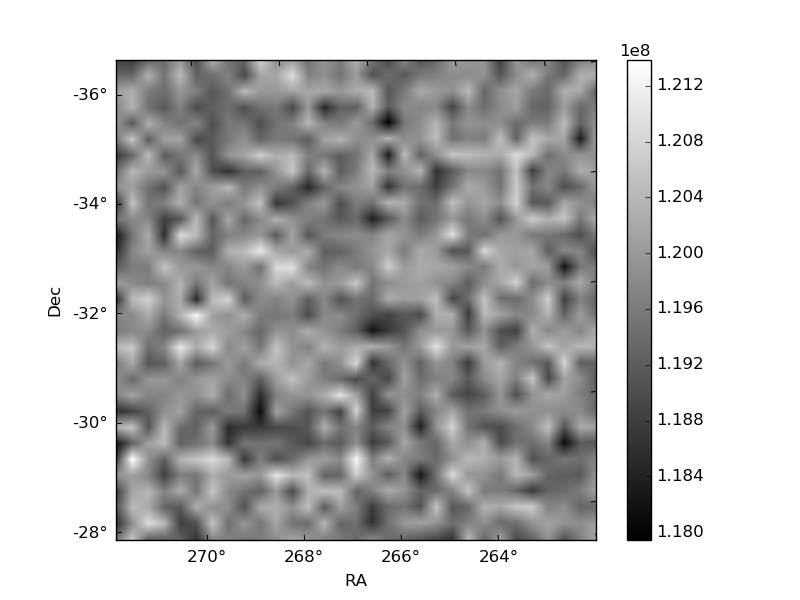
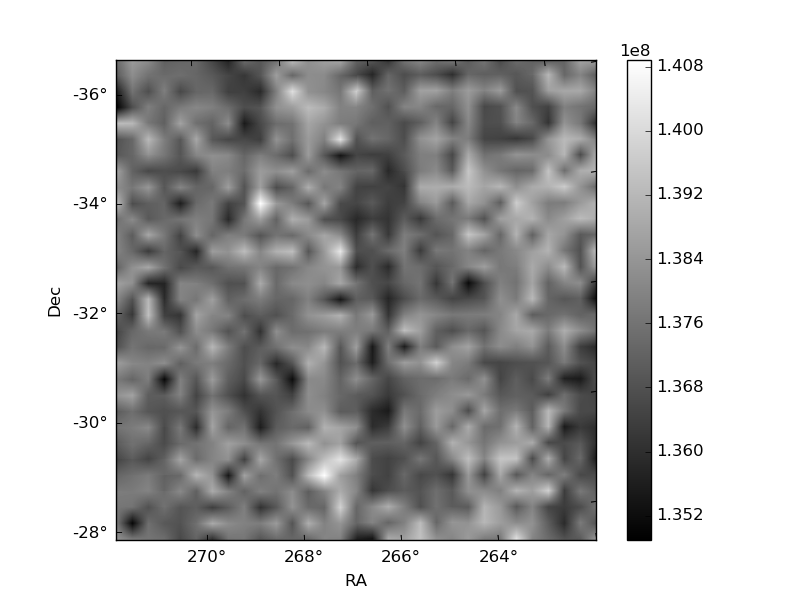
Histogram calculated using DETX and DETY for each event in the final _common_clean file
| Quadrant A | 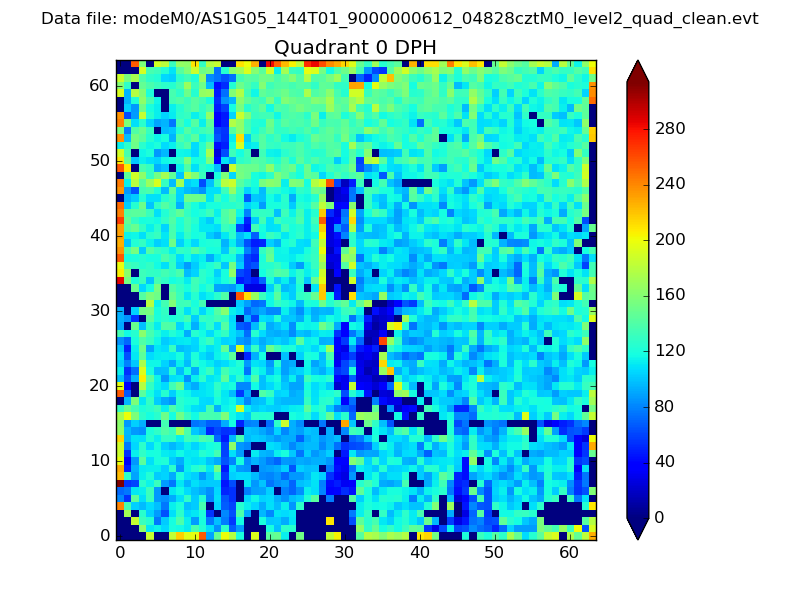 |
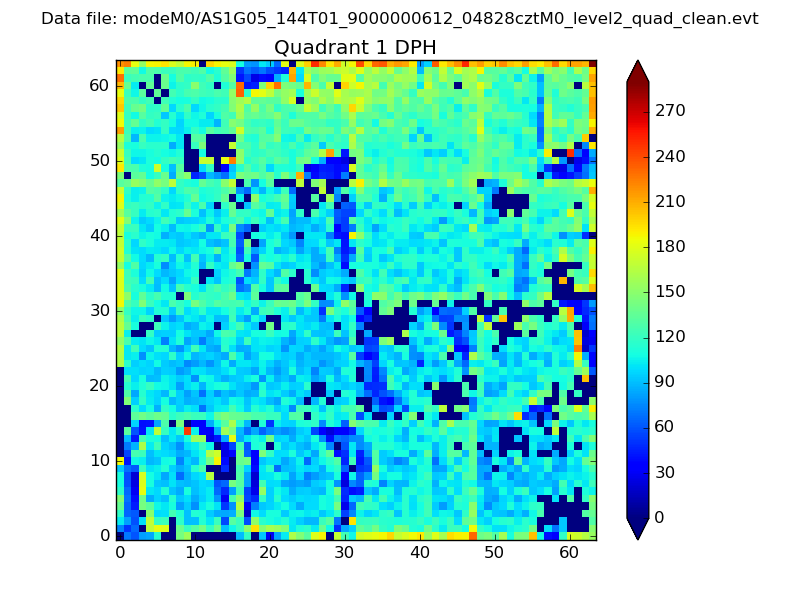 |
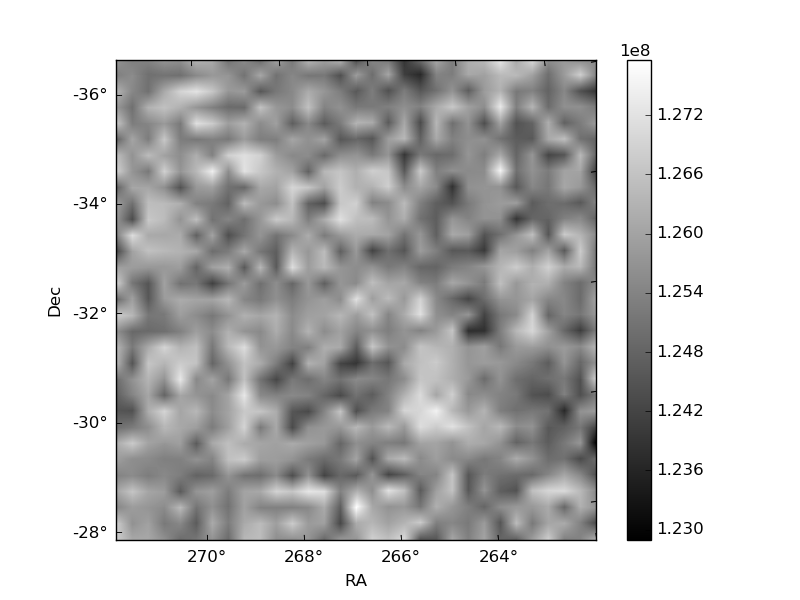
Quadrant B |
|---|---|---|---|
| Quadrant D | 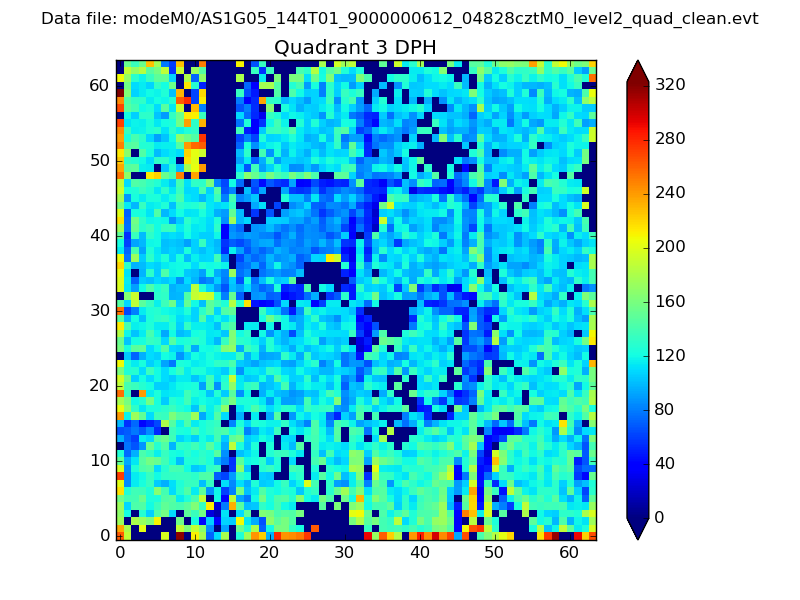 |
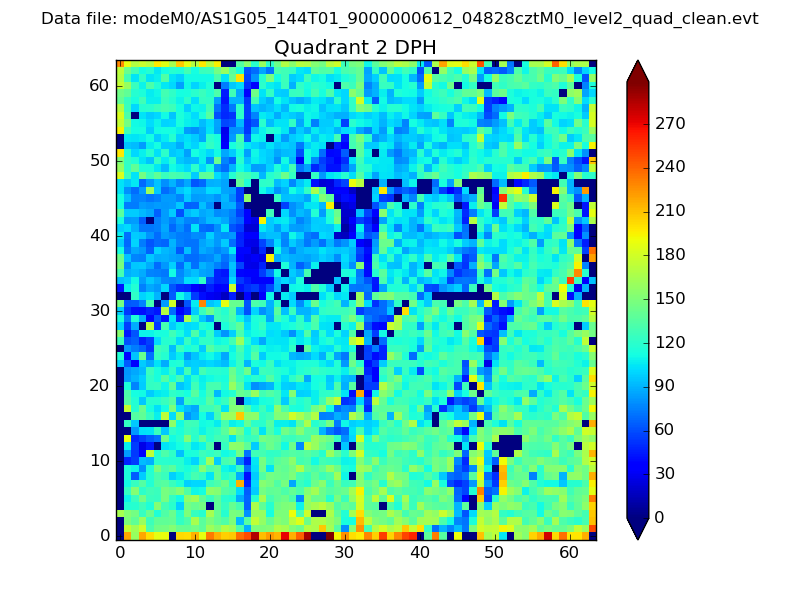 |
Quadrant C |
| Plot type | Count rate plots | Images |
|---|---|---|
| Comparison with Poisson distribution Blue bars denote a histogram of data divided into 1 sec bins. Red curve is a Poisson curve with rate = median count rate of data. |
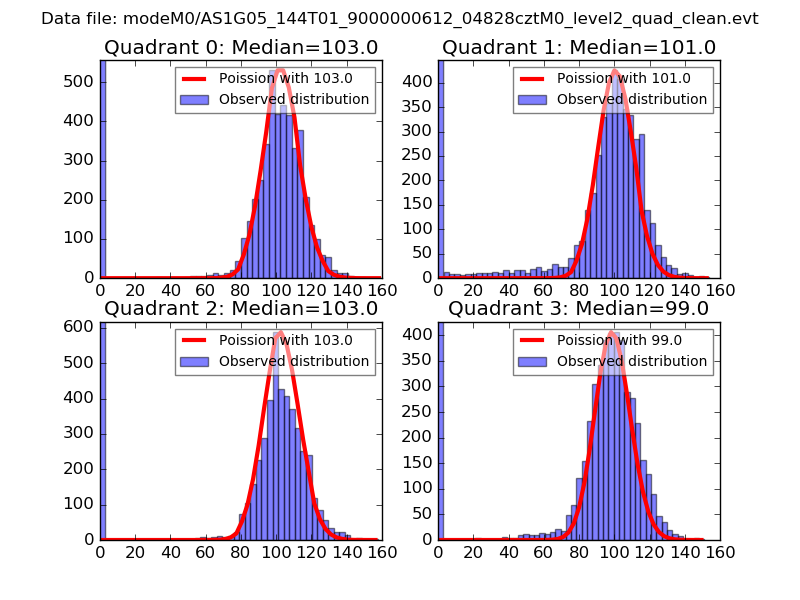 |
 |
| Quadrant-wise count rates Data is divided into 100 sec bins |
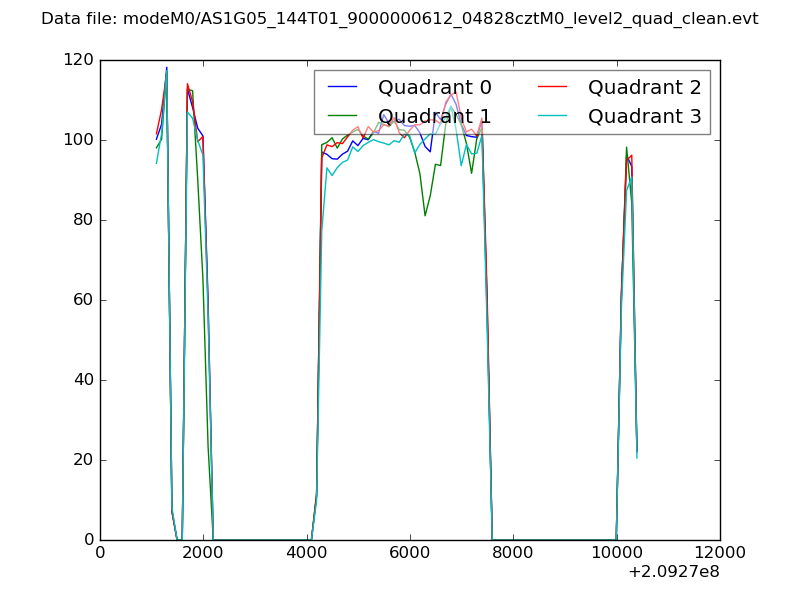 |
|
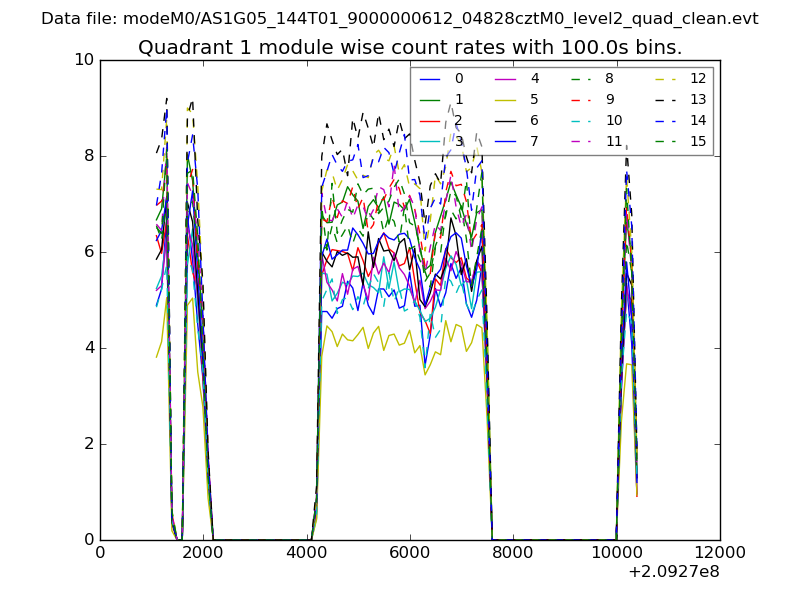
| Module-wise count rates for Quadrant A Data is divided into 100 sec bins |
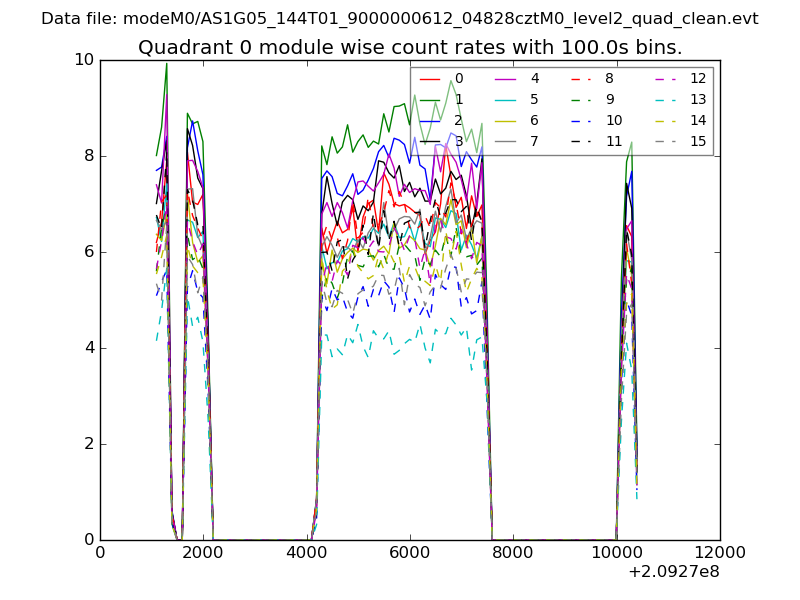 |
 |
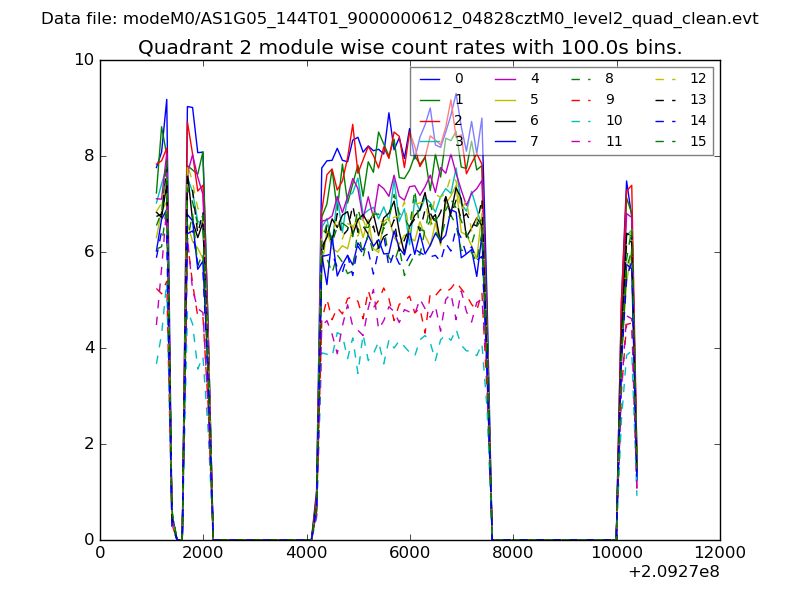
| Module-wise count rates for Quadrant B Data is divided into 100 sec bins |
 |
 |
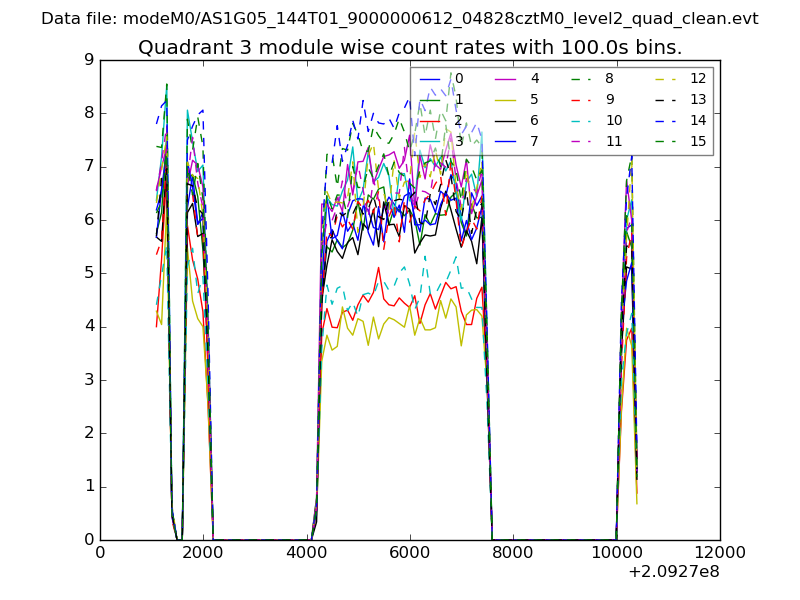
| Module-wise count rates for Quadrant C Data is divided into 100 sec bins |
 |
 |
| Module-wise count rates for Quadrant D Data is divided into 100 sec bins |
 |
 |
| Parameter | Plot |
|---|---|
| CZT HV Monitor | 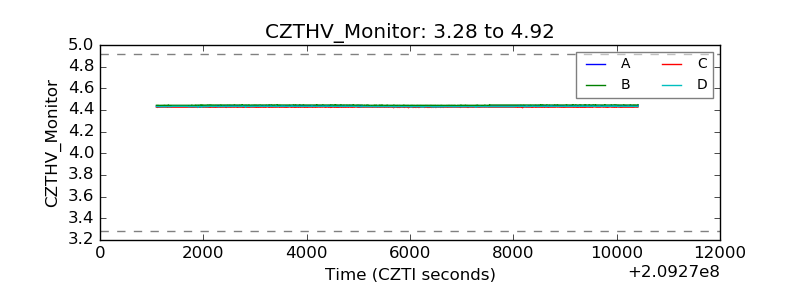 |
| D_VDD | 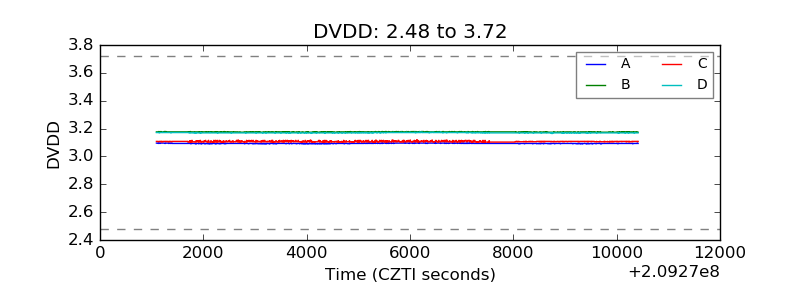 |
| Temperature 1 | 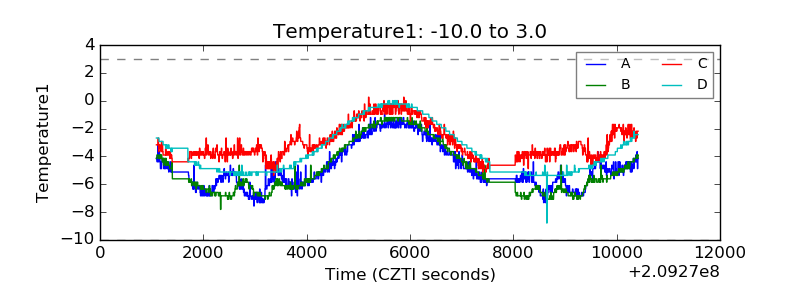 |
| Veto HV Monitor | 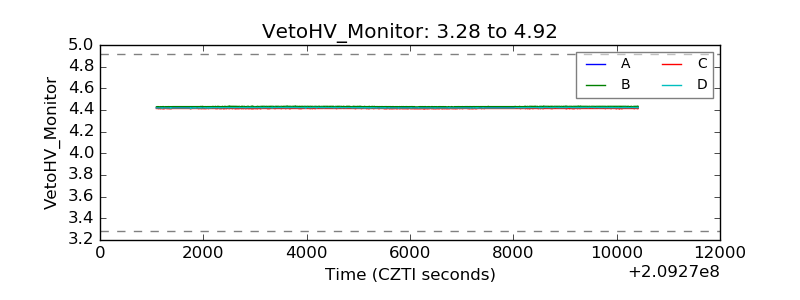 |
| Veto LLD | 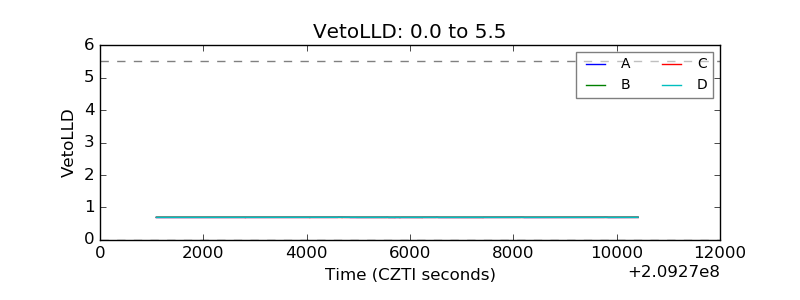 |
| Alpha Counter | 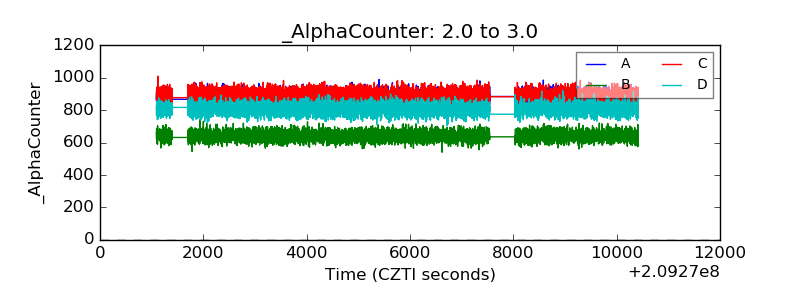 |
| _CPM_Rate | 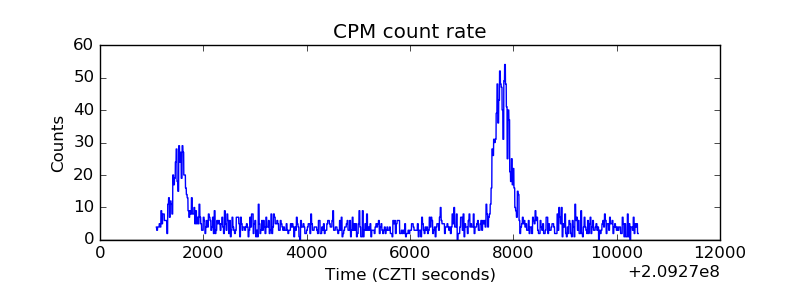 |
| CZT Counter | 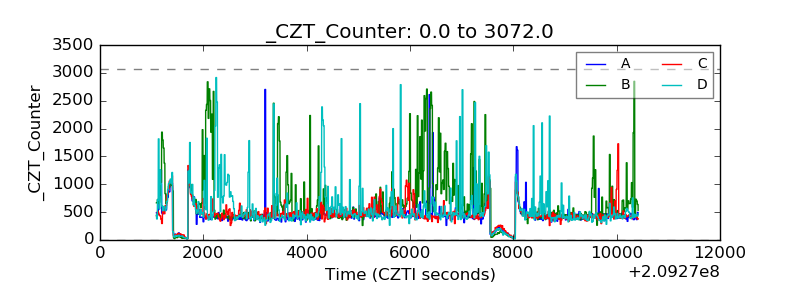 |
| +2.5 Volts monitor |  |
| +5 Volts monitor |  |
| _ROLL_ROT | 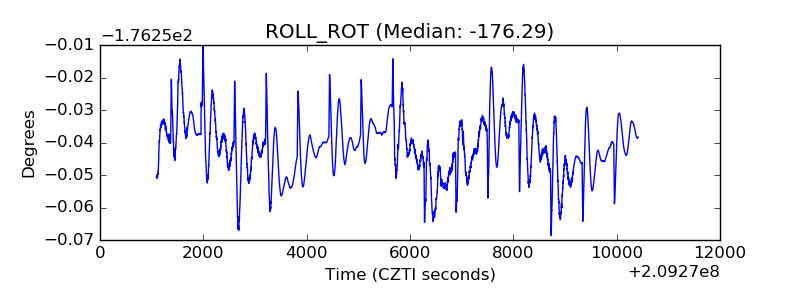 |
| _Roll_DEC | 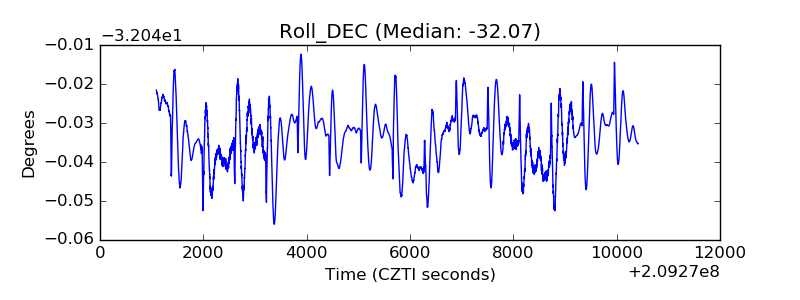 |
| _Roll_RA | 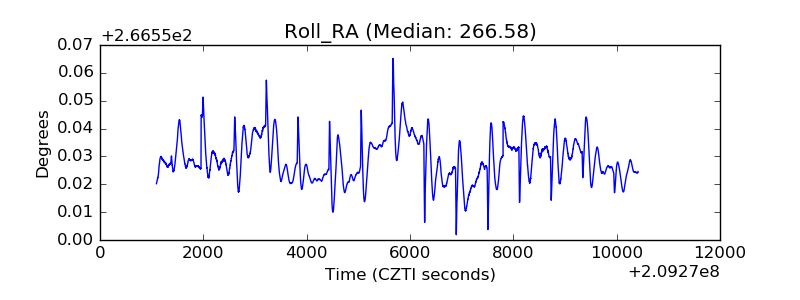 |
| Veto Counter | 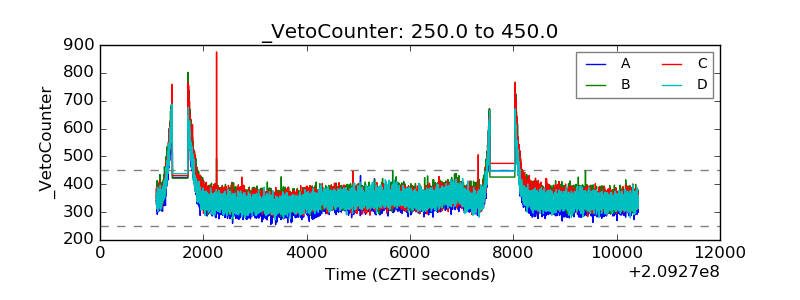 |