| Param | Original file | Final file |
|---|---|---|
| Filename | modeM0/AS1G05_253T02_9000000614cztM0_level2.fits | modeM0/AS1G05_253T02_9000000614cztM0_level2_quad_clean.evt |
| Size (bytes) | 929,136,960 | 945,380,160 |
| Size | 886.1 MB | 901.6 MB |
| Events in quadrant A | 5,598,390 | 5,638,522 |
| Events in quadrant B | 5,349,086 | 5,579,614 |
| Events in quadrant C | 5,497,337 | 5,476,179 |
| Events in quadrant D | 4,694,350 | 4,940,936 |
| Mode M9 | |||
|---|---|---|---|
| Quadrant | BADHDUFLAG | Total packets | Discarded packets |
| A | 0 | 174 | 0 |
| B | 0 | 175 | 0 |
| C | 0 | 175 | 0 |
| D | 0 | 174 | 0 |
| Mode SS | |||
|---|---|---|---|
| Quadrant | BADHDUFLAG | Total packets | Discarded packets |
| A | 0 | 2098 | 0 |
| B | 0 | 2102 | 0 |
| C | 0 | 2108 | 0 |
| D | 0 | 2110 | 0 |
| Mode M0 | |||
|---|---|---|---|
| Quadrant | BADHDUFLAG | Total packets | Discarded packets |
| A | 0 | 217846 | 0 |
| B | 0 | 234292 | 0 |
| C | 0 | 218343 | 0 |
| D | 0 | 248319 | 0 |
| Quadrant | Total seconds | Saturated seconds | Saturation percentage |
|---|---|---|---|
| A | 102063 | 1903 | 1.864535% |
| B | 101972 | 2213 | 2.170204% |
| C | 101969 | 1218 | 1.194481% |
| D | 101951 | 3356 | 3.291777% |
Noise dominated data is calculated using 1-second bins in cleaned event files. If a bin has >2000 counts, and if more than 50% of those come from <1% of pixels, then it is considered to be noise-dominated and hence unusable.
| Quadrant | # 1 sec bins | Bins with >0 counts | Bins with >2000 counts | High rate bins dominated by noise | Noise dominated (total time) | Noise dominated (detector-on time) | Marked lightcurve |
|---|---|---|---|---|---|---|---|
| A | 123154 | 102902 | 0 | 0 | 0.00% | 0.00% |  |
| B | 123154 | 102843 | 0 | 0 | 0.00% | 0.00% | 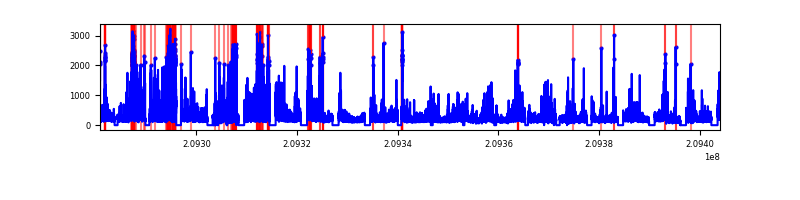 |
| C | 123154 | 102844 | 0 | 0 | 0.00% | 0.00% |  |
| D | 123154 | 102811 | 0 | 0 | 0.00% | 0.00% |  |
Top three noisy pixels from each quadrant. If the there are fewer than three noisy pixels in the level2.evt file, extra rows are filled as -1
| Pixel properties | Quadrant properties | ||||||
|---|---|---|---|---|---|---|---|
| Quadrant | DetID | PixID | Counts | Sigma | Mean | Median | Sigma |
| A | 14 | 188 | 5530 | 11.2 | 1452 | 1348 | 373.5 |
| A | 0 | 29 | 5520 | 11.17 | 1452 | 1348 | 373.5 |
| A | 14 | 204 | 4945 | 9.63 | 1452 | 1348 | 373.5 |
| B | 2 | 9 | 4733 | 11.93 | 1412 | 1340 | 284.4 |
| B | 12 | 226 | 3867 | 8.89 | 1412 | 1340 | 284.4 |
| B | 14 | 254 | 3651 | 8.13 | 1412 | 1340 | 284.4 |
| C | 1 | 81 | 3972 | 6.74 | 1451 | 1333 | 391.4 |
| C | 1 | 80 | 3921 | 6.61 | 1451 | 1333 | 391.4 |
| C | 12 | 241 | 3912 | 6.59 | 1451 | 1333 | 391.4 |
| D | 11 | 82 | 3870 | 7.35 | 1340 | 1214 | 361.5 |
| D | 3 | 14 | 3567 | 6.51 | 1340 | 1214 | 361.5 |
| D | 7 | 5 | 3487 | 6.29 | 1340 | 1214 | 361.5 |
Histogram calculated using DETX and DETY for each event in the final _common_clean file
| Quadrant A | 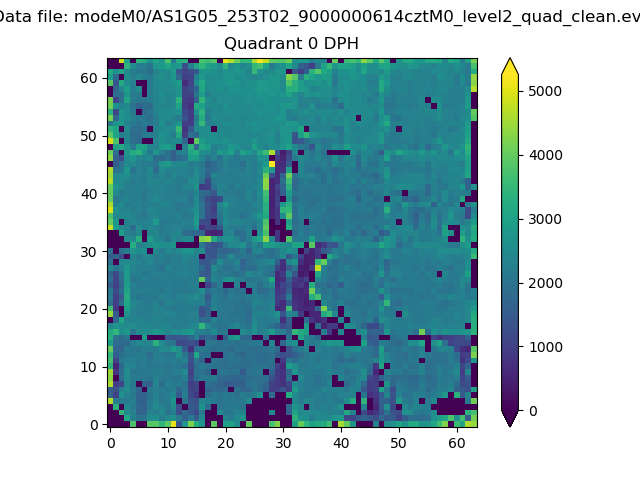 |
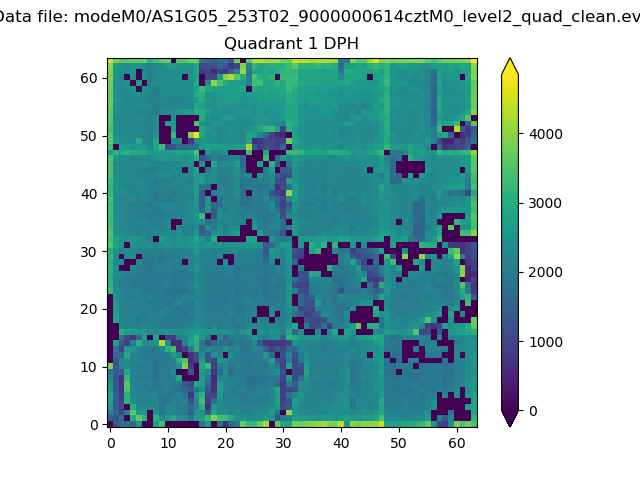 |
Quadrant B |
|---|---|---|---|
| Quadrant D |  |
 |
Quadrant C |
| Plot type | Count rate plots | Images |
|---|---|---|
| Comparison with Poisson distribution Blue bars denote a histogram of data divided into 1 sec bins. Red curve is a Poisson curve with rate = median count rate of data. |
 |
 |
| Quadrant-wise count rates Data is divided into 100 sec bins |
 |
|
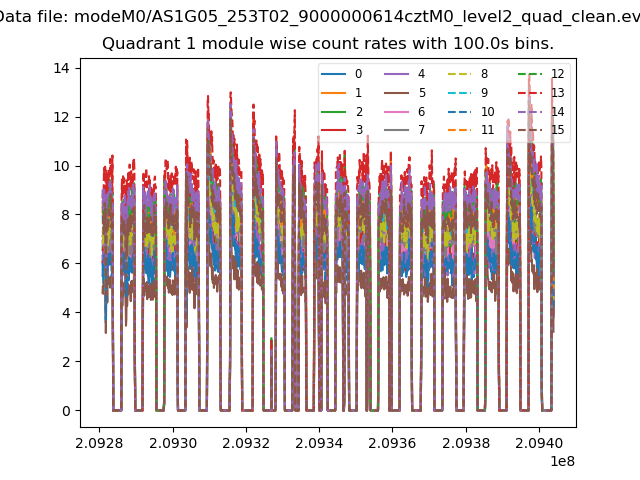
| Module-wise count rates for Quadrant A Data is divided into 100 sec bins |
 |
 |
| Module-wise count rates for Quadrant B Data is divided into 100 sec bins |
 |
 |
| Module-wise count rates for Quadrant C Data is divided into 100 sec bins |
 |
 |
| Module-wise count rates for Quadrant D Data is divided into 100 sec bins |
 |
 |
| Parameter | Plot |
|---|---|
| CZT HV Monitor | 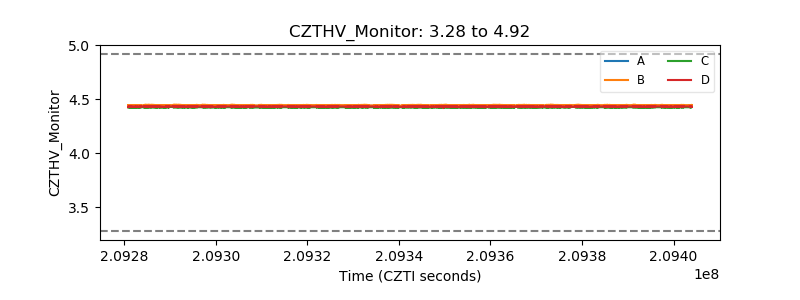 |
| D_VDD | 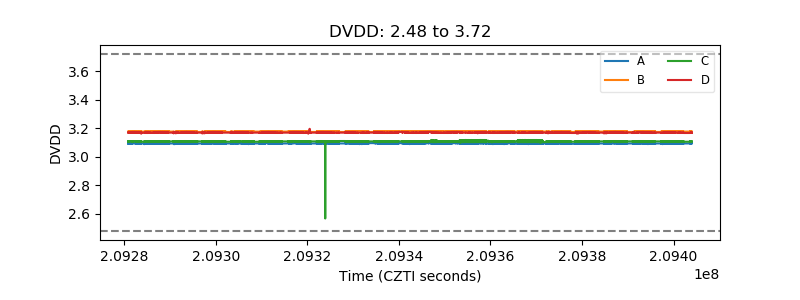 |
| Temperature 1 |  |
| Veto HV Monitor |  |
| Veto LLD | 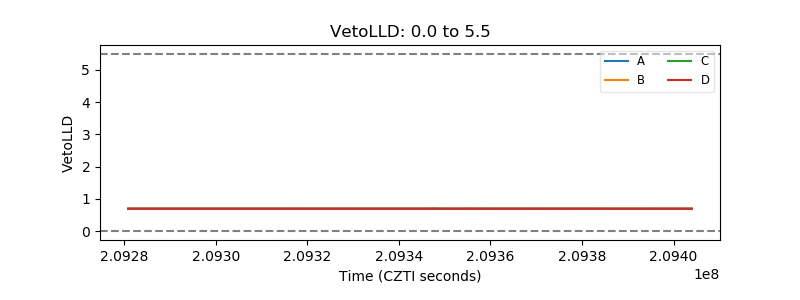 |
| Alpha Counter |  |
| _CPM_Rate | 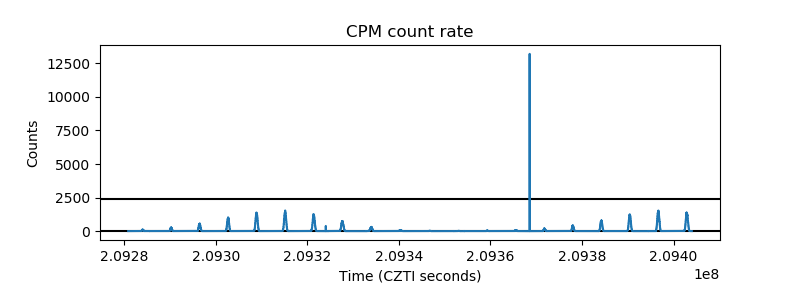 |
| CZT Counter |  |
| +2.5 Volts monitor | 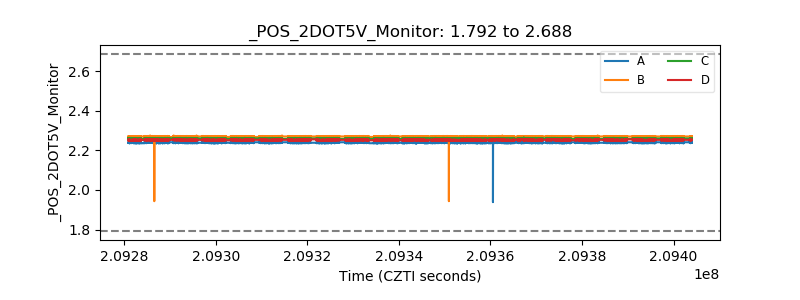 |
| +5 Volts monitor |  |
| _ROLL_ROT |  |
| _Roll_DEC |  |
| _Roll_RA | 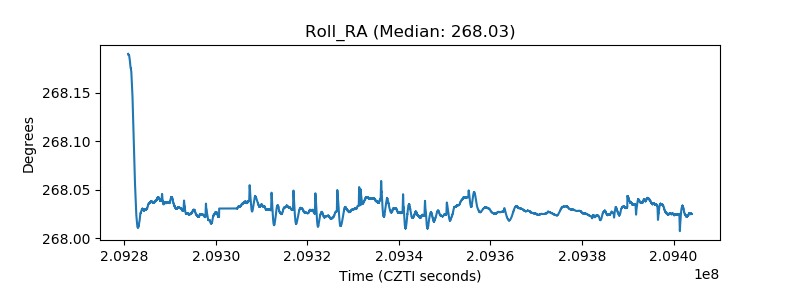 |
| Veto Counter |  |