| Param | Original file | Final file |
|---|---|---|
| Filename | modeM0/AS1G05_253T02_9000000614_04828cztM0_level2.evt | modeM0/AS1G05_253T02_9000000614_04828cztM0_level2_quad_clean.evt |
| Size (bytes) | 765,889,920 | 113,889,600 |
| Size | 730.4 MB | 108.6 MB |
| Events in quadrant A | 4,854,139 | 695,497 |
| Events in quadrant B | 6,521,938 | 682,187 |
| Events in quadrant C | 5,828,480 | 701,308 |
| Events in quadrant D | 5,315,043 | 678,334 |
| Mode M9 | |||
|---|---|---|---|
| Quadrant | BADHDUFLAG | Total packets | Discarded packets |
| A | 0 | 14 | 0 |
| B | 0 | 14 | 0 |
| C | 0 | 14 | 0 |
| D | 0 | 14 | 0 |
| Mode SS | |||
|---|---|---|---|
| Quadrant | BADHDUFLAG | Total packets | Discarded packets |
| A | 0 | 204 | 0 |
| B | 0 | 204 | 0 |
| C | 0 | 204 | 0 |
| D | 0 | 204 | 0 |
| Mode M0 | |||
|---|---|---|---|
| Quadrant | BADHDUFLAG | Total packets | Discarded packets |
| A | 0 | 21308 | 3 |
| B | 0 | 25780 | 2 |
| C | 0 | 24432 | 2 |
| D | 0 | 22869 | 2 |
| Quadrant | Total seconds | Saturated seconds | Saturation percentage |
|---|---|---|---|
| A | 9975 | 201 | 2.015038% |
| B | 9975 | 429 | 4.300752% |
| C | 9975 | 364 | 3.649123% |
| D | 9975 | 274 | 2.746867% |
Noise dominated data is calculated using 1-second bins in cleaned event files. If a bin has >2000 counts, and if more than 50% of those come from <1% of pixels, then it is considered to be noise-dominated and hence unusable.
| Quadrant | # 1 sec bins | Bins with >0 counts | Bins with >2000 counts | High rate bins dominated by noise | Noise dominated (total time) | Noise dominated (detector-on time) | Marked lightcurve |
|---|---|---|---|---|---|---|---|
| A | 11365 | 9975 | 21 | 21 | 0.18% | 0.21% | 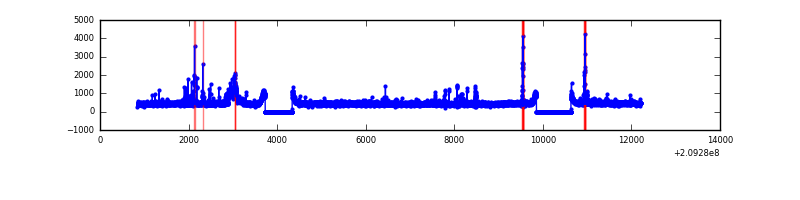 |
| B | 11365 | 9975 | 237 | 237 | 2.09% | 2.38% | 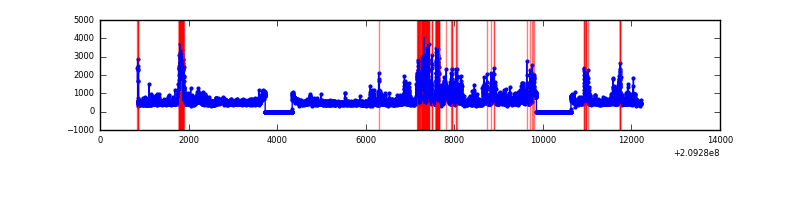 |
| C | 11365 | 9975 | 171 | 171 | 1.50% | 1.71% | 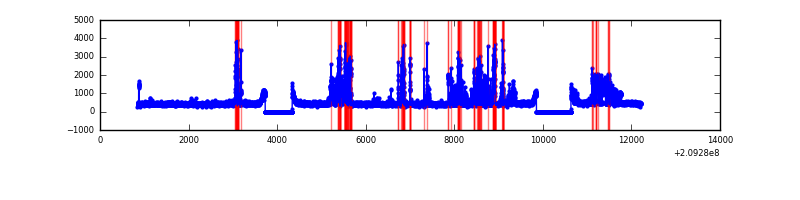 |
| D | 11365 | 9975 | 117 | 117 | 1.03% | 1.17% | 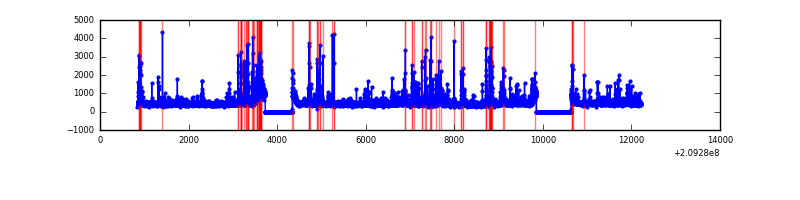 |
Top three noisy pixels from each quadrant. If the there are fewer than three noisy pixels in the level2.evt file, extra rows are filled as -1
| Pixel properties | Quadrant properties | ||||||
|---|---|---|---|---|---|---|---|
| Quadrant | DetID | PixID | Counts | Sigma | Mean | Median | Sigma |
| A | 0 | 149 | 149995 | 624.9 | 1154 | 1126 | 238.2 |
| A | 8 | 15 | 96411 | 399.97 | 1154 | 1126 | 238.2 |
| A | 13 | 251 | 82726 | 342.53 | 1154 | 1126 | 238.2 |
| B | 14 | 167 | 1127468 | 4961.81 | 1160 | 1130 | 227.0 |
| B | 15 | 204 | 366891 | 1611.27 | 1160 | 1130 | 227.0 |
| B | 10 | 16 | 320494 | 1406.88 | 1160 | 1130 | 227.0 |
| C | 9 | 247 | 850111 | 3253.54 | 1117 | 1123 | 260.9 |
| C | 8 | 208 | 587911 | 2248.73 | 1117 | 1123 | 260.9 |
| C | 12 | 4 | 25809 | 94.6 | 1117 | 1123 | 260.9 |
| D | 13 | 235 | 386873 | 1423.0 | 1118 | 1085 | 271.1 |
| D | 2 | 136 | 165682 | 607.13 | 1118 | 1085 | 271.1 |
| D | 12 | 22 | 131086 | 479.52 | 1118 | 1085 | 271.1 |
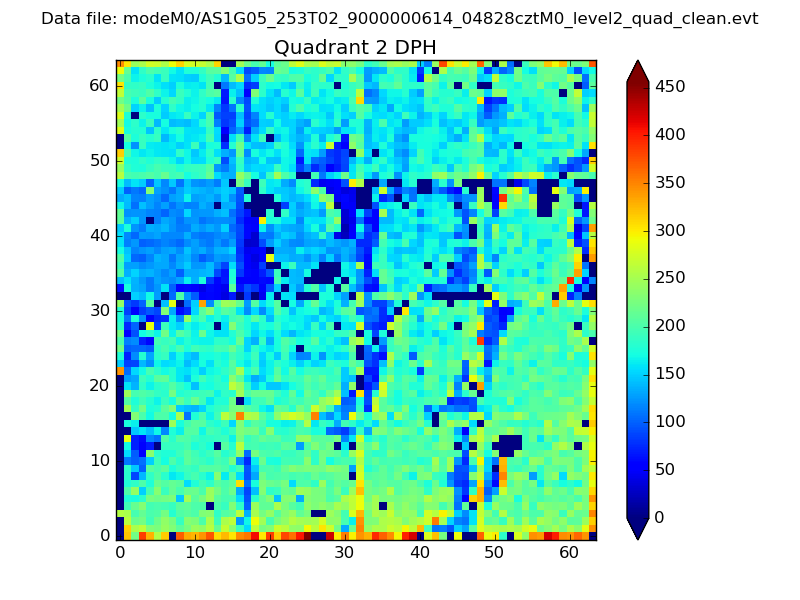
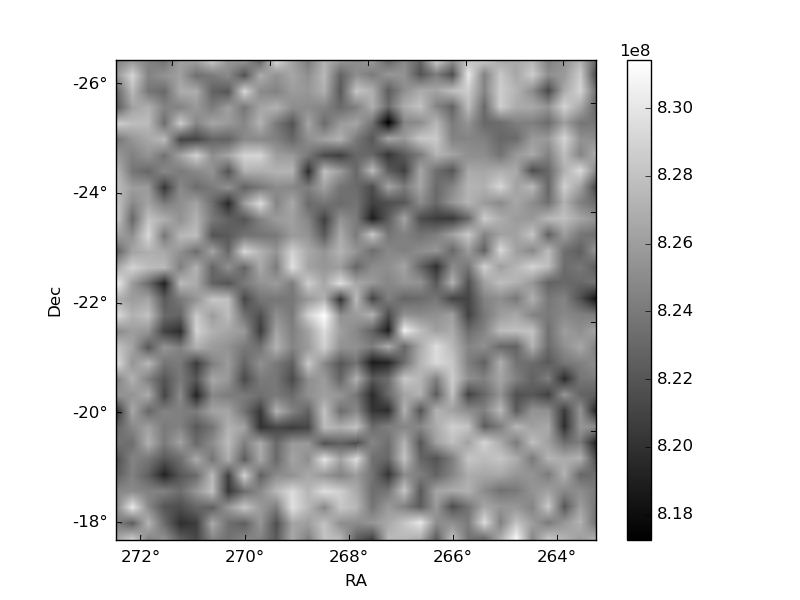
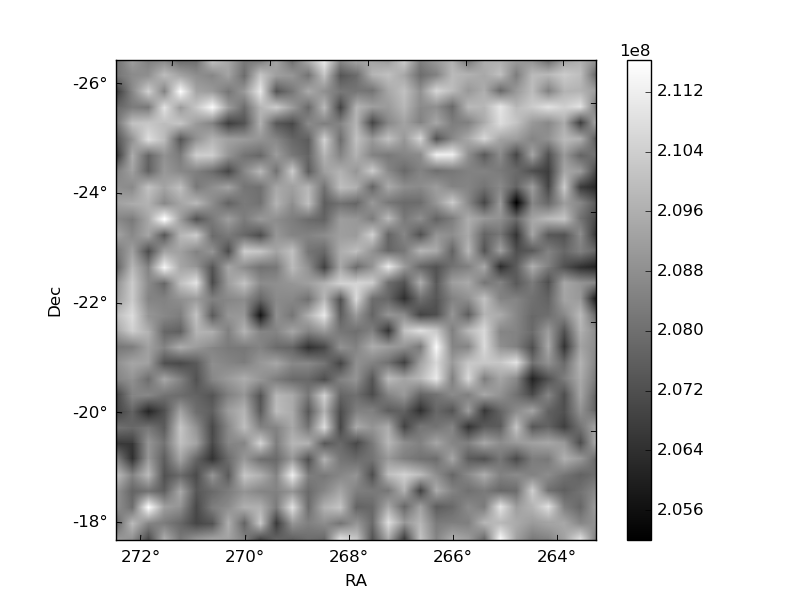
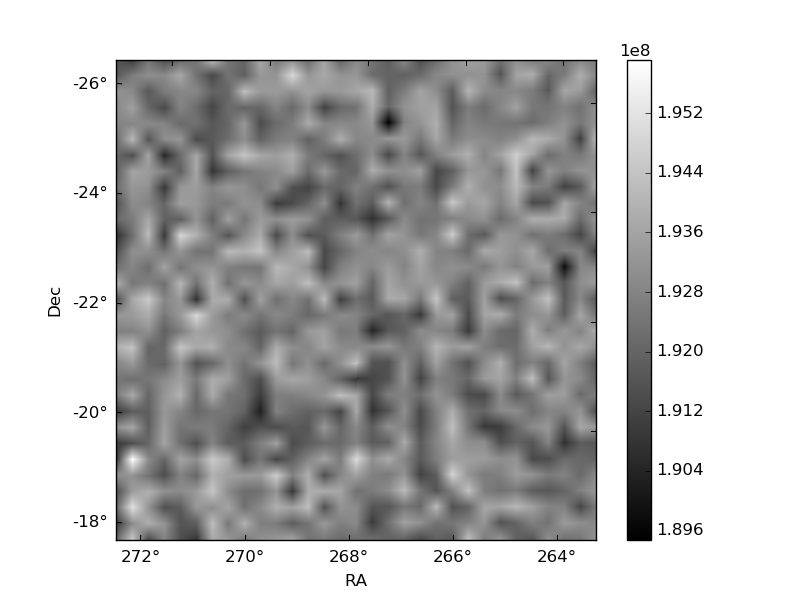
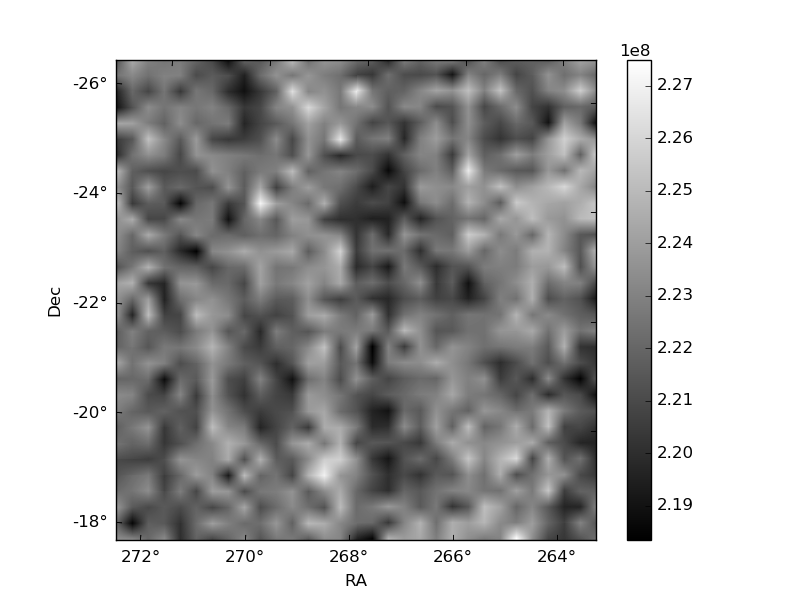
Histogram calculated using DETX and DETY for each event in the final _common_clean file
| Quadrant A | 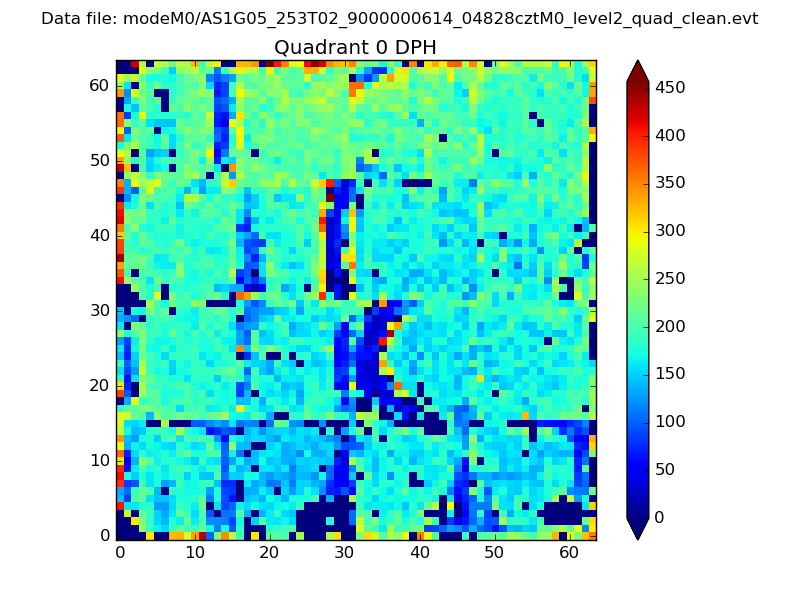 |
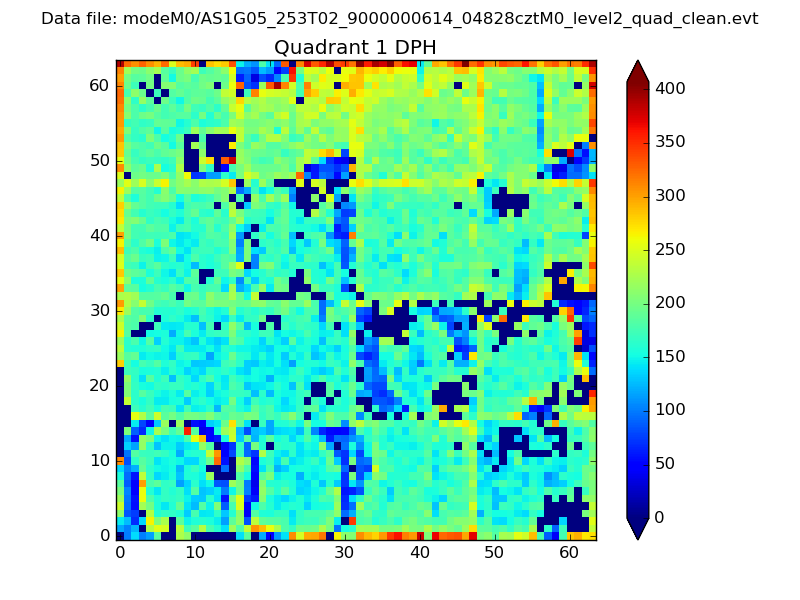 |
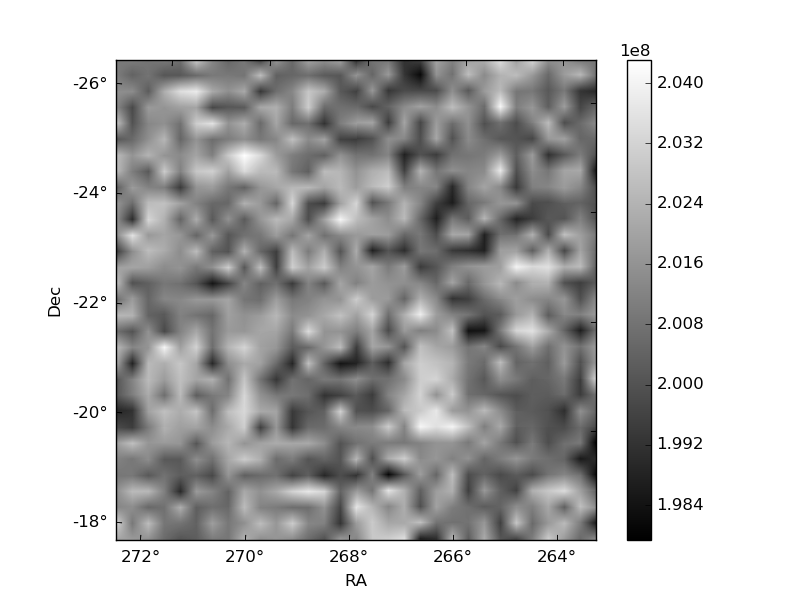
Quadrant B |
|---|---|---|---|
| Quadrant D | 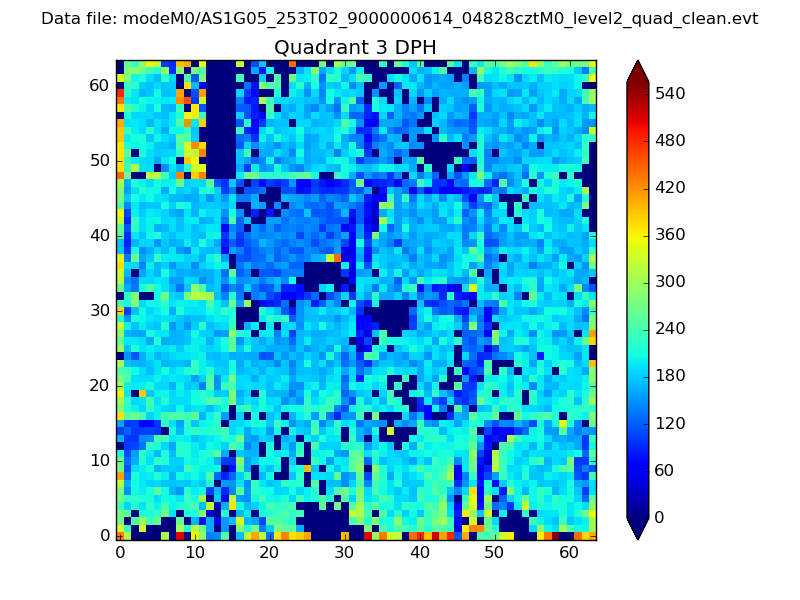 |
 |
Quadrant C |
| Plot type | Count rate plots | Images |
|---|---|---|
| Comparison with Poisson distribution Blue bars denote a histogram of data divided into 1 sec bins. Red curve is a Poisson curve with rate = median count rate of data. |
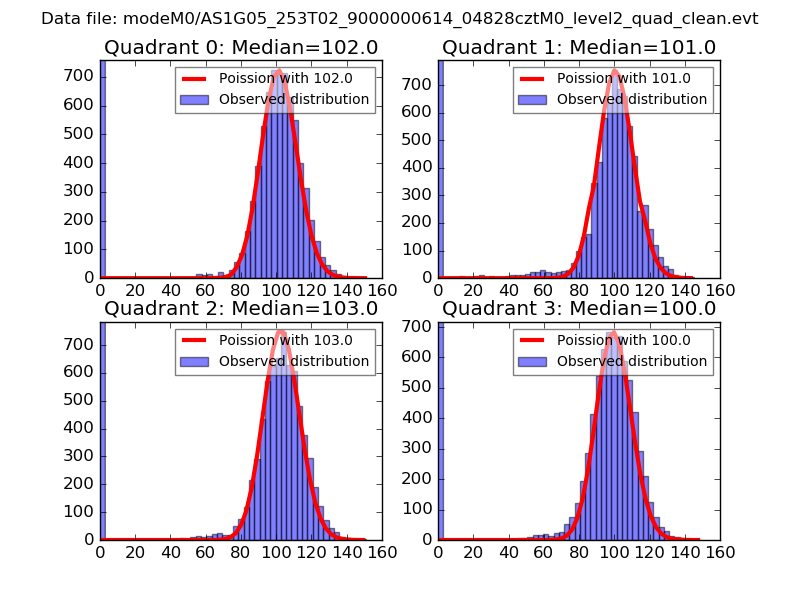 |
 |
| Quadrant-wise count rates Data is divided into 100 sec bins |
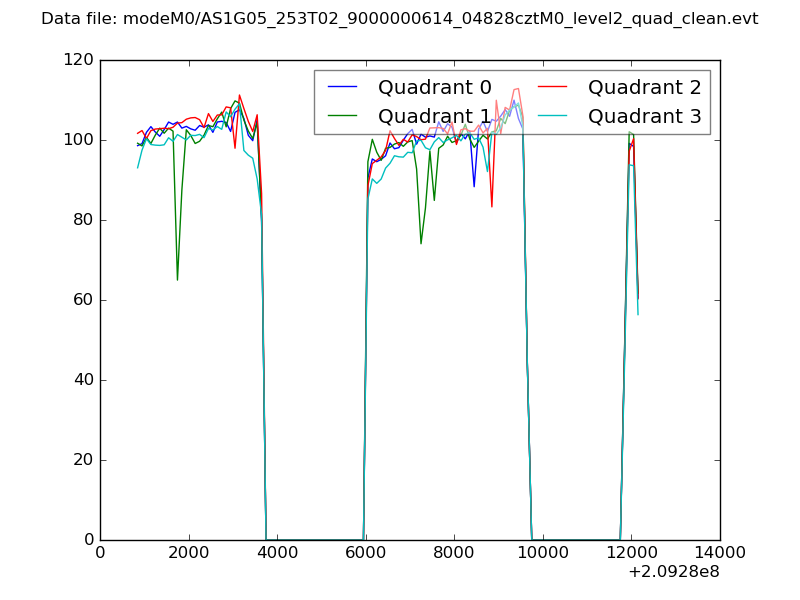 |
|
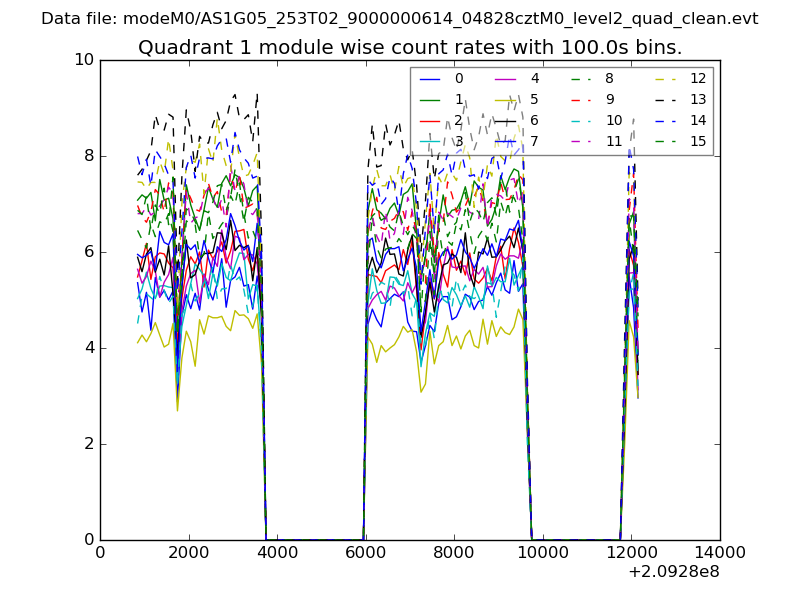
| Module-wise count rates for Quadrant A Data is divided into 100 sec bins |
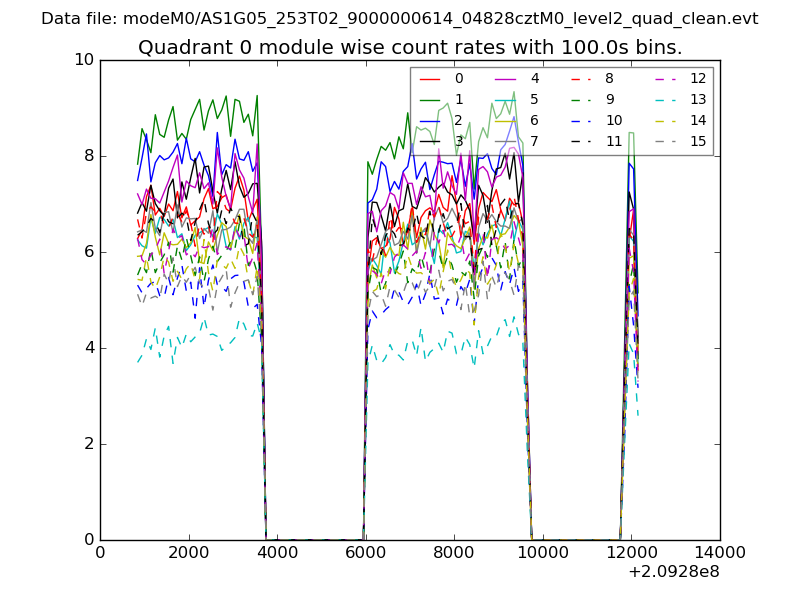 |
 |
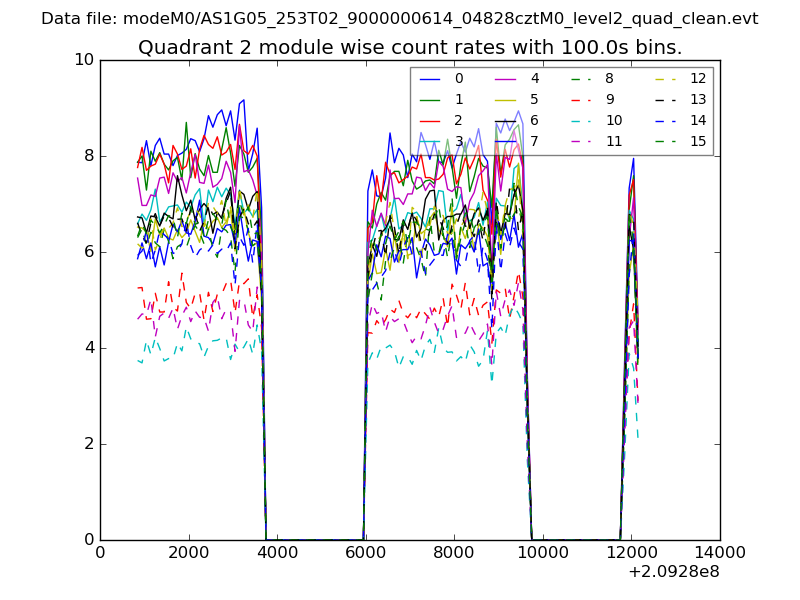
| Module-wise count rates for Quadrant B Data is divided into 100 sec bins |
 |
 |
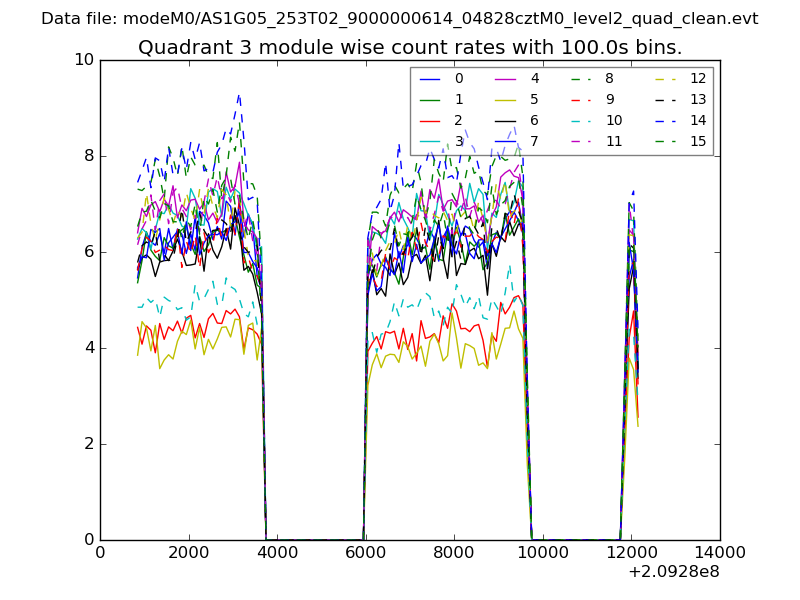
| Module-wise count rates for Quadrant C Data is divided into 100 sec bins |
 |
 |
| Module-wise count rates for Quadrant D Data is divided into 100 sec bins |
 |
 |
| Parameter | Plot |
|---|---|
| CZT HV Monitor | 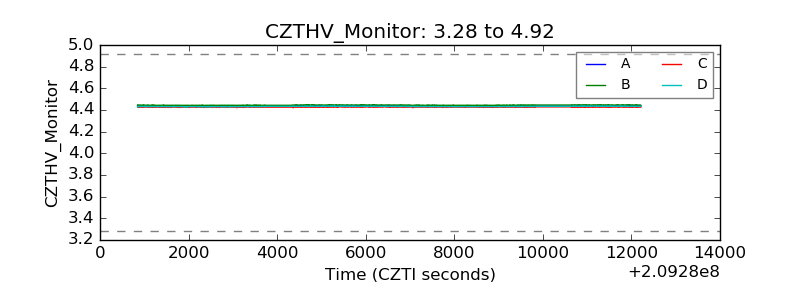 |
| D_VDD | 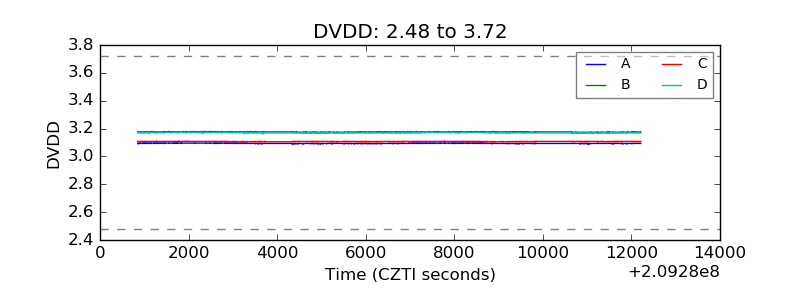 |
| Temperature 1 | 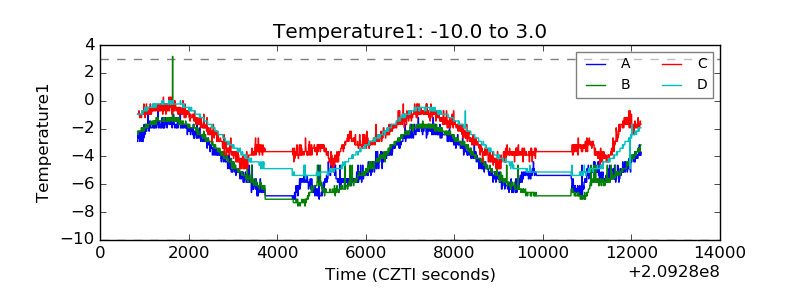 |
| Veto HV Monitor | 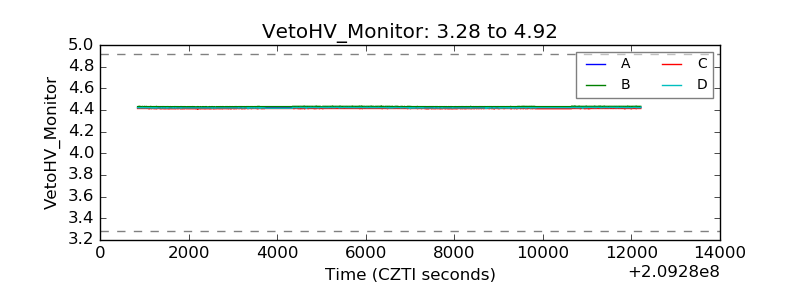 |
| Veto LLD | 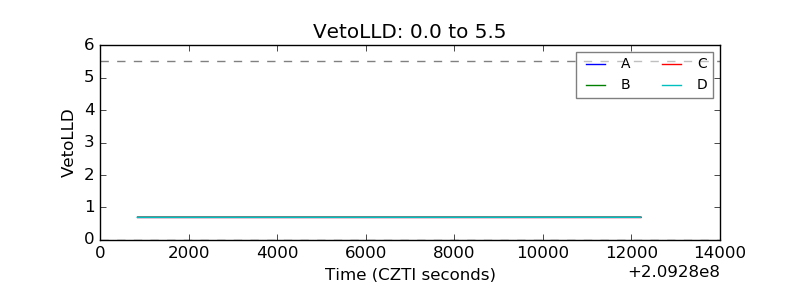 |
| Alpha Counter | 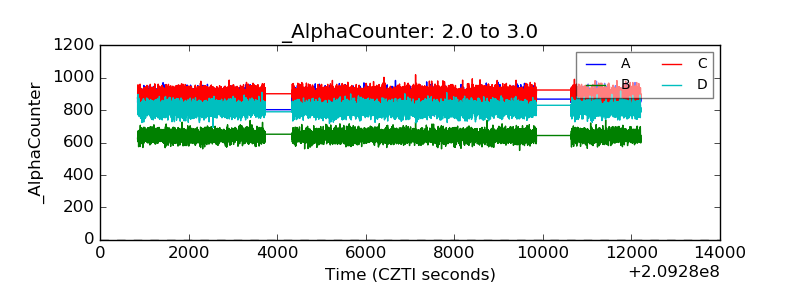 |
| _CPM_Rate | 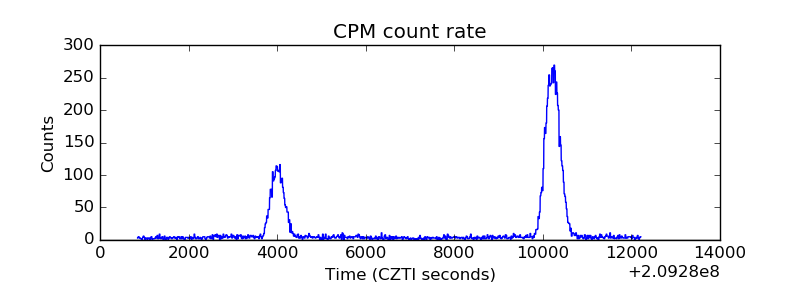 |
| CZT Counter | 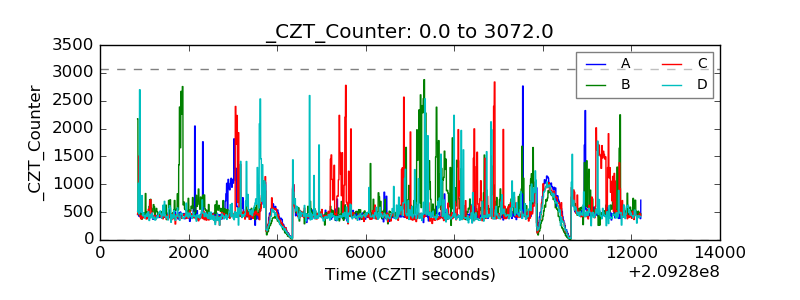 |
| +2.5 Volts monitor | 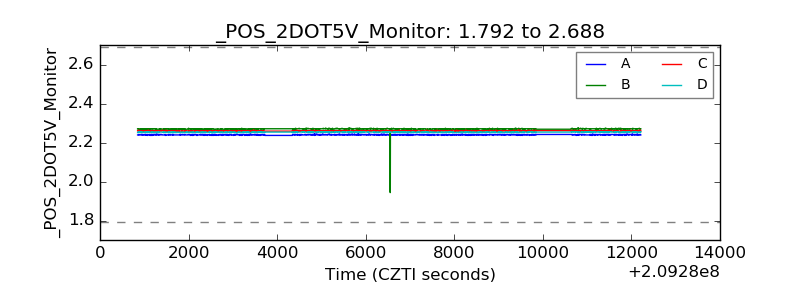 |
| +5 Volts monitor | 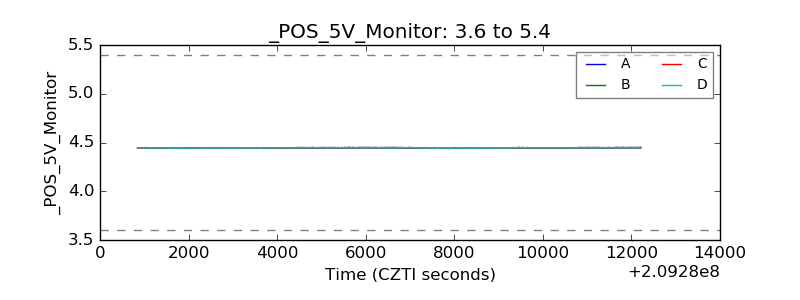 |
| _ROLL_ROT | 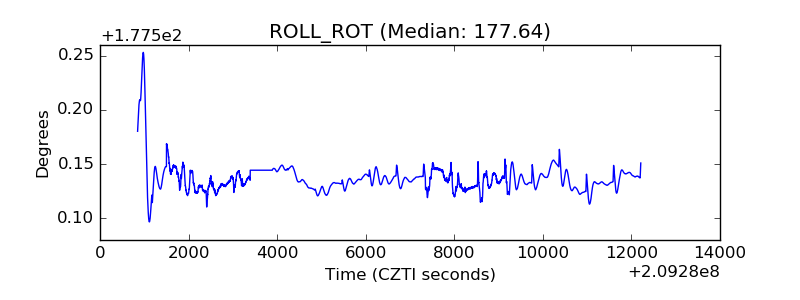 |
| _Roll_DEC | 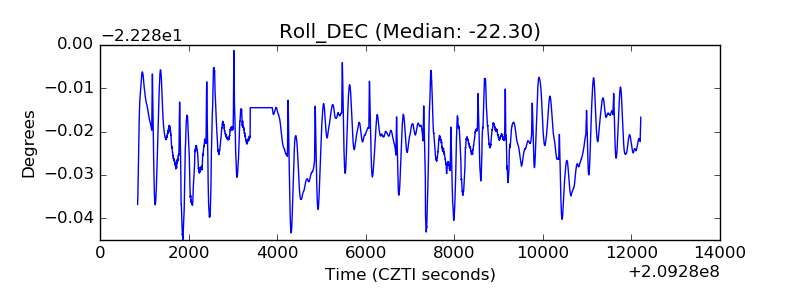 |
| _Roll_RA | 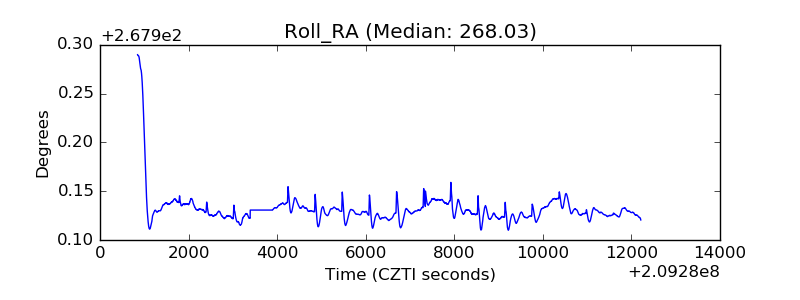 |
| Veto Counter | 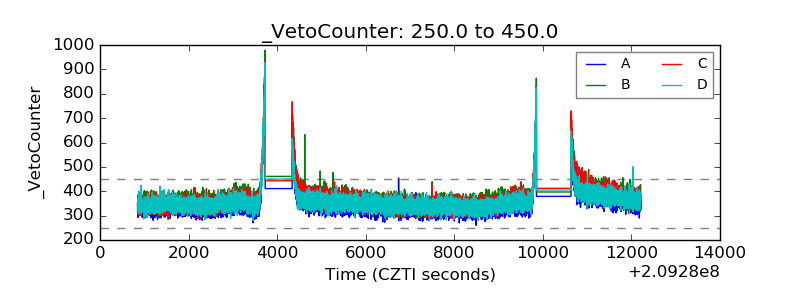 |