| Param | Original file | Final file |
|---|---|---|
| Filename | modeM0/AS1G05_253T02_9000000614_04829cztM0_level2.evt | modeM0/AS1G05_253T02_9000000614_04829cztM0_level2_quad_clean.evt |
| Size (bytes) | 517,155,840 | 72,279,360 |
| Size | 493.2 MB | 68.9 MB |
| Events in quadrant A | 3,258,168 | 433,523 |
| Events in quadrant B | 4,657,512 | 428,014 |
| Events in quadrant C | 3,557,007 | 438,839 |
| Events in quadrant D | 3,728,518 | 414,845 |
| Mode M9 | |||
|---|---|---|---|
| Quadrant | BADHDUFLAG | Total packets | Discarded packets |
| A | 0 | 9 | 0 |
| B | 0 | 9 | 0 |
| C | 0 | 9 | 0 |
| D | 0 | 10 | 0 |
| Mode SS | |||
|---|---|---|---|
| Quadrant | BADHDUFLAG | Total packets | Discarded packets |
| A | 0 | 138 | 0 |
| B | 0 | 138 | 0 |
| C | 0 | 138 | 0 |
| D | 0 | 138 | 0 |
| Mode M0 | |||
|---|---|---|---|
| Quadrant | BADHDUFLAG | Total packets | Discarded packets |
| A | 0 | 14161 | 3 |
| B | 0 | 18202 | 2 |
| C | 0 | 15235 | 2 |
| D | 0 | 15675 | 2 |
| Quadrant | Total seconds | Saturated seconds | Saturation percentage |
|---|---|---|---|
| A | 6790 | 113 | 1.664212% |
| B | 6790 | 305 | 4.491900% |
| C | 6790 | 106 | 1.561119% |
| D | 6790 | 228 | 3.357879% |
Noise dominated data is calculated using 1-second bins in cleaned event files. If a bin has >2000 counts, and if more than 50% of those come from <1% of pixels, then it is considered to be noise-dominated and hence unusable.
| Quadrant | # 1 sec bins | Bins with >0 counts | Bins with >2000 counts | High rate bins dominated by noise | Noise dominated (total time) | Noise dominated (detector-on time) | Marked lightcurve |
|---|---|---|---|---|---|---|---|
| A | 7720 | 6790 | 11 | 11 | 0.14% | 0.16% | 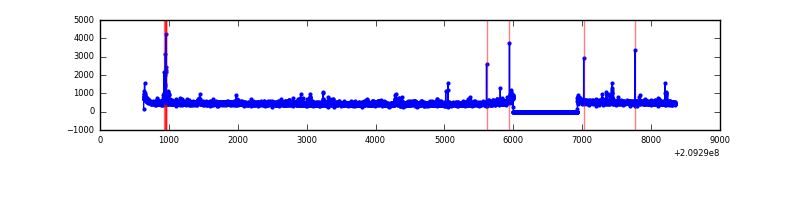 |
| B | 7720 | 6790 | 142 | 142 | 1.84% | 2.09% | 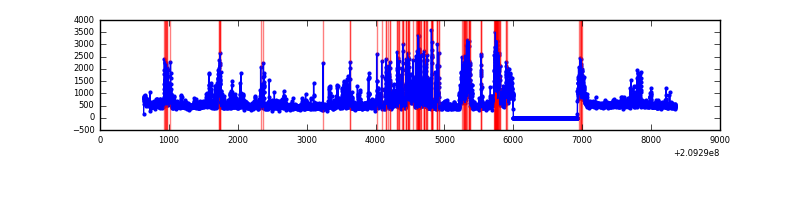 |
| C | 7720 | 6790 | 13 | 13 | 0.17% | 0.19% | 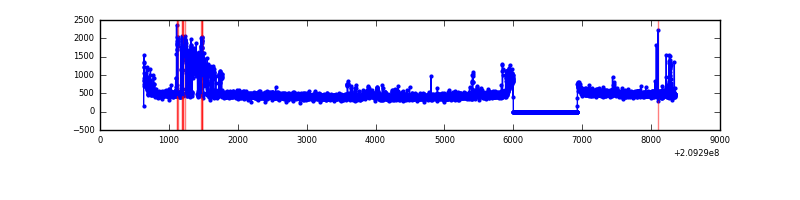 |
| D | 7720 | 6790 | 118 | 118 | 1.53% | 1.74% | 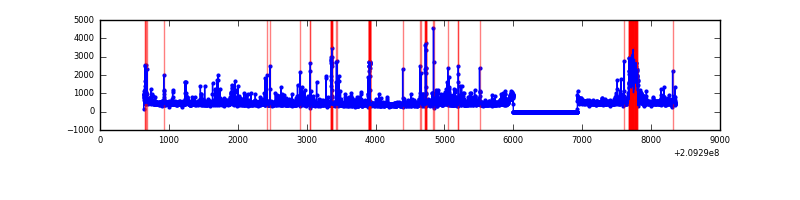 |
Top three noisy pixels from each quadrant. If the there are fewer than three noisy pixels in the level2.evt file, extra rows are filled as -1
| Pixel properties | Quadrant properties | ||||||
|---|---|---|---|---|---|---|---|
| Quadrant | DetID | PixID | Counts | Sigma | Mean | Median | Sigma |
| A | 8 | 15 | 97922 | 587.63 | 800 | 781 | 165.3 |
| A | 0 | 50 | 42957 | 255.13 | 800 | 781 | 165.3 |
| A | 13 | 251 | 22128 | 129.13 | 800 | 781 | 165.3 |
| B | 14 | 167 | 1075016 | 6919.3 | 801 | 780 | 155.3 |
| B | 10 | 16 | 324149 | 2082.86 | 801 | 780 | 155.3 |
| B | 15 | 204 | 65209 | 415.0 | 801 | 780 | 155.3 |
| C | 8 | 208 | 437656 | 2392.63 | 779 | 784 | 182.6 |
| C | 9 | 247 | 65730 | 355.69 | 779 | 784 | 182.6 |
| C | 12 | 4 | 11964 | 61.23 | 779 | 784 | 182.6 |
| D | 2 | 136 | 359490 | 1922.74 | 770 | 748 | 186.6 |
| D | 13 | 235 | 154267 | 822.81 | 770 | 748 | 186.6 |
| D | 10 | 15 | 122141 | 650.63 | 770 | 748 | 186.6 |
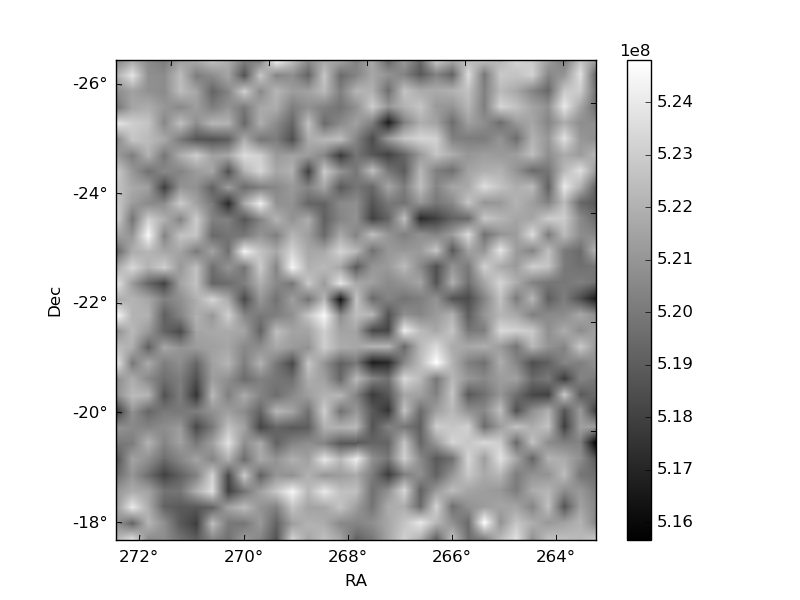
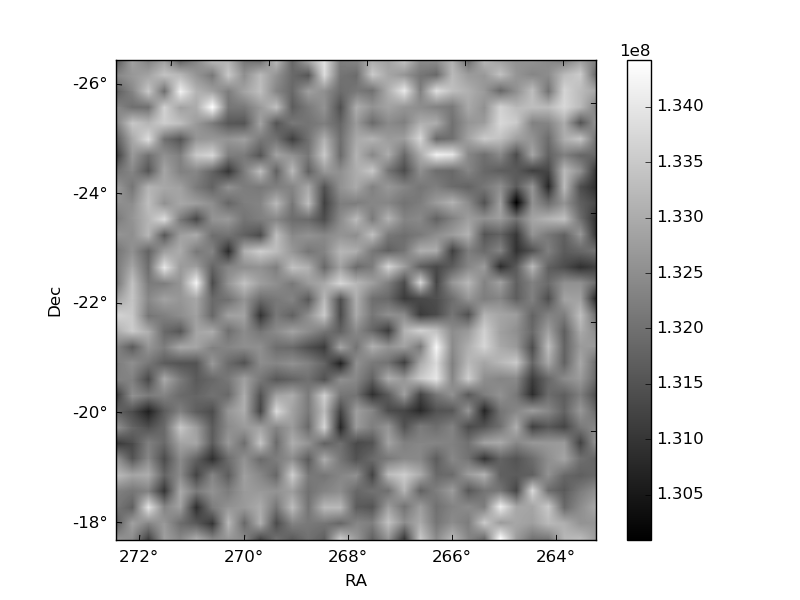
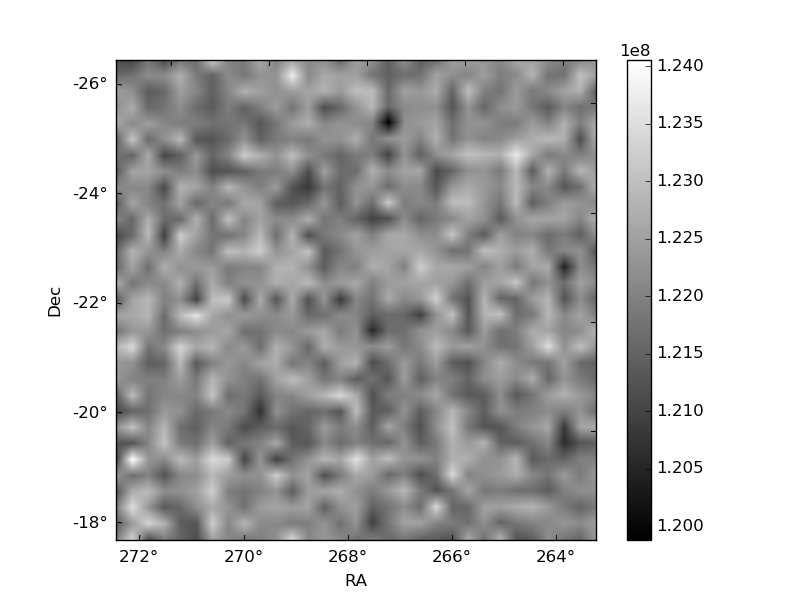
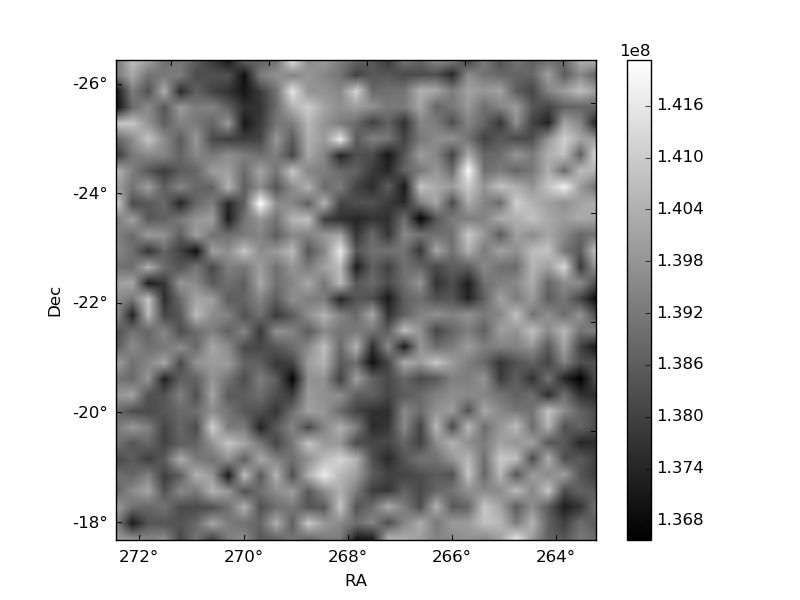
Histogram calculated using DETX and DETY for each event in the final _common_clean file
| Quadrant A | 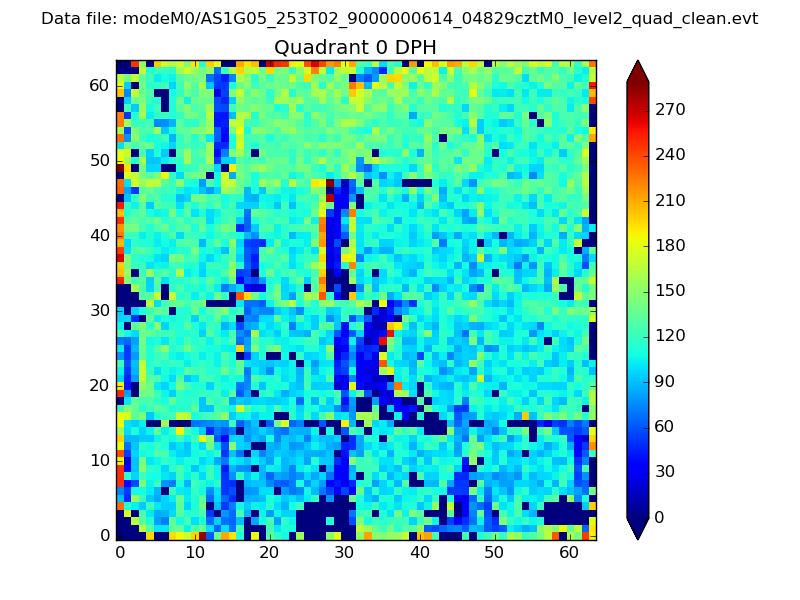 |
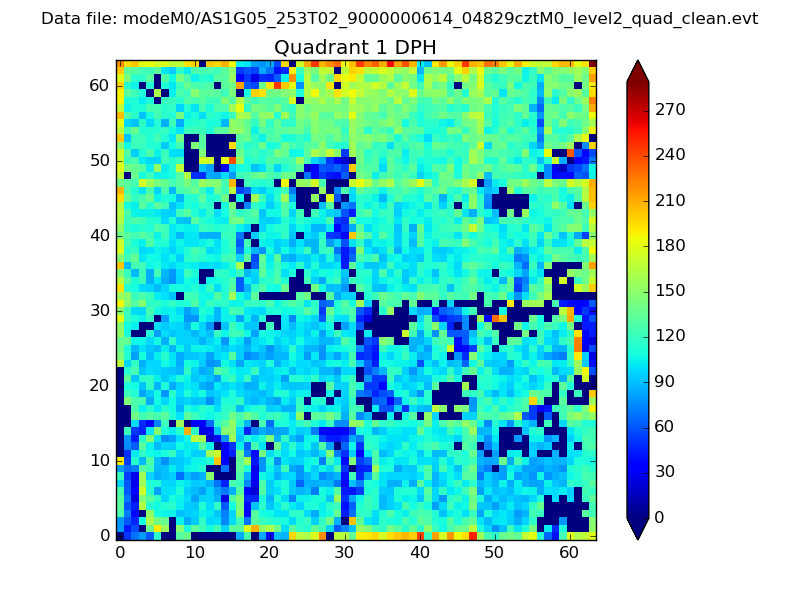 |
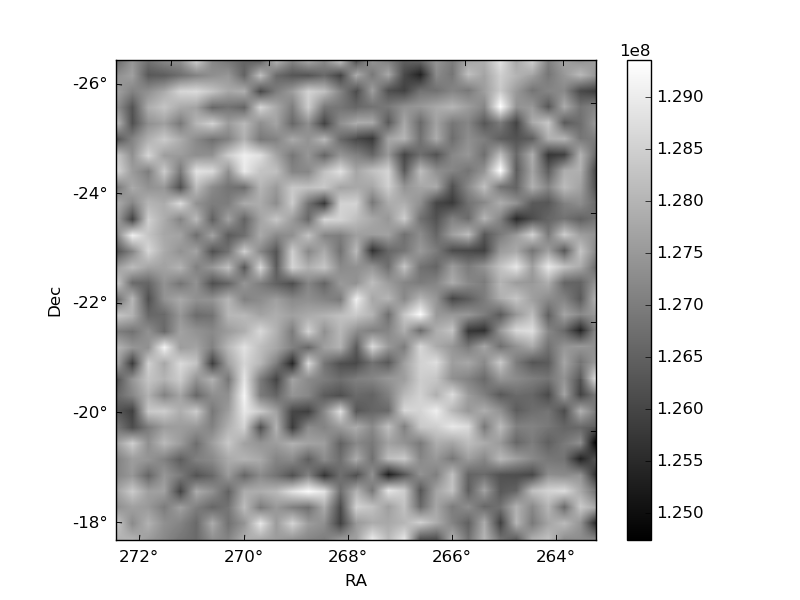
Quadrant B |
|---|---|---|---|
| Quadrant D | 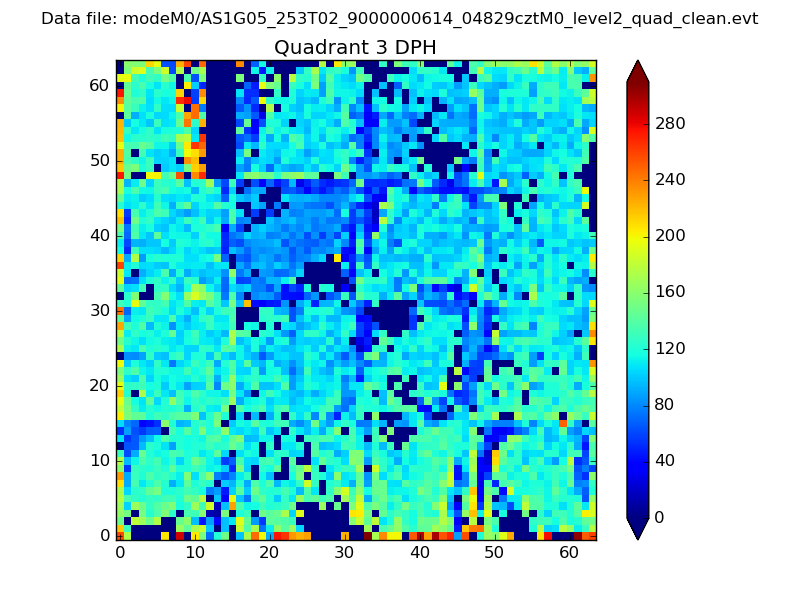 |
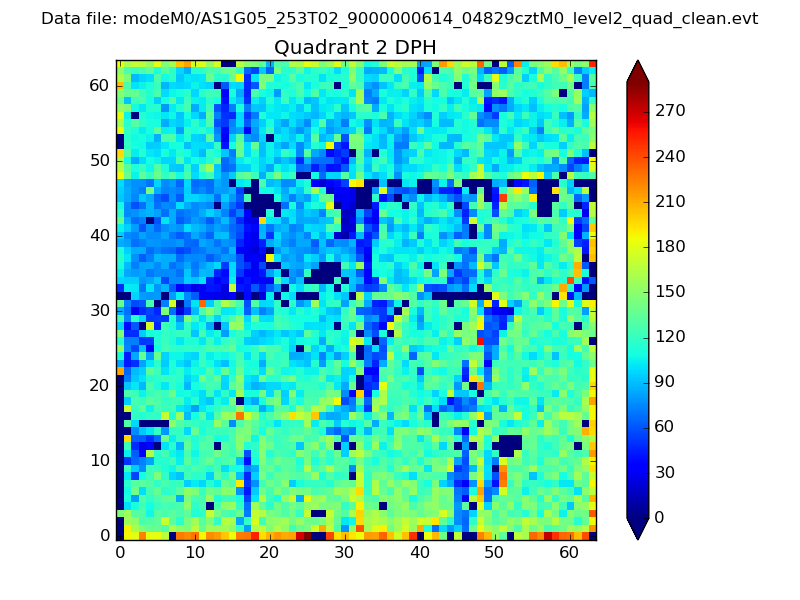 |
Quadrant C |
| Plot type | Count rate plots | Images |
|---|---|---|
| Comparison with Poisson distribution Blue bars denote a histogram of data divided into 1 sec bins. Red curve is a Poisson curve with rate = median count rate of data. |
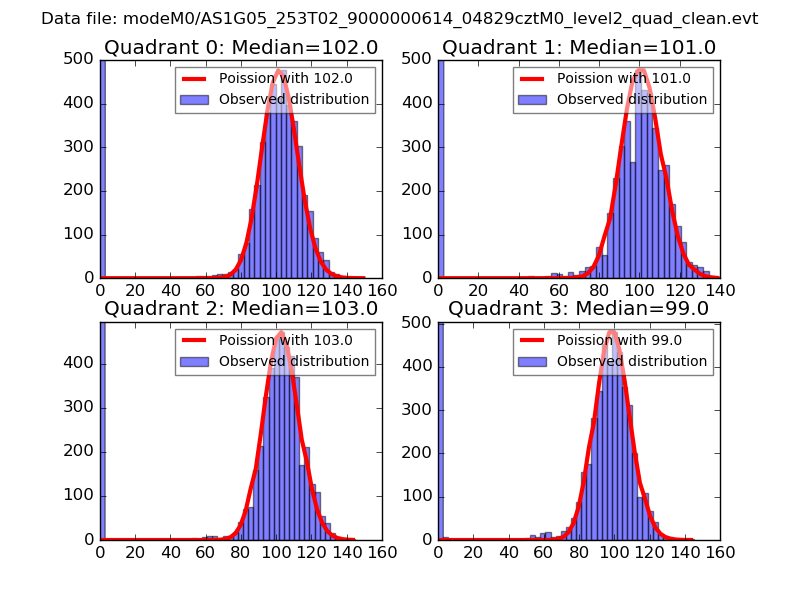 |
 |
| Quadrant-wise count rates Data is divided into 100 sec bins |
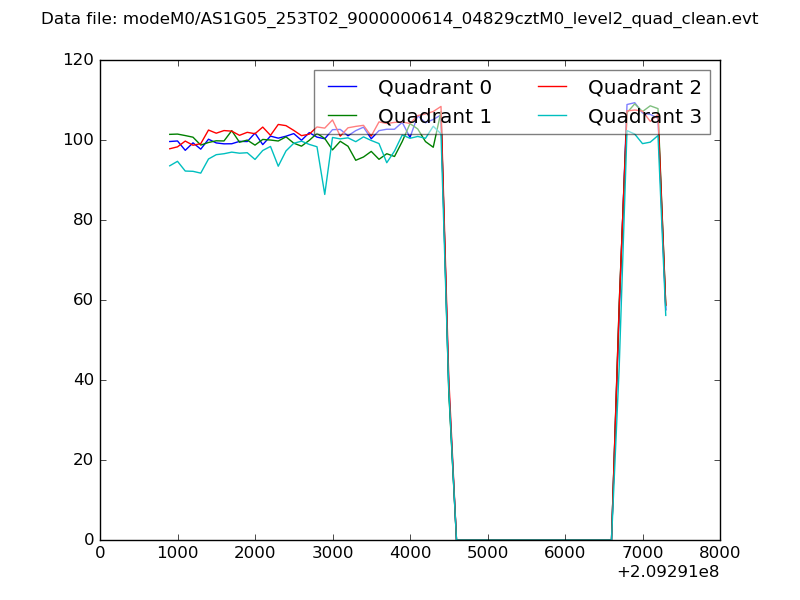 |
|
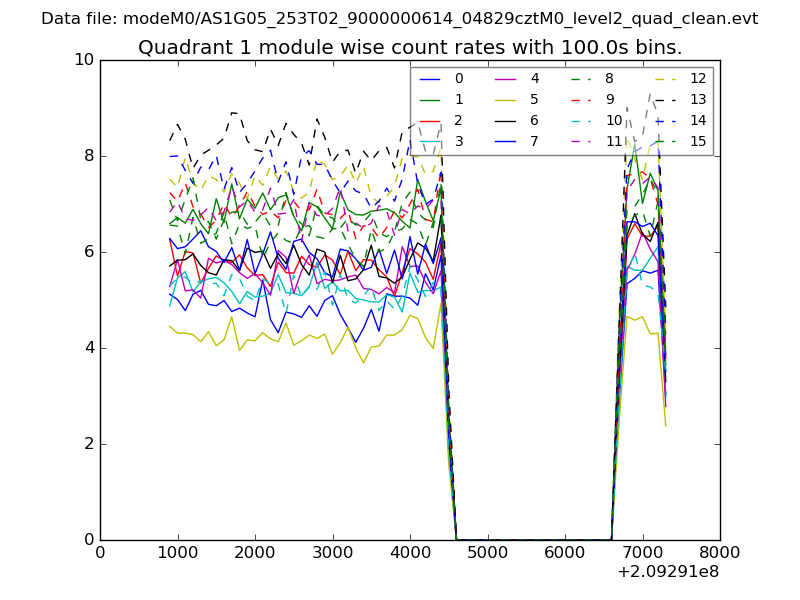
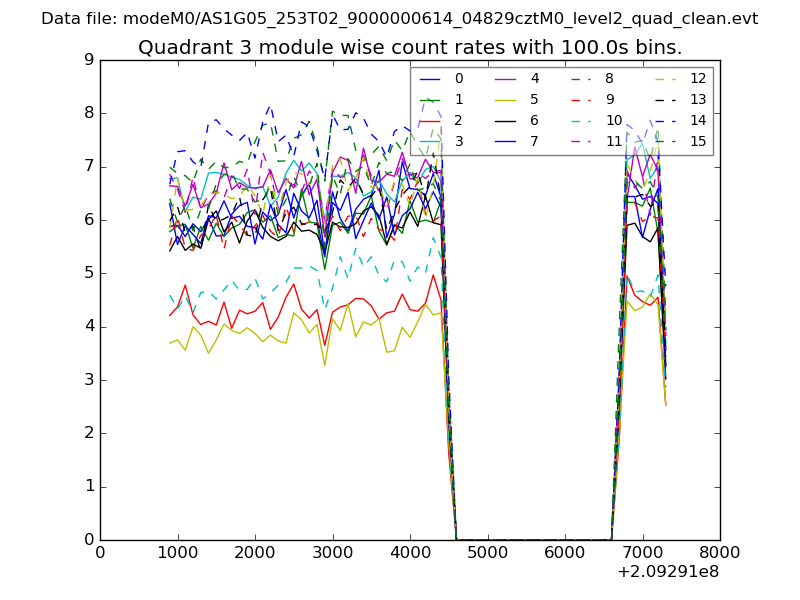
| Module-wise count rates for Quadrant A Data is divided into 100 sec bins |
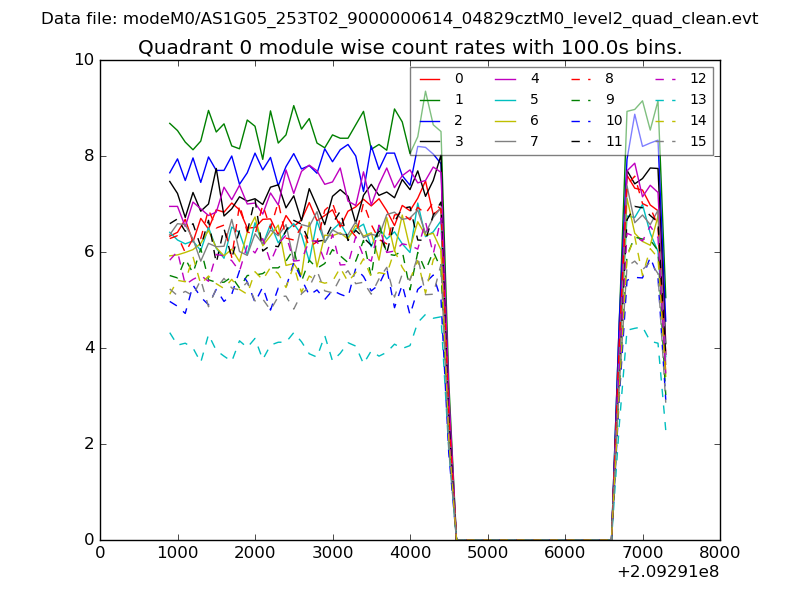 |
 |
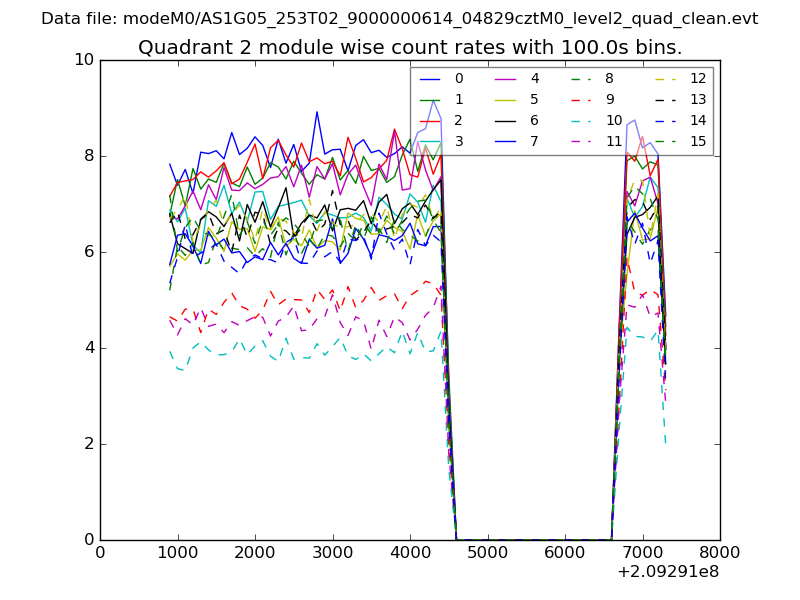
| Module-wise count rates for Quadrant B Data is divided into 100 sec bins |
 |
 |
| Module-wise count rates for Quadrant C Data is divided into 100 sec bins |
 |
 |
| Module-wise count rates for Quadrant D Data is divided into 100 sec bins |
 |
 |
| Parameter | Plot |
|---|---|
| CZT HV Monitor | 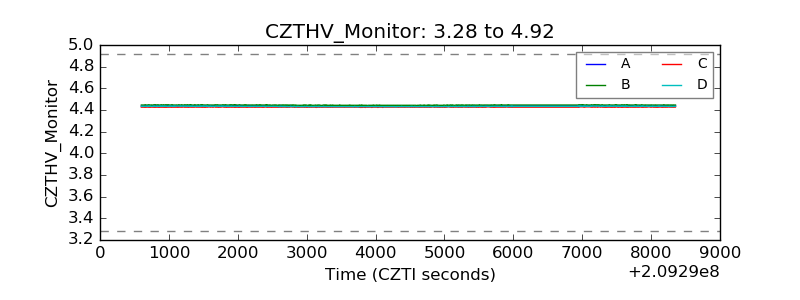 |
| D_VDD | 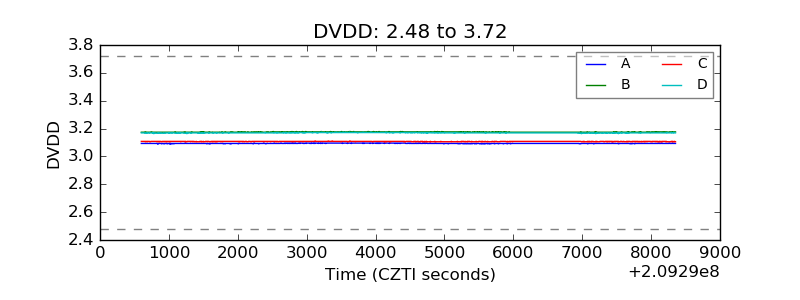 |
| Temperature 1 | 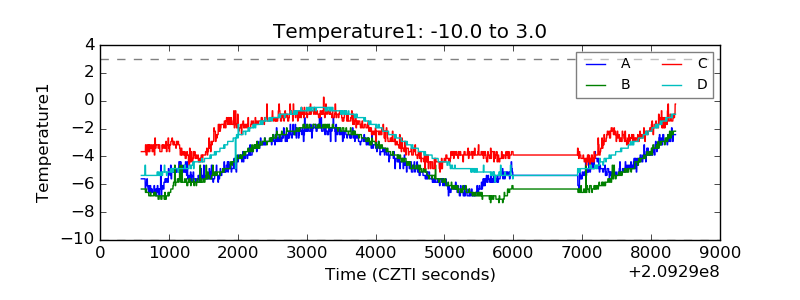 |
| Veto HV Monitor | 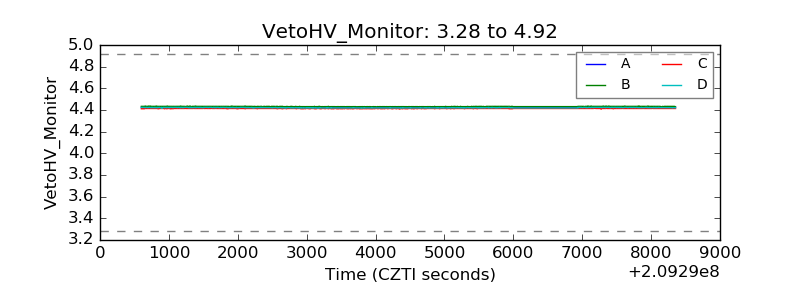 |
| Veto LLD | 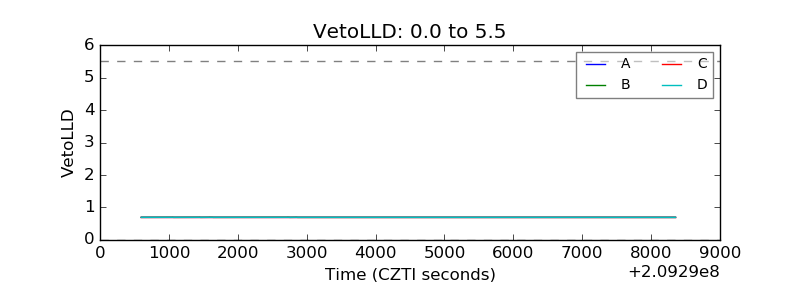 |
| Alpha Counter | 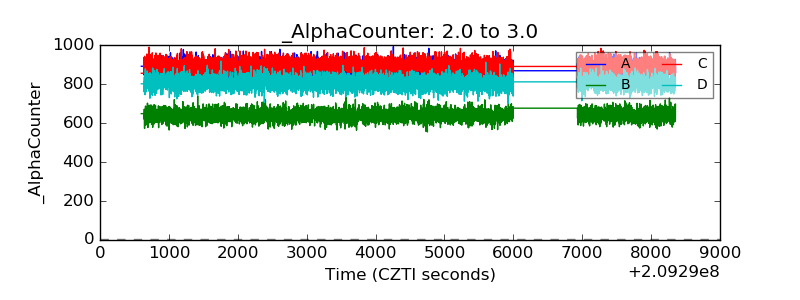 |
| _CPM_Rate | 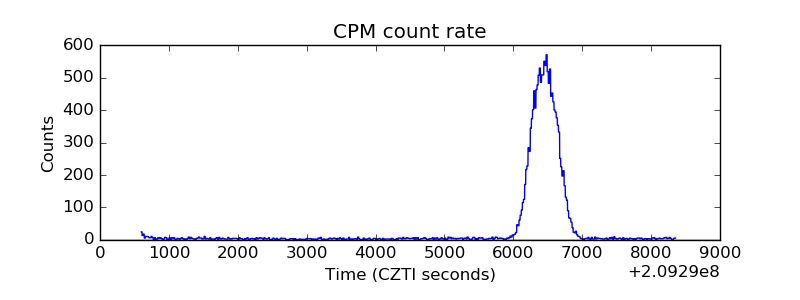 |
| CZT Counter | 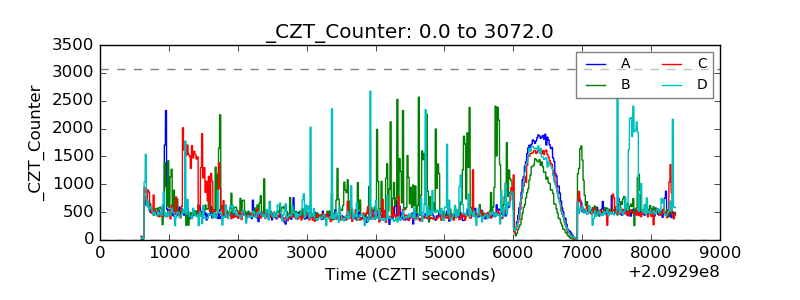 |
| +2.5 Volts monitor | 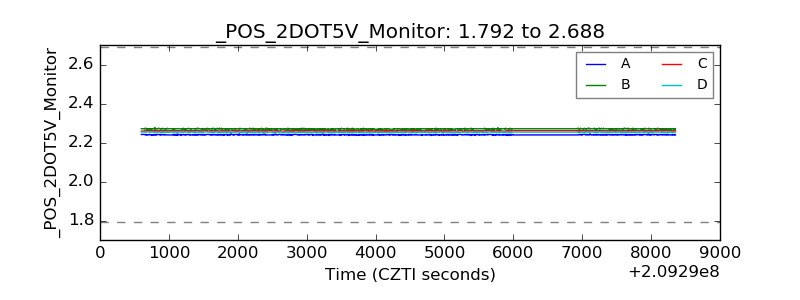 |
| +5 Volts monitor | 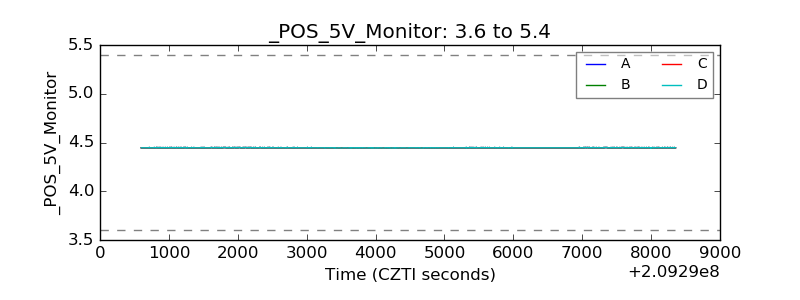 |
| _ROLL_ROT | 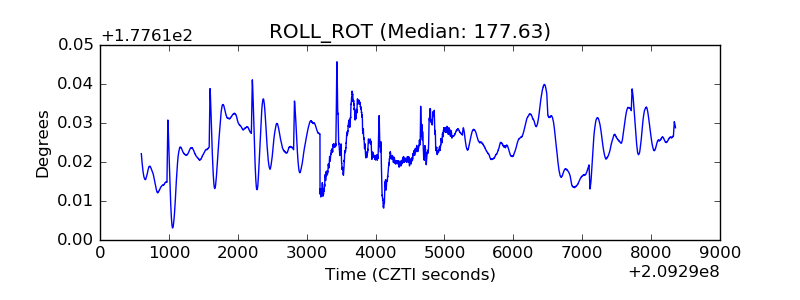 |
| _Roll_DEC | 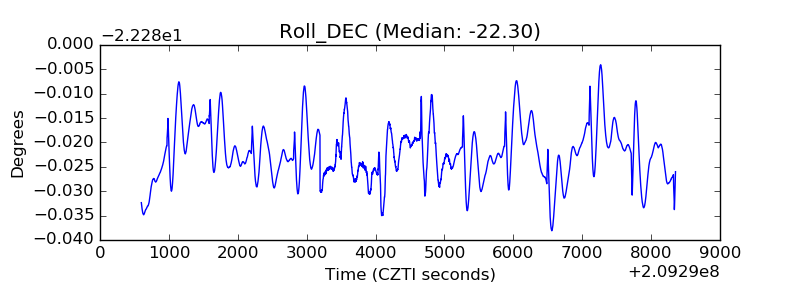 |
| _Roll_RA | 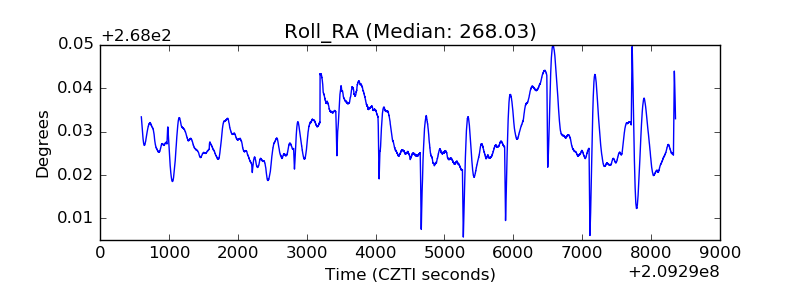 |
| Veto Counter | 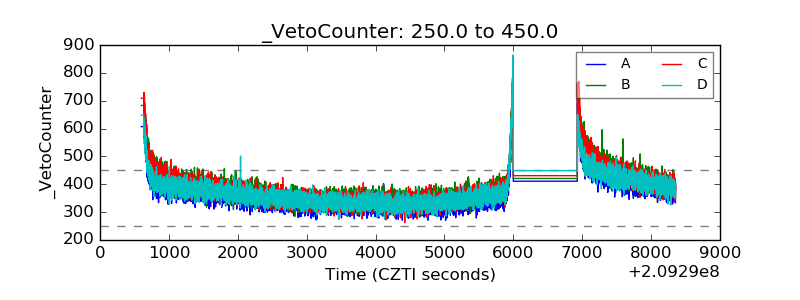 |