| Param | Original file | Final file |
|---|---|---|
| Filename | modeM0/AS1G05_253T02_9000000614_04832cztM0_level2.evt | modeM0/AS1G05_253T02_9000000614_04832cztM0_level2_quad_clean.evt |
| Size (bytes) | 757,134,720 | 141,926,400 |
| Size | 722.1 MB | 135.4 MB |
| Events in quadrant A | 5,373,719 | 903,815 |
| Events in quadrant B | 6,360,524 | 898,559 |
| Events in quadrant C | 4,827,650 | 906,615 |
| Events in quadrant D | 5,661,628 | 867,094 |
| Mode M9 | |||
|---|---|---|---|
| Quadrant | BADHDUFLAG | Total packets | Discarded packets |
| A | 0 | 22 | 0 |
| B | 0 | 22 | 0 |
| C | 0 | 22 | 0 |
| D | 0 | 22 | 1 |
| Mode SS | |||
|---|---|---|---|
| Quadrant | BADHDUFLAG | Total packets | Discarded packets |
| A | 0 | 218 | 2 |
| B | 0 | 218 | 10 |
| C | 0 | 218 | 0 |
| D | 0 | 218 | 4 |
| Mode M0 | |||
|---|---|---|---|
| Quadrant | BADHDUFLAG | Total packets | Discarded packets |
| A | 0 | 23772 | 545 |
| B | 0 | 26296 | 594 |
| C | 0 | 22299 | 511 |
| D | 0 | 24744 | 647 |
| Quadrant | Total seconds | Saturated seconds | Saturation percentage |
|---|---|---|---|
| A | 10435 | 283 | 2.712027% |
| B | 10419 | 280 | 2.687398% |
| C | 10428 | 128 | 1.227465% |
| D | 10404 | 198 | 1.903114% |
Noise dominated data is calculated using 1-second bins in cleaned event files. If a bin has >2000 counts, and if more than 50% of those come from <1% of pixels, then it is considered to be noise-dominated and hence unusable.
| Quadrant | # 1 sec bins | Bins with >0 counts | Bins with >2000 counts | High rate bins dominated by noise | Noise dominated (total time) | Noise dominated (detector-on time) | Marked lightcurve |
|---|---|---|---|---|---|---|---|
| A | 12862 | 10566 | 100 | 100 | 0.78% | 0.95% | 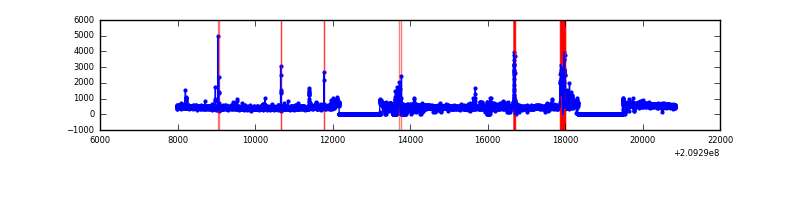 |
| B | 12862 | 10564 | 111 | 111 | 0.86% | 1.05% | 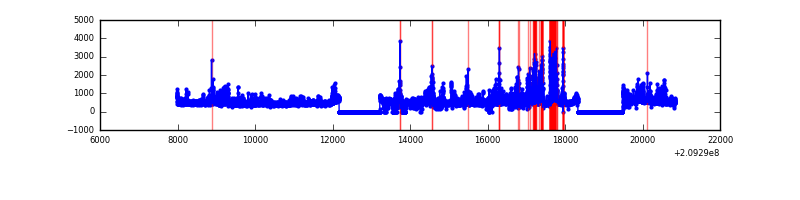 |
| C | 12862 | 10556 | 5 | 5 | 0.04% | 0.05% | 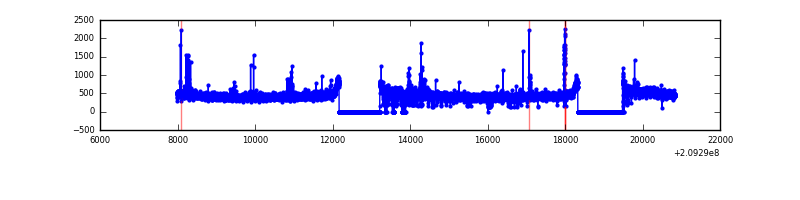 |
| D | 12862 | 10549 | 69 | 69 | 0.54% | 0.65% | 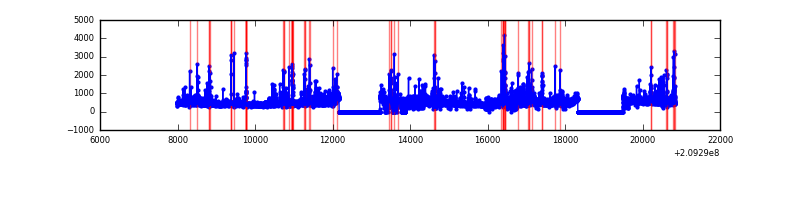 |
Top three noisy pixels from each quadrant. If the there are fewer than three noisy pixels in the level2.evt file, extra rows are filled as -1
| Pixel properties | Quadrant properties | ||||||
|---|---|---|---|---|---|---|---|
| Quadrant | DetID | PixID | Counts | Sigma | Mean | Median | Sigma |
| A | 13 | 251 | 386707 | 1526.11 | 1240 | 1216 | 252.6 |
| A | 8 | 15 | 119319 | 467.55 | 1240 | 1216 | 252.6 |
| A | 0 | 50 | 57755 | 223.83 | 1240 | 1216 | 252.6 |
| B | 10 | 16 | 708436 | 2986.75 | 1238 | 1210 | 236.8 |
| B | 14 | 167 | 513371 | 2162.95 | 1238 | 1210 | 236.8 |
| B | 15 | 204 | 152841 | 640.37 | 1238 | 1210 | 236.8 |
| C | 9 | 247 | 98889 | 352.95 | 1197 | 1202 | 276.8 |
| C | 1 | 16 | 49267 | 173.66 | 1197 | 1202 | 276.8 |
| C | 13 | 61 | 10057 | 31.99 | 1197 | 1202 | 276.8 |
| D | 2 | 136 | 422717 | 1478.26 | 1197 | 1164 | 285.2 |
| D | 13 | 235 | 248918 | 868.8 | 1197 | 1164 | 285.2 |
| D | 10 | 15 | 149399 | 519.82 | 1197 | 1164 | 285.2 |
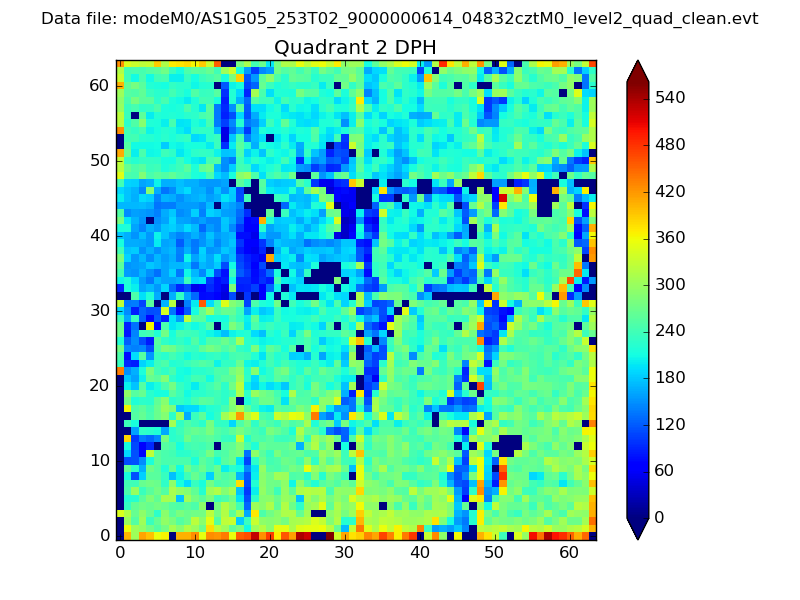
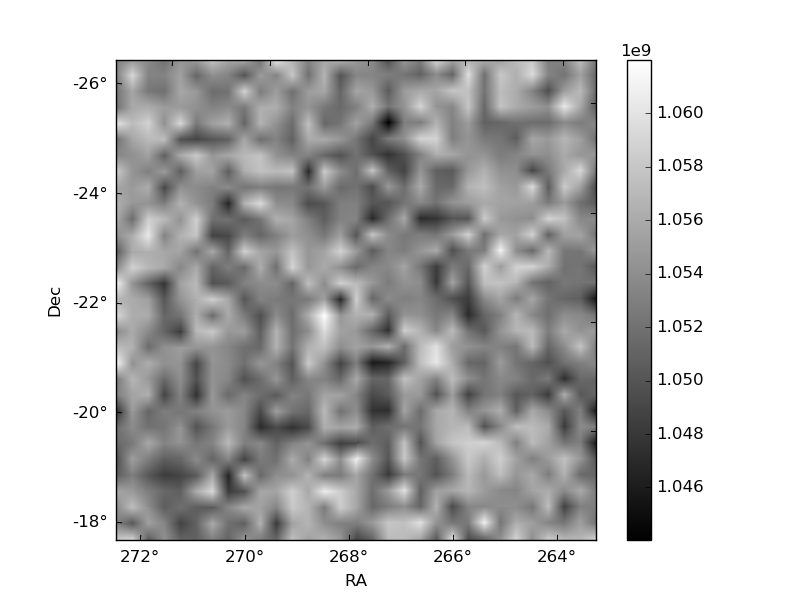
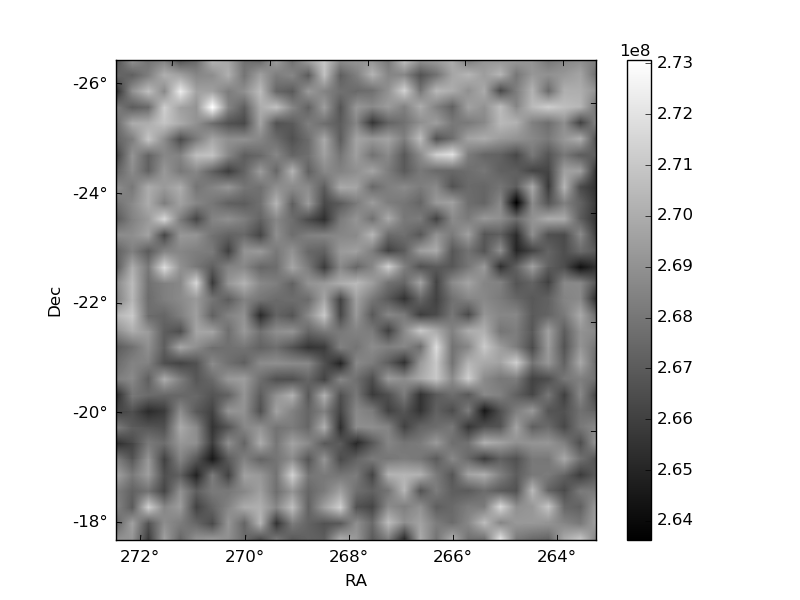
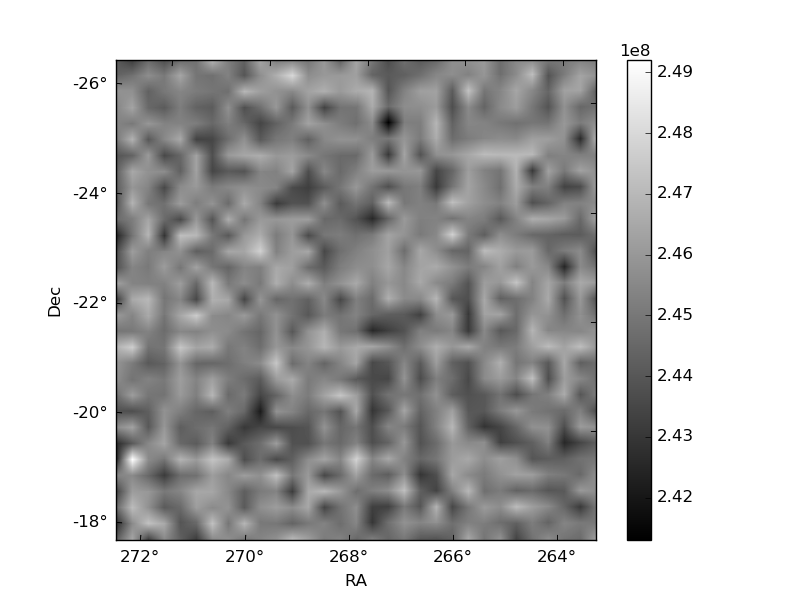
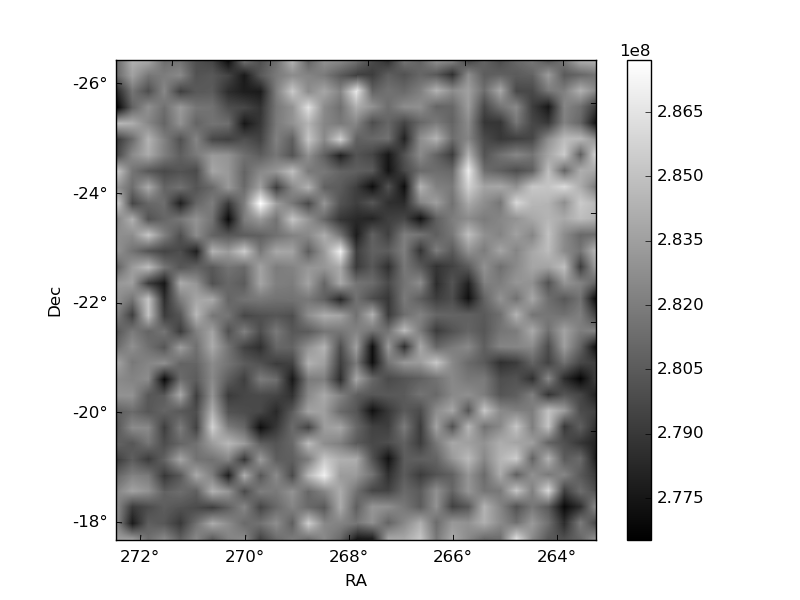
Histogram calculated using DETX and DETY for each event in the final _common_clean file
| Quadrant A | 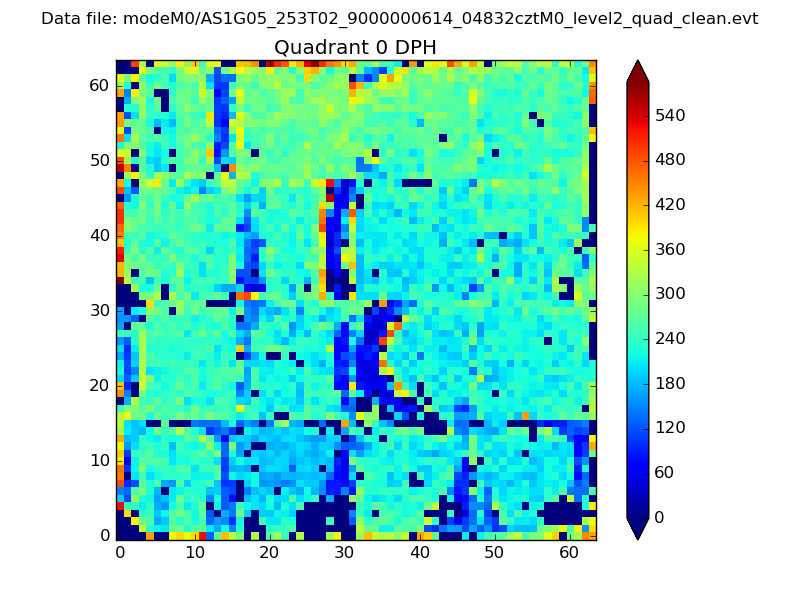 |
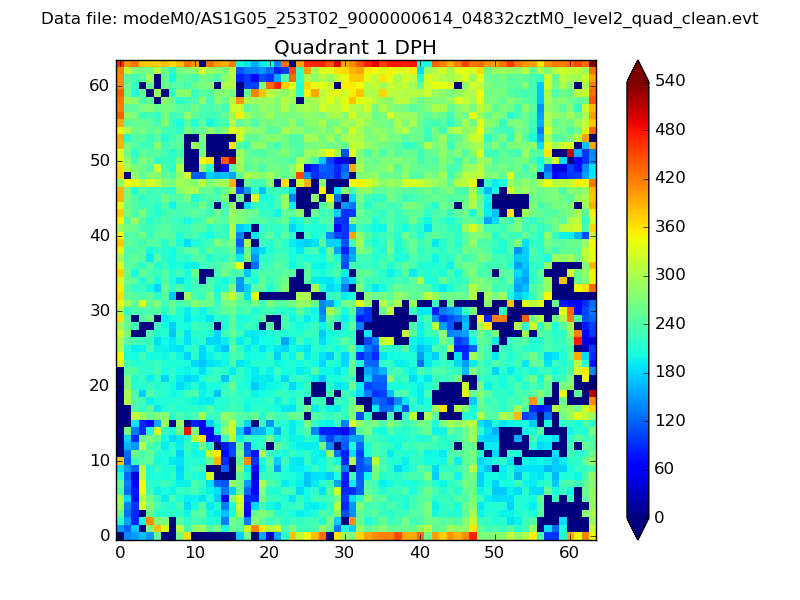 |
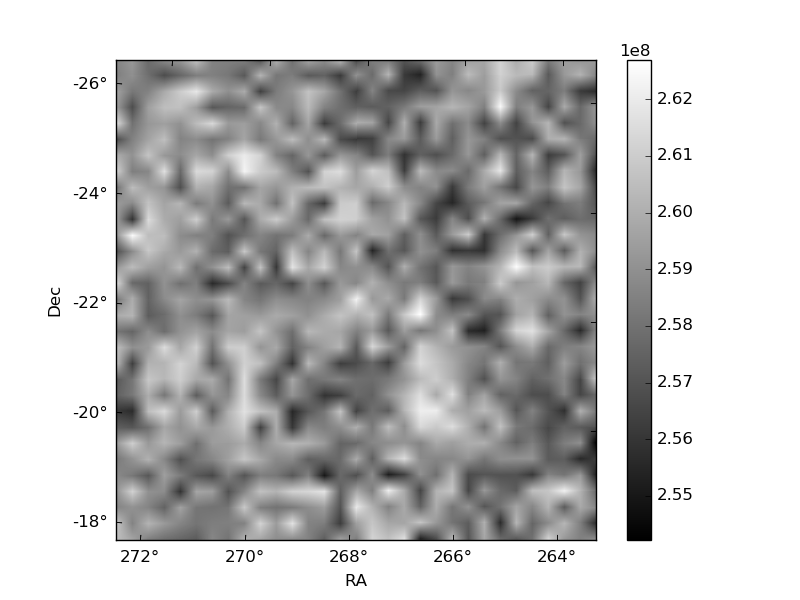
Quadrant B |
|---|---|---|---|
| Quadrant D | 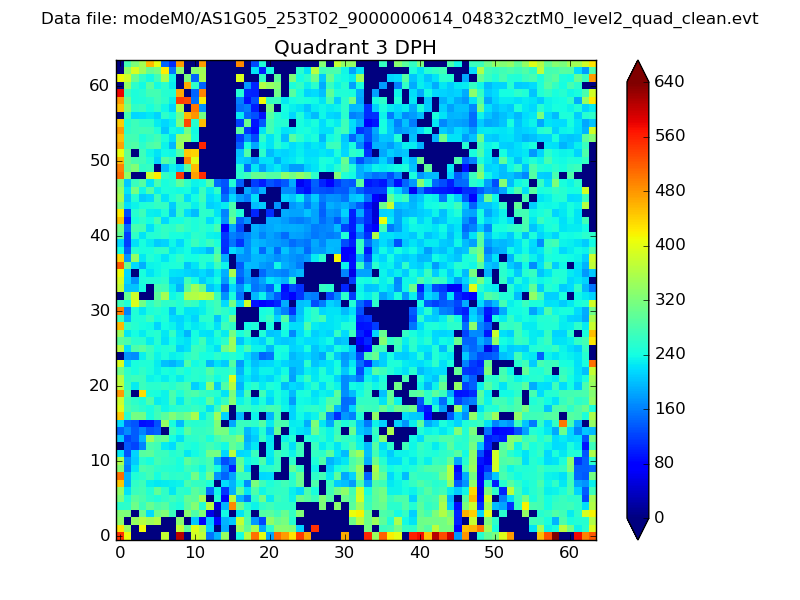 |
 |
Quadrant C |
| Plot type | Count rate plots | Images |
|---|---|---|
| Comparison with Poisson distribution Blue bars denote a histogram of data divided into 1 sec bins. Red curve is a Poisson curve with rate = median count rate of data. |
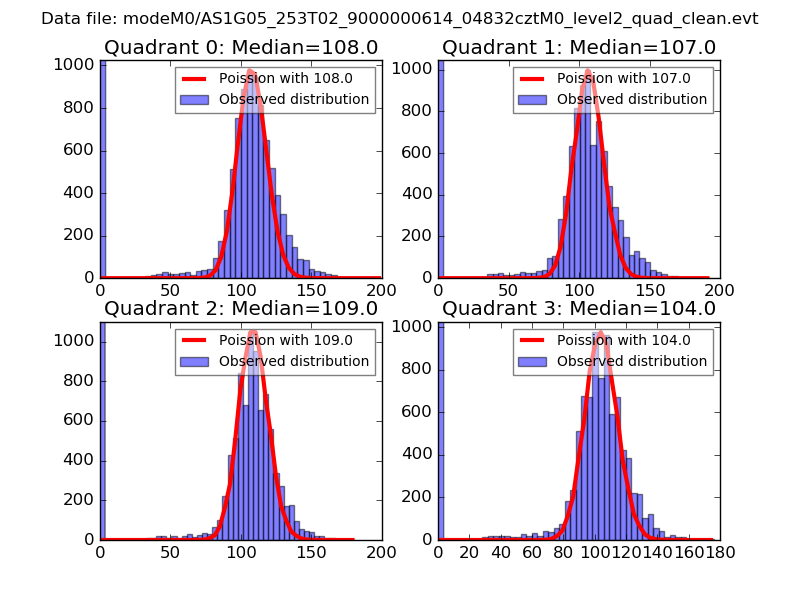 |
 |
| Quadrant-wise count rates Data is divided into 100 sec bins |
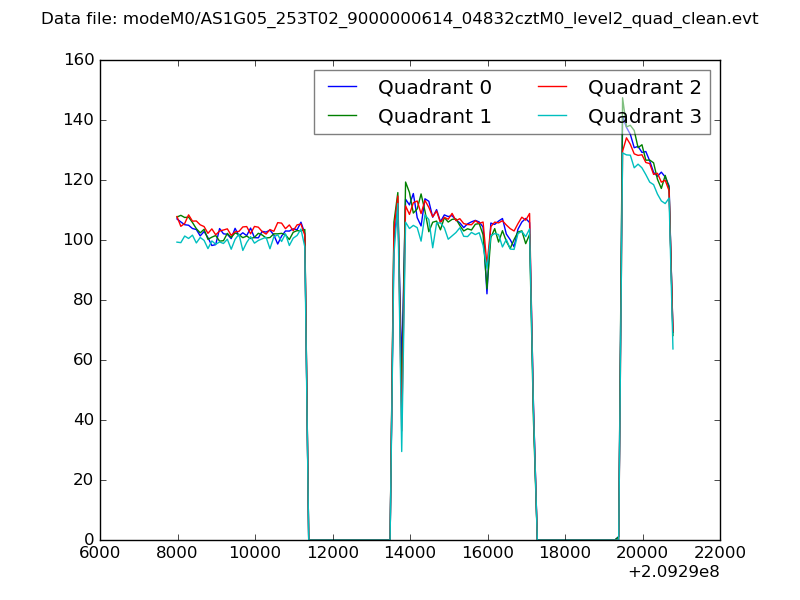 |
|
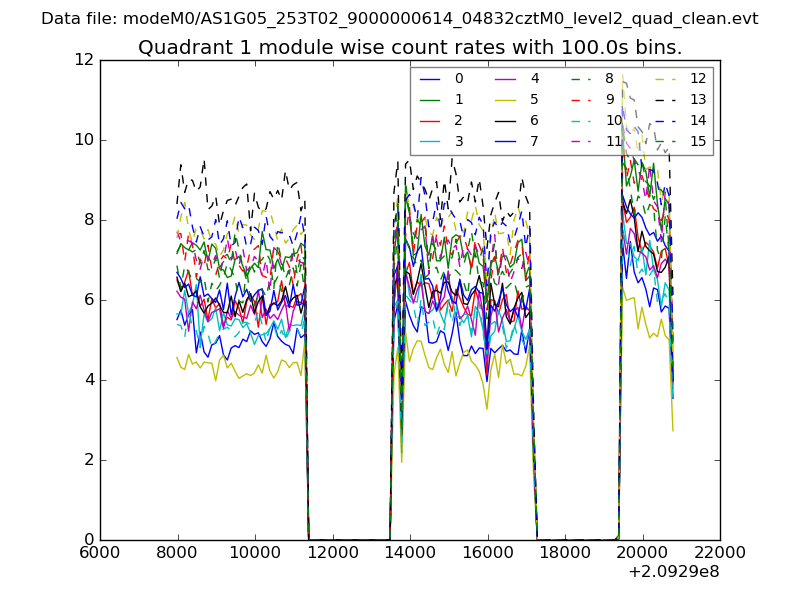
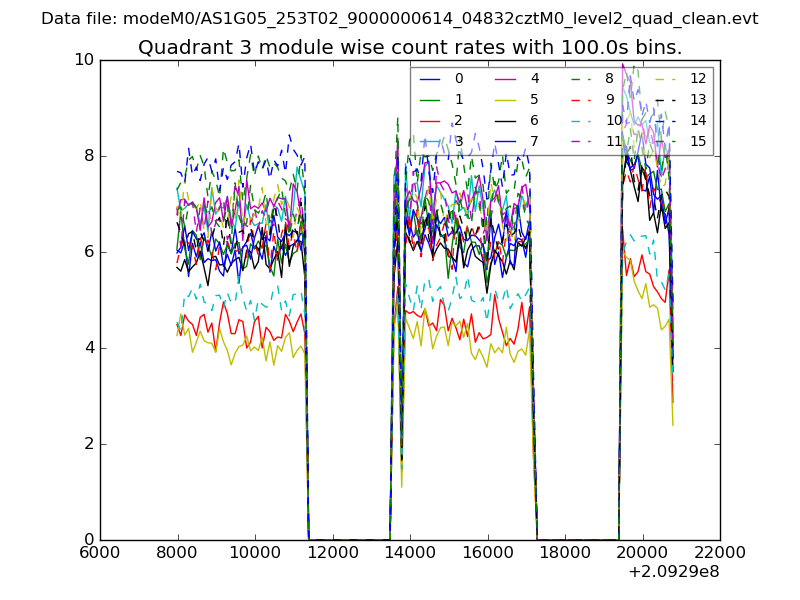
| Module-wise count rates for Quadrant A Data is divided into 100 sec bins |
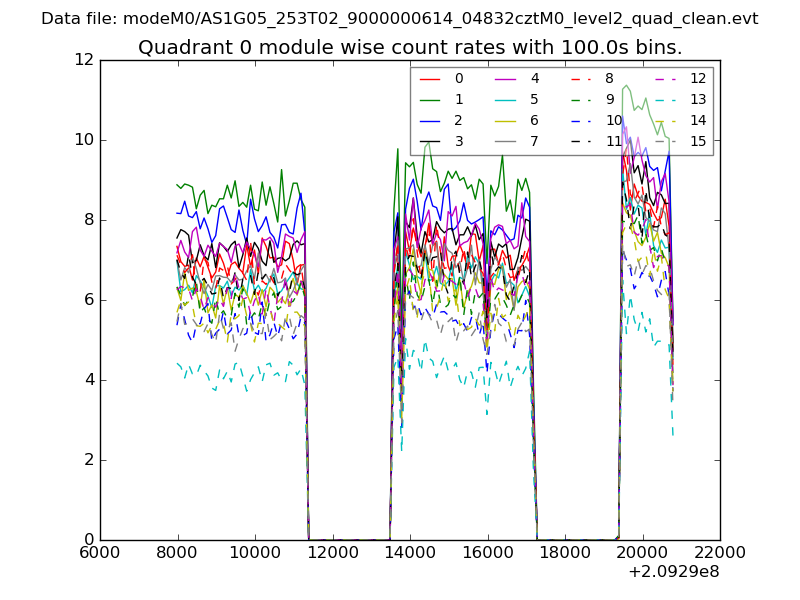 |
 |
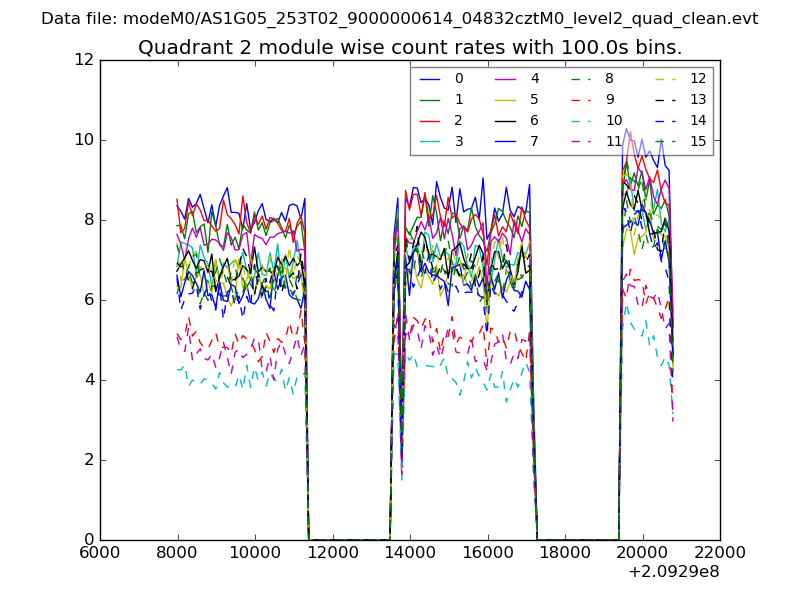
| Module-wise count rates for Quadrant B Data is divided into 100 sec bins |
 |
 |
| Module-wise count rates for Quadrant C Data is divided into 100 sec bins |
 |
 |
| Module-wise count rates for Quadrant D Data is divided into 100 sec bins |
 |
 |
| Parameter | Plot |
|---|---|
| CZT HV Monitor | 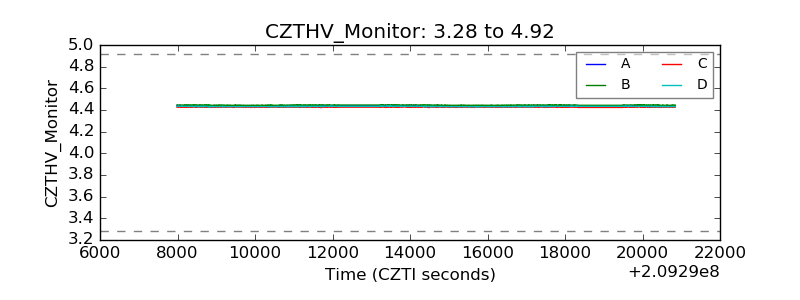 |
| D_VDD | 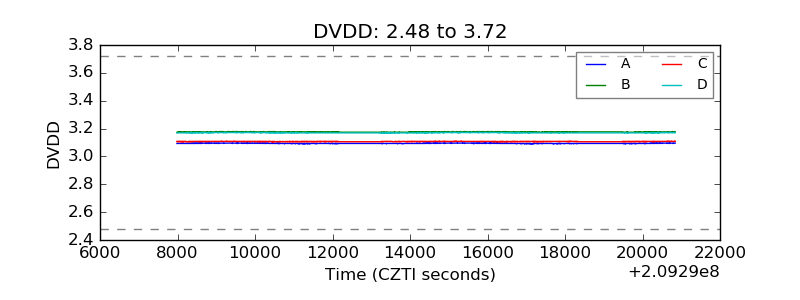 |
| Temperature 1 | 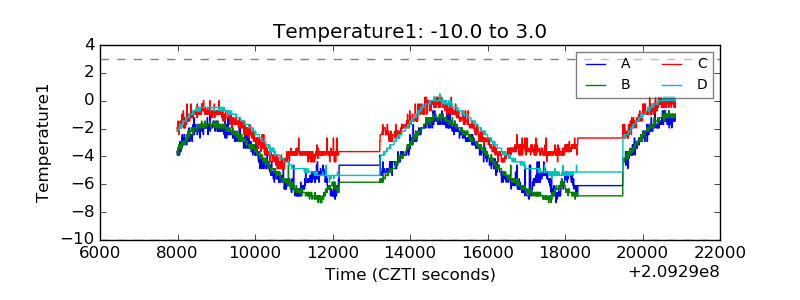 |
| Veto HV Monitor | 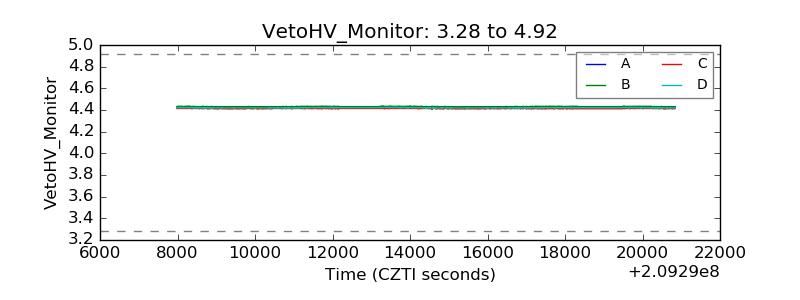 |
| Veto LLD | 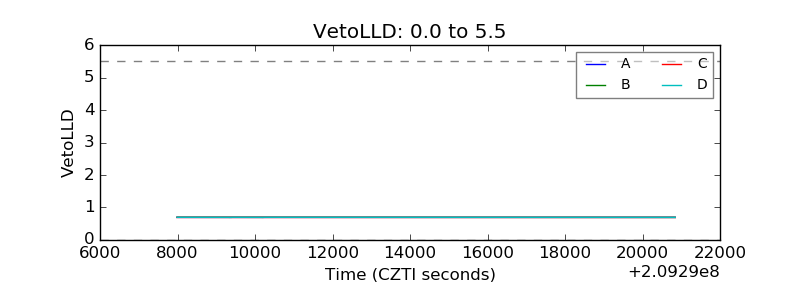 |
| Alpha Counter | 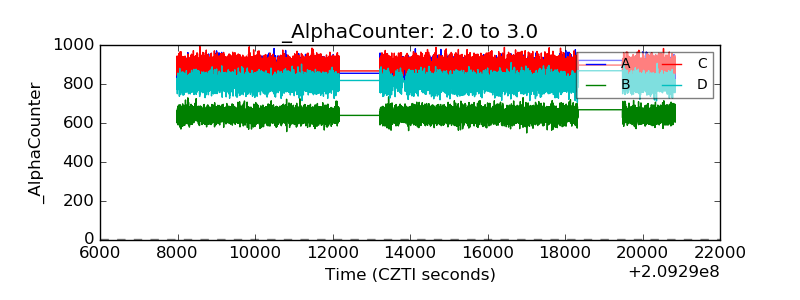 |
| _CPM_Rate | 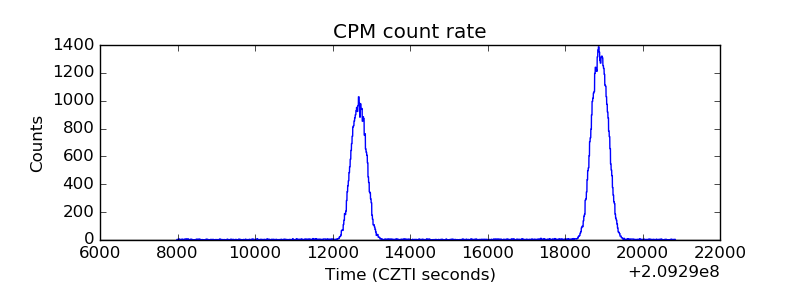 |
| CZT Counter | 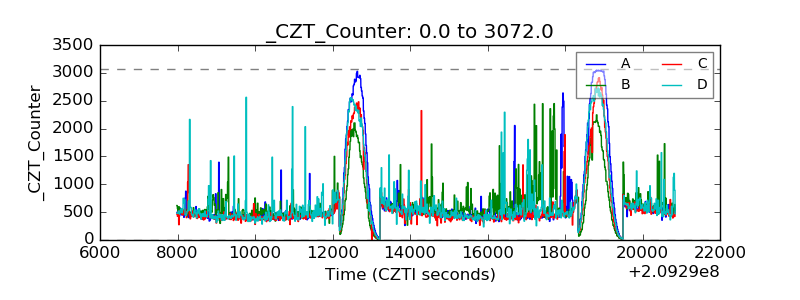 |
| +2.5 Volts monitor |  |
| +5 Volts monitor |  |
| _ROLL_ROT | 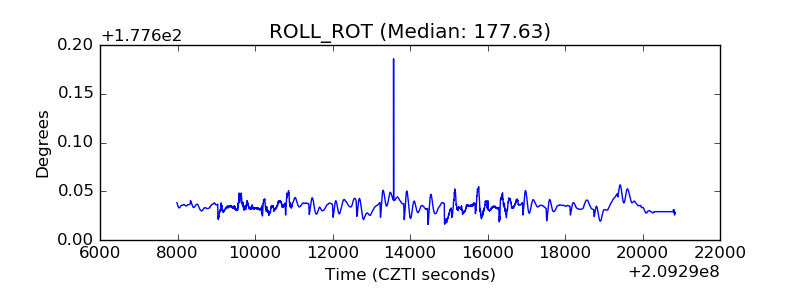 |
| _Roll_DEC | 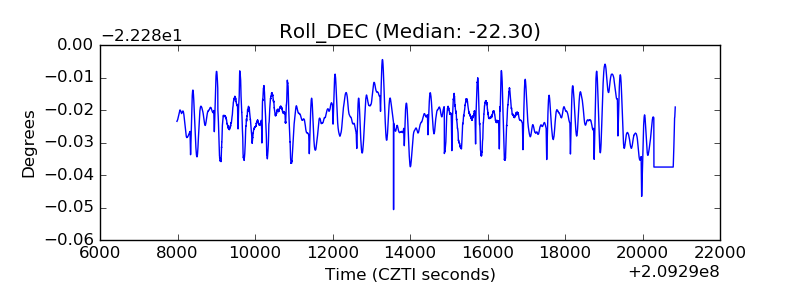 |
| _Roll_RA | 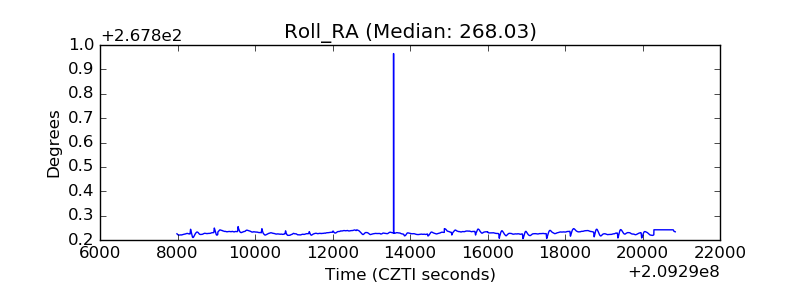 |
| Veto Counter | 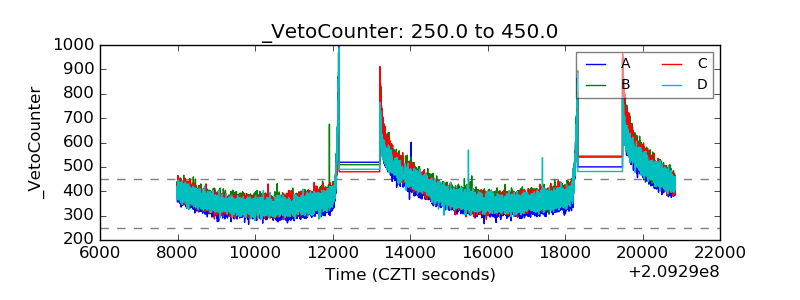 |