| Param | Original file | Final file |
|---|---|---|
| Filename | modeM0/AS1G05_253T02_9000000614_04838cztM0_level2.evt | modeM0/AS1G05_253T02_9000000614_04838cztM0_level2_quad_clean.evt |
| Size (bytes) | 538,505,280 | 88,018,560 |
| Size | 513.6 MB | 83.9 MB |
| Events in quadrant A | 3,570,863 | 539,945 |
| Events in quadrant B | 3,742,338 | 538,885 |
| Events in quadrant C | 3,492,330 | 542,355 |
| Events in quadrant D | 4,983,825 | 511,894 |
| Mode M9 | |||
|---|---|---|---|
| Quadrant | BADHDUFLAG | Total packets | Discarded packets |
| A | 0 | 11 | 0 |
| B | 0 | 11 | 0 |
| C | 0 | 11 | 0 |
| D | 0 | 11 | 0 |
| Mode SS | |||
|---|---|---|---|
| Quadrant | BADHDUFLAG | Total packets | Discarded packets |
| A | 0 | 156 | 0 |
| B | 0 | 156 | 0 |
| C | 0 | 156 | 0 |
| D | 0 | 156 | 0 |
| Mode M0 | |||
|---|---|---|---|
| Quadrant | BADHDUFLAG | Total packets | Discarded packets |
| A | 0 | 16196 | 3 |
| B | 0 | 16408 | 2 |
| C | 0 | 15965 | 2 |
| D | 0 | 20181 | 2 |
| Quadrant | Total seconds | Saturated seconds | Saturation percentage |
|---|---|---|---|
| A | 7655 | 56 | 0.731548% |
| B | 7655 | 90 | 1.175702% |
| C | 7655 | 22 | 0.287394% |
| D | 7655 | 253 | 3.305029% |
Noise dominated data is calculated using 1-second bins in cleaned event files. If a bin has >2000 counts, and if more than 50% of those come from <1% of pixels, then it is considered to be noise-dominated and hence unusable.
| Quadrant | # 1 sec bins | Bins with >0 counts | Bins with >2000 counts | High rate bins dominated by noise | Noise dominated (total time) | Noise dominated (detector-on time) | Marked lightcurve |
|---|---|---|---|---|---|---|---|
| A | 8760 | 7657 | 17 | 17 | 0.19% | 0.22% | 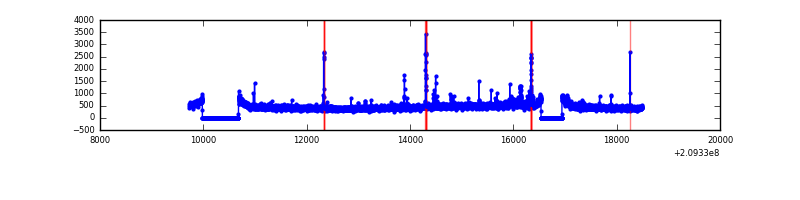 |
| B | 8760 | 7657 | 18 | 18 | 0.21% | 0.24% | 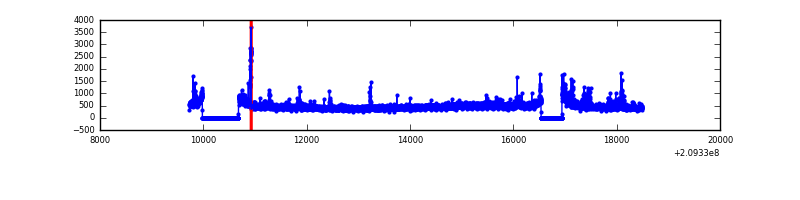 |
| C | 8760 | 7657 | 5 | 5 | 0.06% | 0.07% | 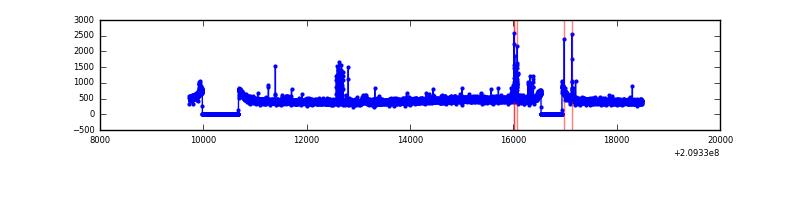 |
| D | 8759 | 7656 | 182 | 182 | 2.08% | 2.38% | 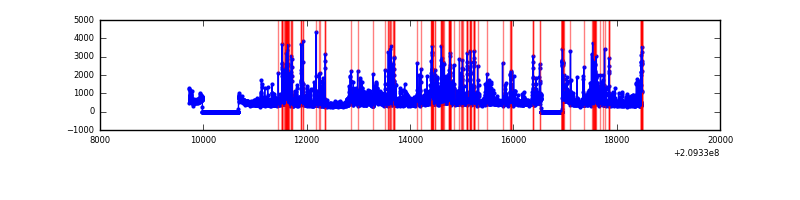 |
Top three noisy pixels from each quadrant. If the there are fewer than three noisy pixels in the level2.evt file, extra rows are filled as -1
| Pixel properties | Quadrant properties | ||||||
|---|---|---|---|---|---|---|---|
| Quadrant | DetID | PixID | Counts | Sigma | Mean | Median | Sigma |
| A | 0 | 50 | 70068 | 379.85 | 882 | 861 | 182.2 |
| A | 8 | 15 | 68453 | 370.99 | 882 | 861 | 182.2 |
| A | 0 | 149 | 22315 | 117.75 | 882 | 861 | 182.2 |
| B | 4 | 80 | 106397 | 611.85 | 891 | 869 | 172.5 |
| B | 15 | 204 | 50174 | 285.87 | 891 | 869 | 172.5 |
| B | 10 | 245 | 48669 | 277.14 | 891 | 869 | 172.5 |
| C | 8 | 208 | 74524 | 369.01 | 855 | 860 | 199.6 |
| C | 5 | 250 | 36105 | 176.56 | 855 | 860 | 199.6 |
| C | 12 | 4 | 17180 | 81.75 | 855 | 860 | 199.6 |
| D | 2 | 234 | 542513 | 2586.94 | 842 | 815 | 209.4 |
| D | 2 | 136 | 357938 | 1705.48 | 842 | 815 | 209.4 |
| D | 13 | 53 | 324215 | 1544.43 | 842 | 815 | 209.4 |
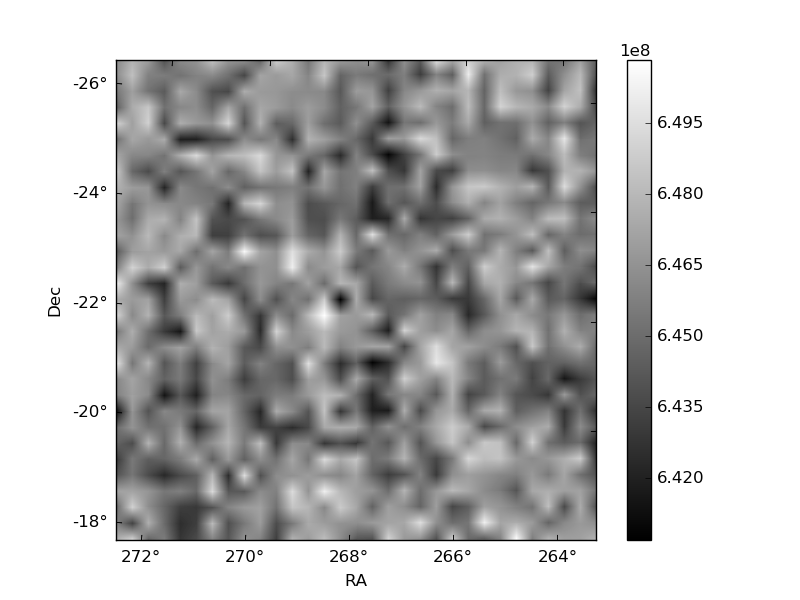
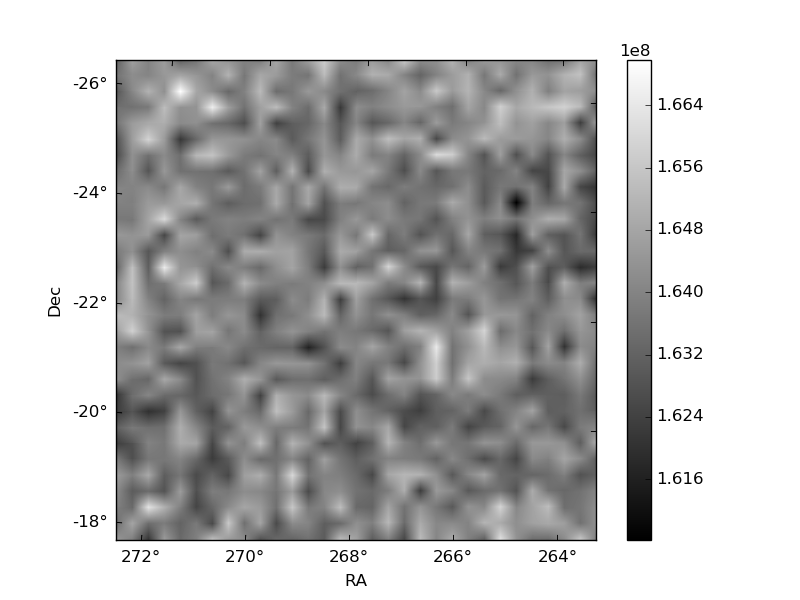
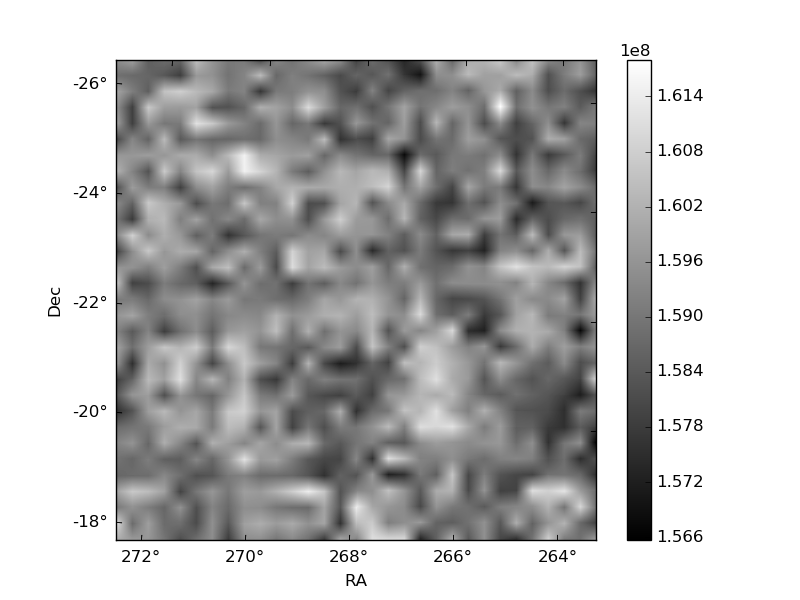
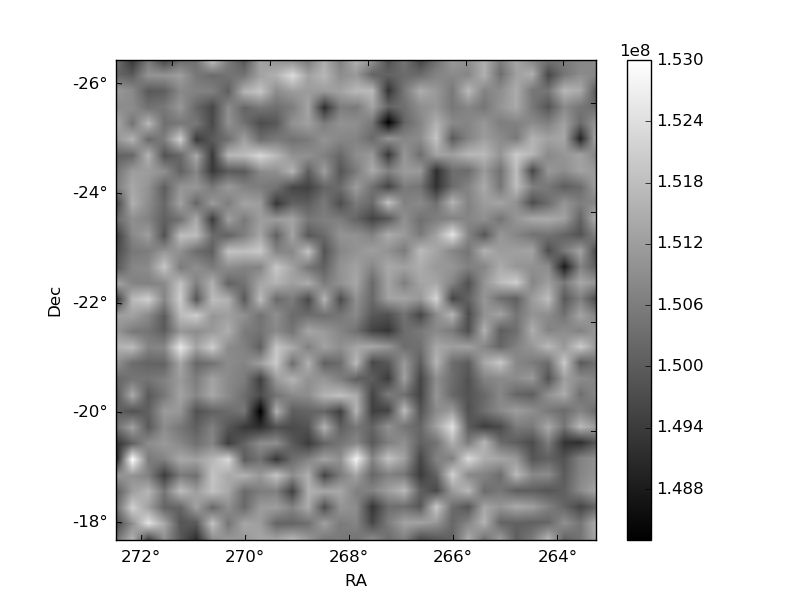
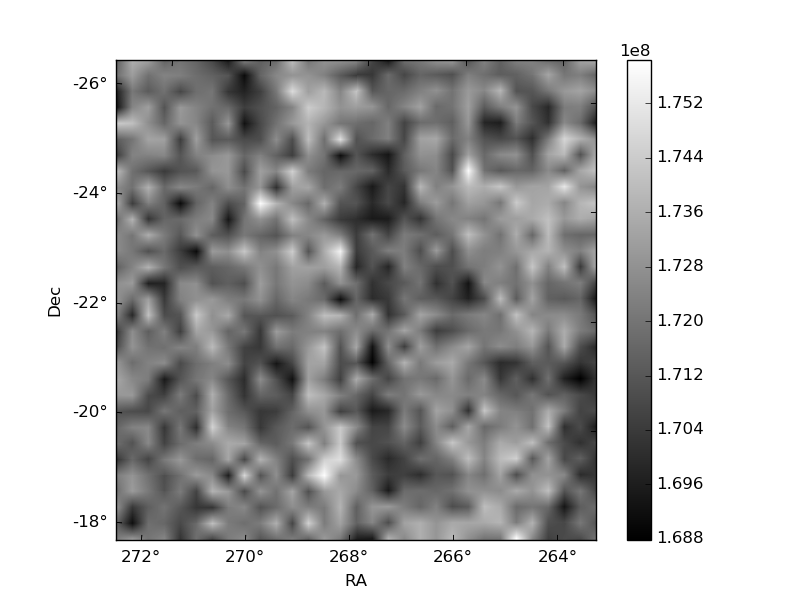
Histogram calculated using DETX and DETY for each event in the final _common_clean file
| Quadrant A | 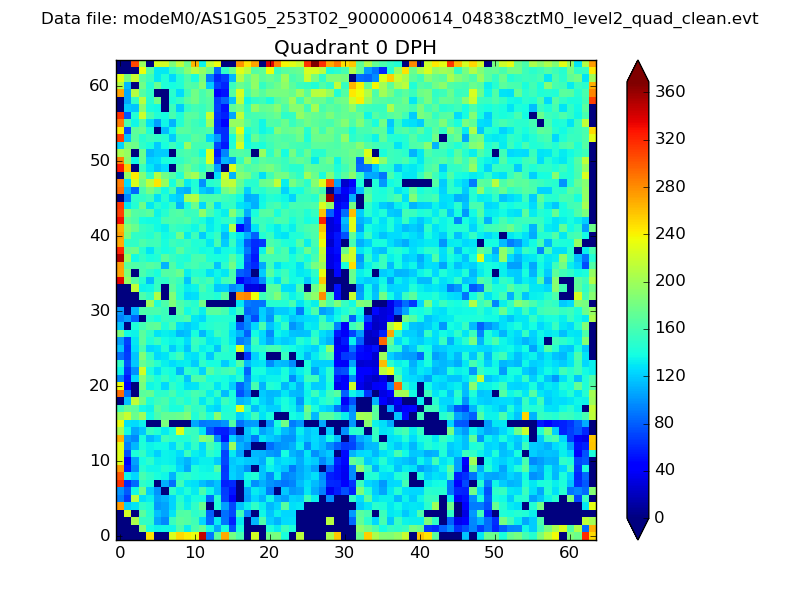 |
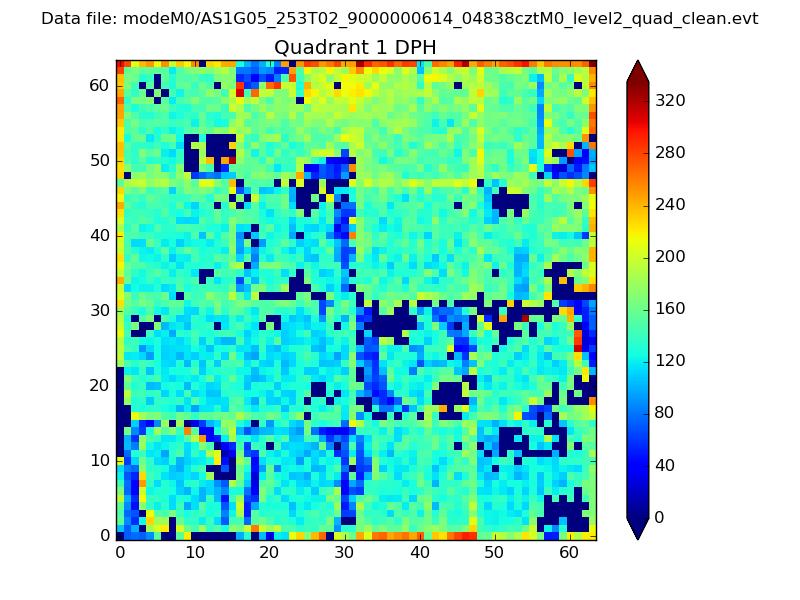 |
Quadrant B |
|---|---|---|---|
| Quadrant D | 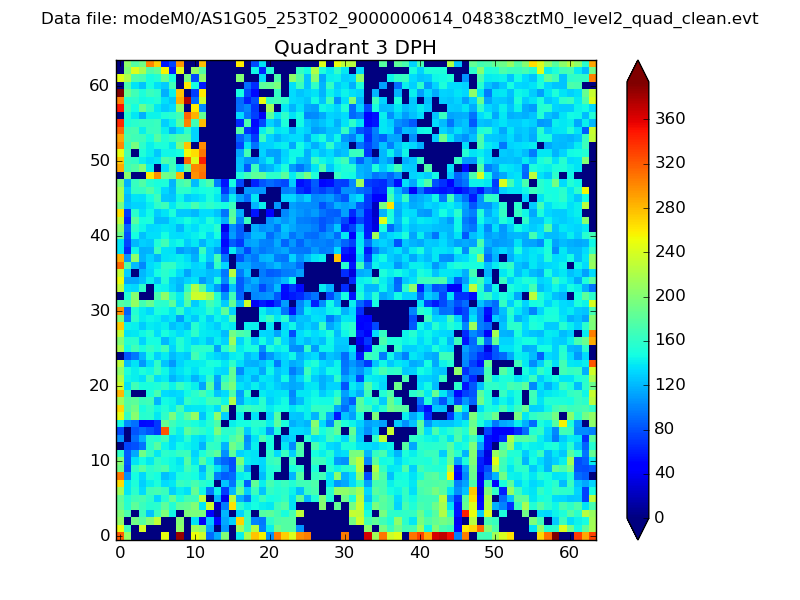 |
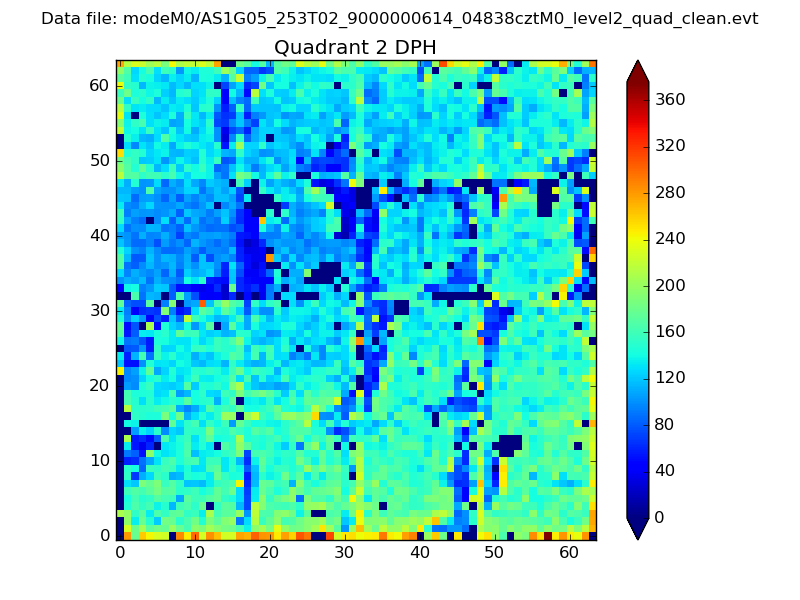 |
Quadrant C |
| Plot type | Count rate plots | Images |
|---|---|---|
| Comparison with Poisson distribution Blue bars denote a histogram of data divided into 1 sec bins. Red curve is a Poisson curve with rate = median count rate of data. |
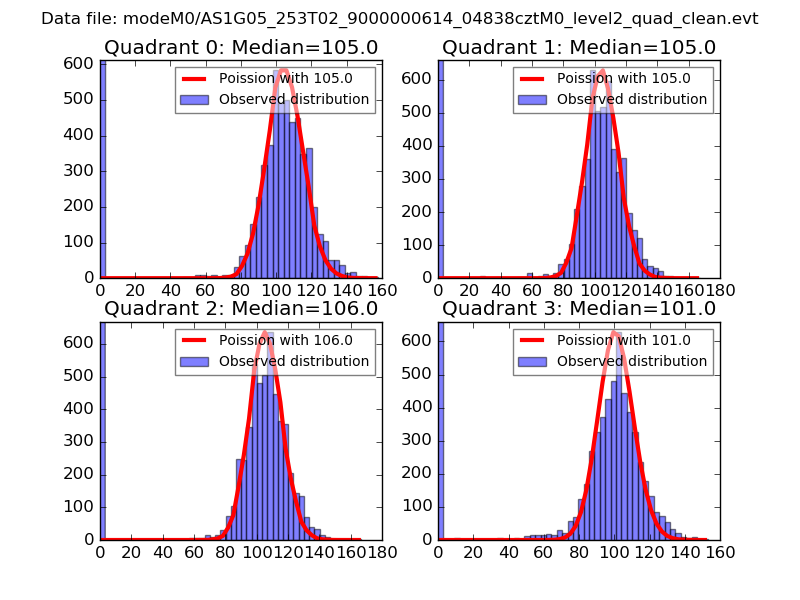 |
 |
| Quadrant-wise count rates Data is divided into 100 sec bins |
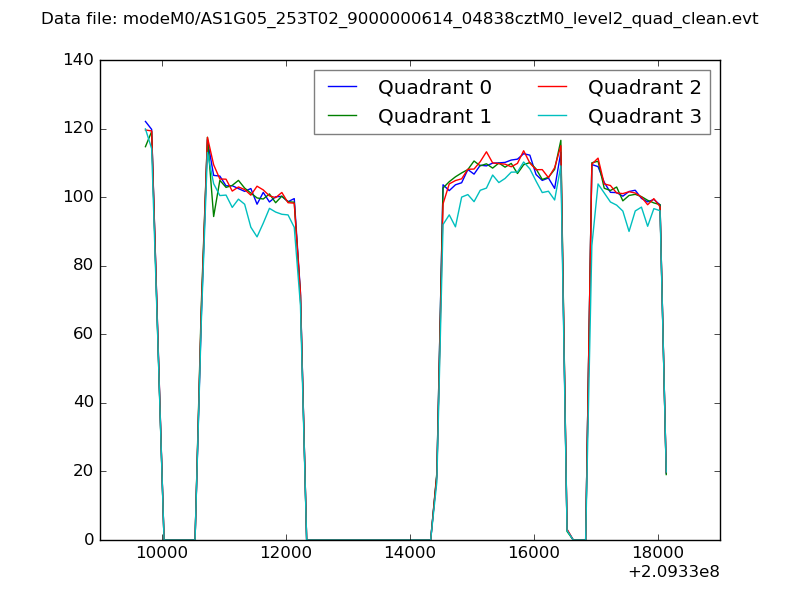 |
|
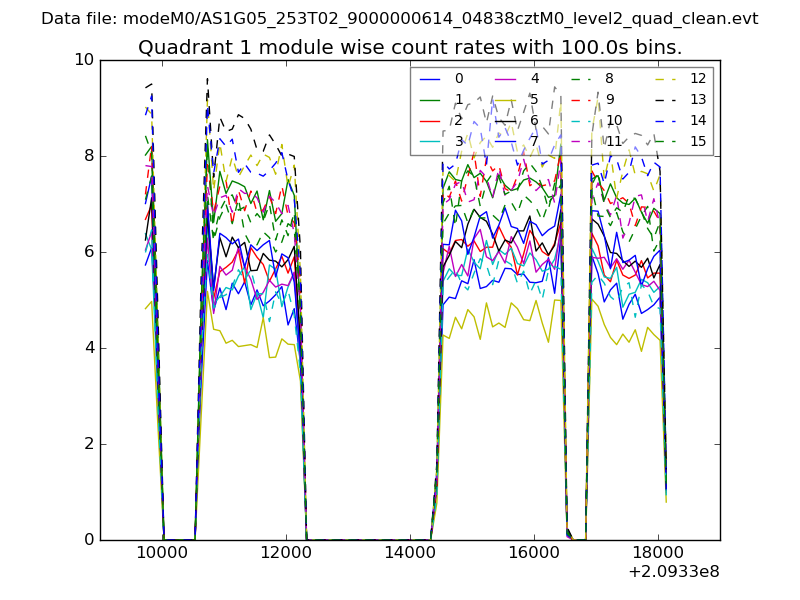
| Module-wise count rates for Quadrant A Data is divided into 100 sec bins |
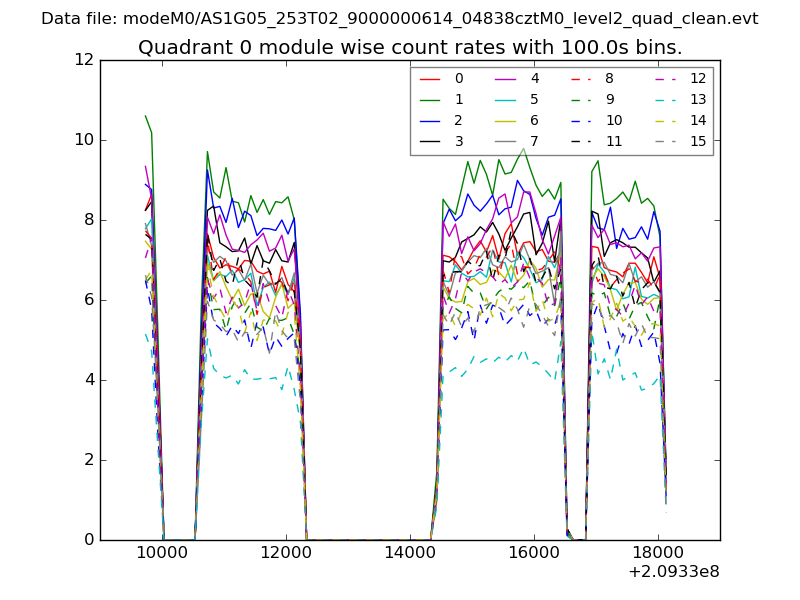 |
 |
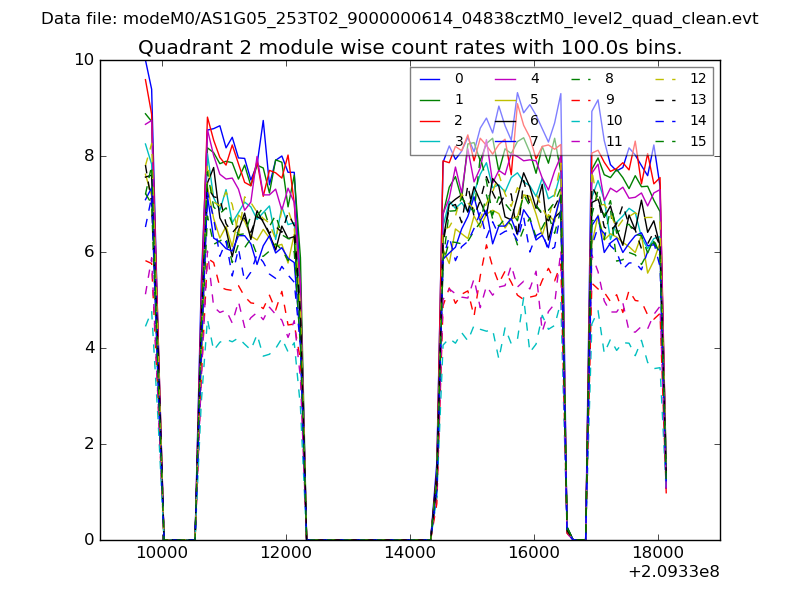
| Module-wise count rates for Quadrant B Data is divided into 100 sec bins |
 |
 |
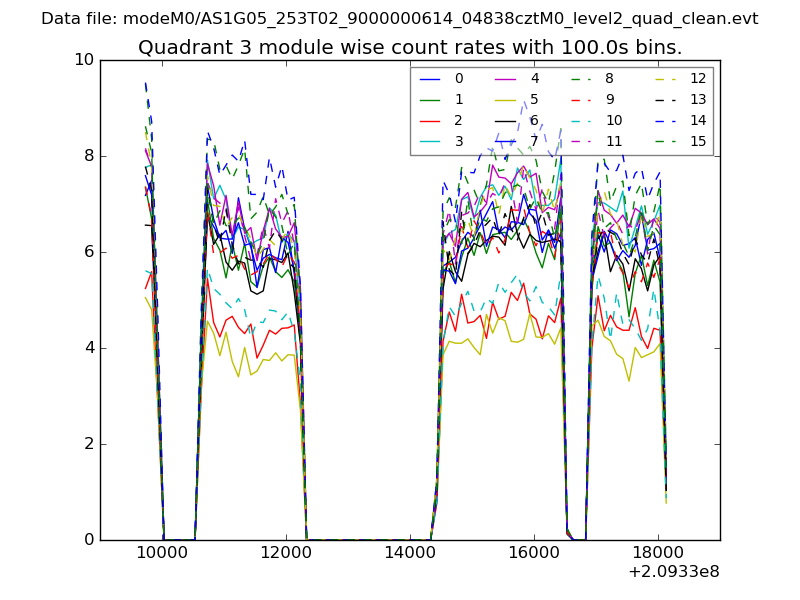
| Module-wise count rates for Quadrant C Data is divided into 100 sec bins |
 |
 |
| Module-wise count rates for Quadrant D Data is divided into 100 sec bins |
 |
 |
| Parameter | Plot |
|---|---|
| CZT HV Monitor | 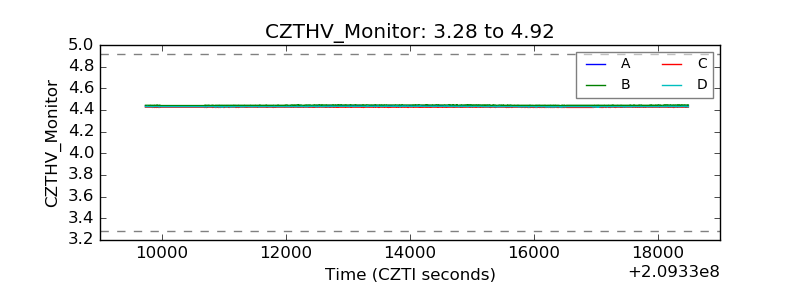 |
| D_VDD | 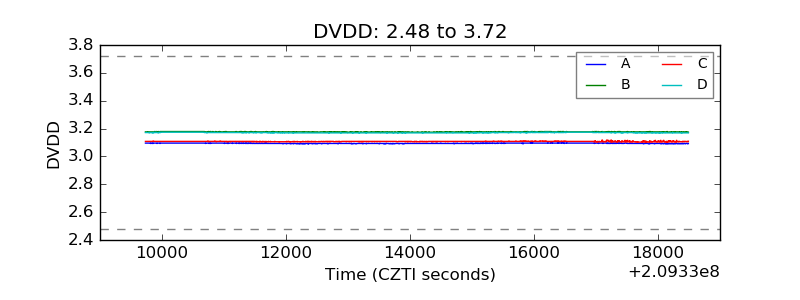 |
| Temperature 1 | 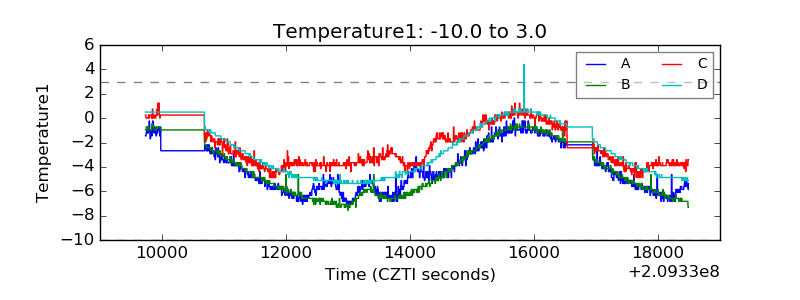 |
| Veto HV Monitor | 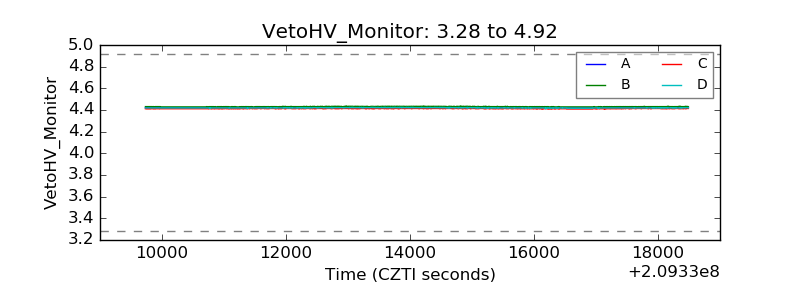 |
| Veto LLD | 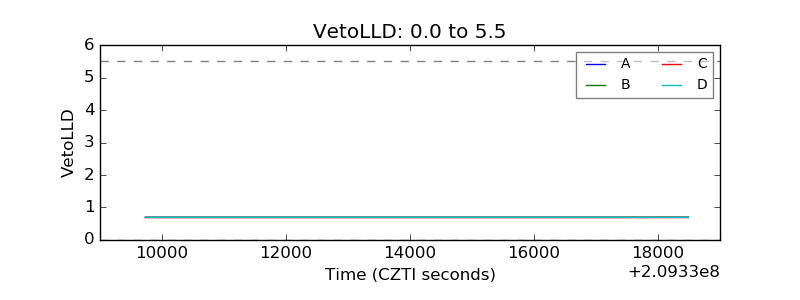 |
| Alpha Counter | 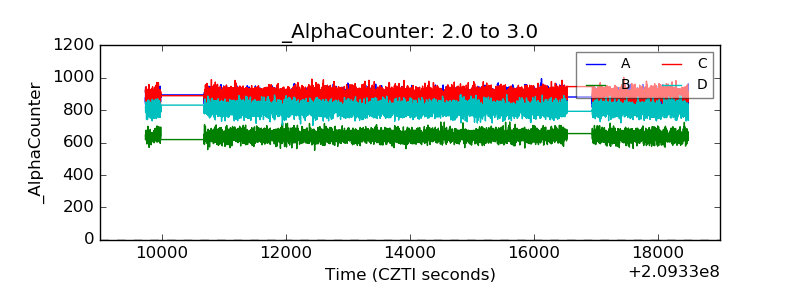 |
| _CPM_Rate | 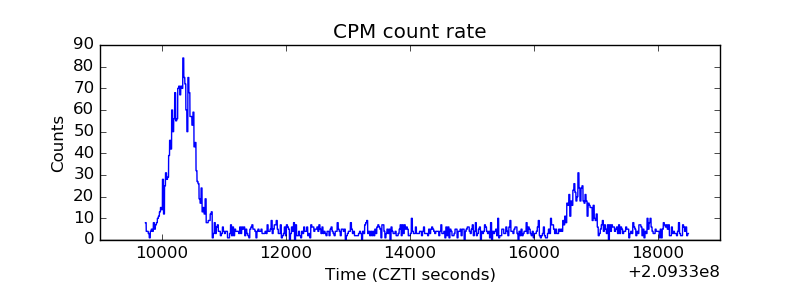 |
| CZT Counter | 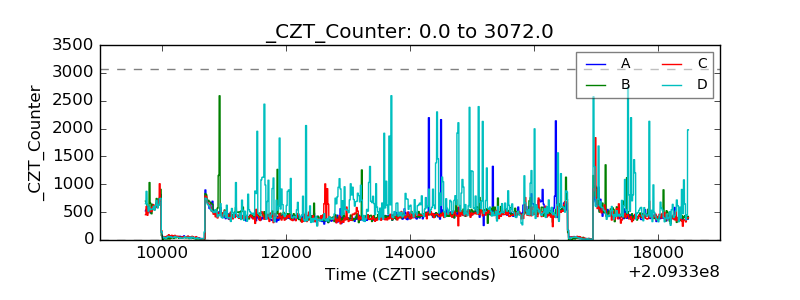 |
| +2.5 Volts monitor |  |
| +5 Volts monitor |  |
| _ROLL_ROT |  |
| _Roll_DEC | 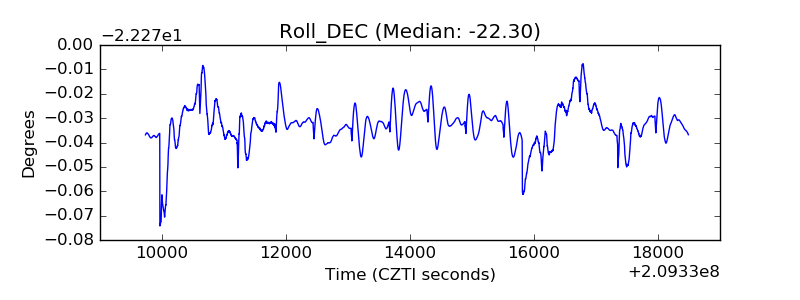 |
| _Roll_RA | 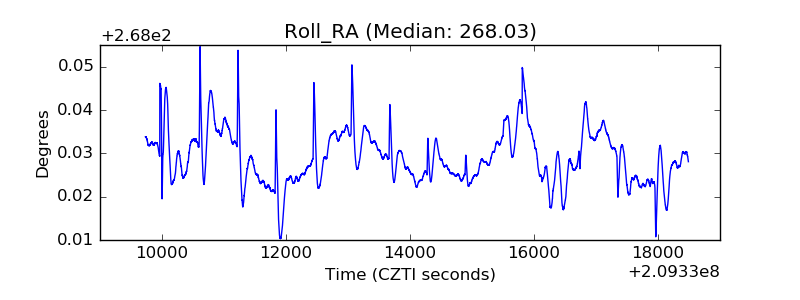 |
| Veto Counter | 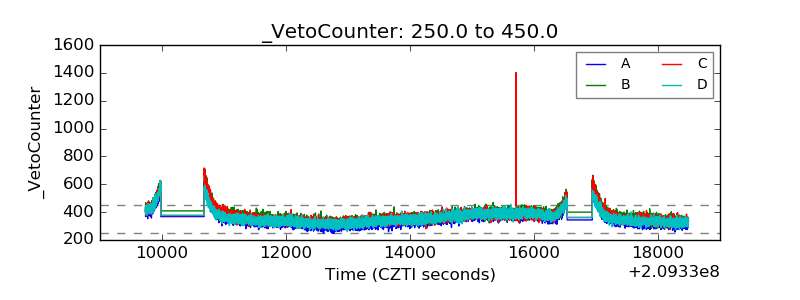 |