| Param | Original file | Final file |
|---|---|---|
| Filename | modeM0/AS1G05_253T02_9000000614_04842cztM0_level2.evt | modeM0/AS1G05_253T02_9000000614_04842cztM0_level2_quad_clean.evt |
| Size (bytes) | 825,549,120 | 106,191,360 |
| Size | 787.3 MB | 101.3 MB |
| Events in quadrant A | 5,831,849 | 614,306 |
| Events in quadrant B | 5,938,121 | 613,370 |
| Events in quadrant C | 5,944,674 | 613,870 |
| Events in quadrant D | 6,468,642 | 539,143 |
| Mode M9 | |||
|---|---|---|---|
| Quadrant | BADHDUFLAG | Total packets | Discarded packets |
| A | 0 | 12 | 1 |
| B | 0 | 12 | 0 |
| C | 0 | 12 | 0 |
| D | 0 | 12 | 0 |
| Mode SS | |||
|---|---|---|---|
| Quadrant | BADHDUFLAG | Total packets | Discarded packets |
| A | 0 | 307 | 61 |
| B | 0 | 307 | 51 |
| C | 0 | 307 | 55 |
| D | 0 | 309 | 53 |
| Mode M0 | |||
|---|---|---|---|
| Quadrant | BADHDUFLAG | Total packets | Discarded packets |
| A | 0 | 32560 | 6493 |
| B | 0 | 33299 | 7426 |
| C | 0 | 33394 | 6967 |
| D | 0 | 35821 | 7778 |
| Quadrant | Total seconds | Saturated seconds | Saturation percentage |
|---|---|---|---|
| A | 12099 | 374 | 3.091165% |
| B | 12024 | 200 | 1.663340% |
| C | 12012 | 109 | 0.907426% |
| D | 12012 | 332 | 2.763903% |
Noise dominated data is calculated using 1-second bins in cleaned event files. If a bin has >2000 counts, and if more than 50% of those come from <1% of pixels, then it is considered to be noise-dominated and hence unusable.
| Quadrant | # 1 sec bins | Bins with >0 counts | Bins with >2000 counts | High rate bins dominated by noise | Noise dominated (total time) | Noise dominated (detector-on time) | Marked lightcurve |
|---|---|---|---|---|---|---|---|
| A | 16518 | 12868 | 51 | 51 | 0.31% | 0.40% | 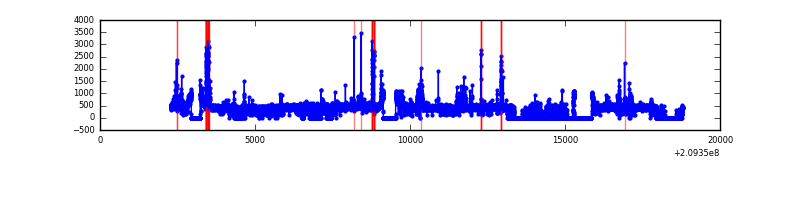 |
| B | 16518 | 12759 | 9 | 9 | 0.05% | 0.07% | 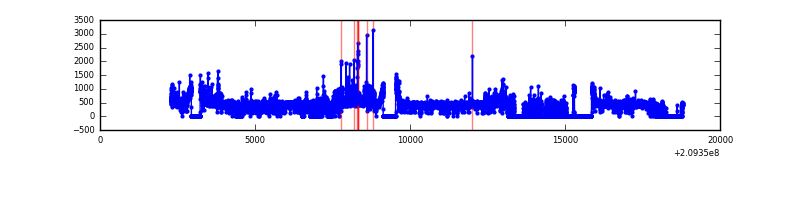 |
| C | 16518 | 12763 | 1 | 1 | 0.01% | 0.01% | 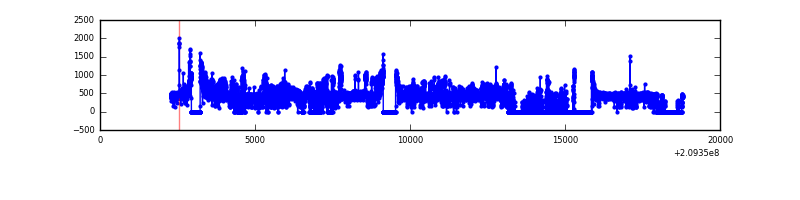 |
| D | 16518 | 12770 | 161 | 161 | 0.97% | 1.26% | 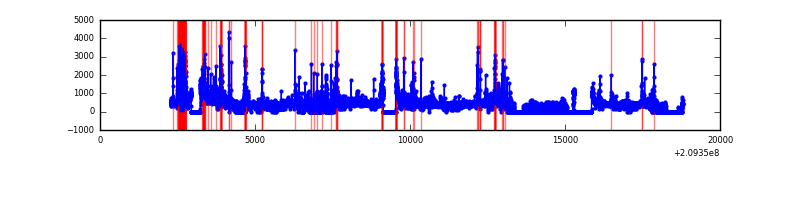 |
Top three noisy pixels from each quadrant. If the there are fewer than three noisy pixels in the level2.evt file, extra rows are filled as -1
| Pixel properties | Quadrant properties | ||||||
|---|---|---|---|---|---|---|---|
| Quadrant | DetID | PixID | Counts | Sigma | Mean | Median | Sigma |
| A | 13 | 251 | 253720 | 891.24 | 1376 | 1341 | 283.2 |
| A | 14 | 111 | 152508 | 533.82 | 1376 | 1341 | 283.2 |
| A | 0 | 50 | 101892 | 355.08 | 1376 | 1341 | 283.2 |
| B | 4 | 80 | 220097 | 810.24 | 1401 | 1367 | 270.0 |
| B | 8 | 3 | 105328 | 385.1 | 1401 | 1367 | 270.0 |
| B | 4 | 239 | 48795 | 175.69 | 1401 | 1367 | 270.0 |
| C | 8 | 208 | 630595 | 1991.39 | 1343 | 1345 | 316.0 |
| C | 8 | 128 | 22084 | 65.63 | 1343 | 1345 | 316.0 |
| C | 1 | 16 | 18494 | 54.27 | 1343 | 1345 | 316.0 |
| D | 13 | 235 | 447801 | 1370.12 | 1324 | 1283 | 325.9 |
| D | 2 | 234 | 224248 | 684.16 | 1324 | 1283 | 325.9 |
| D | 2 | 136 | 214619 | 654.61 | 1324 | 1283 | 325.9 |
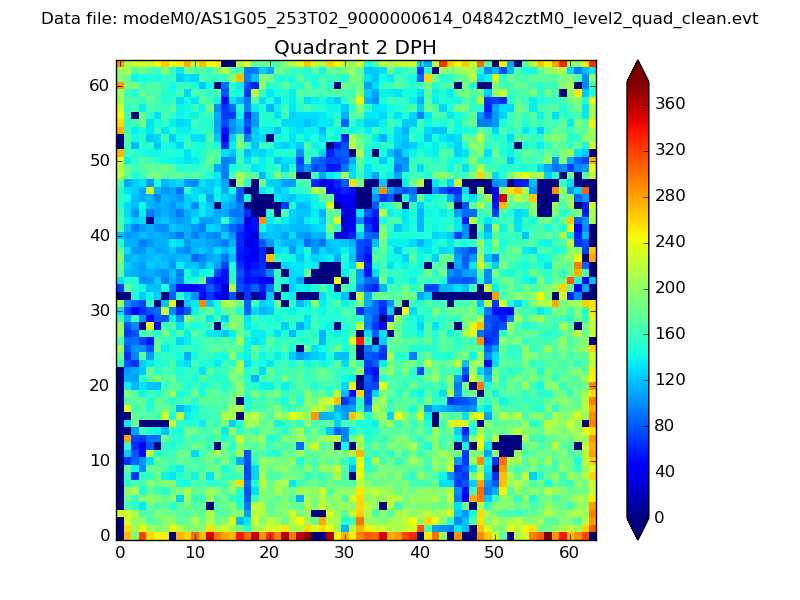
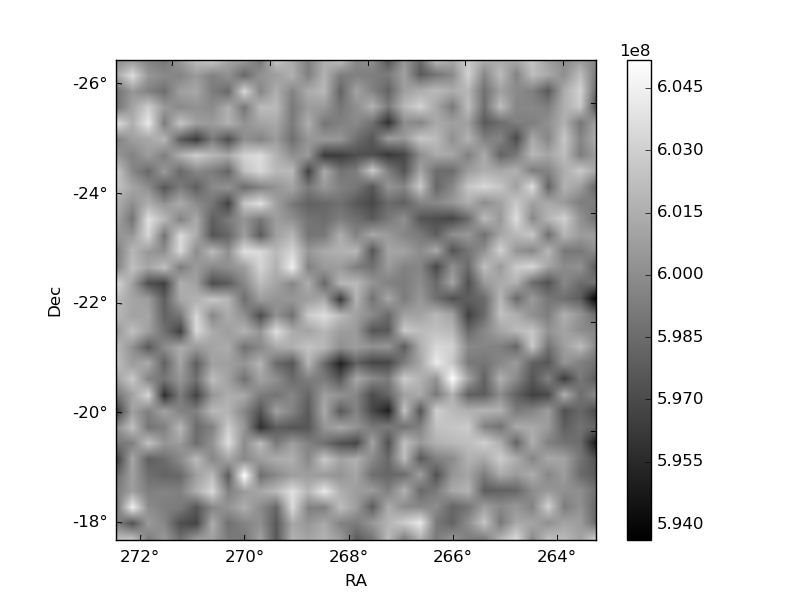
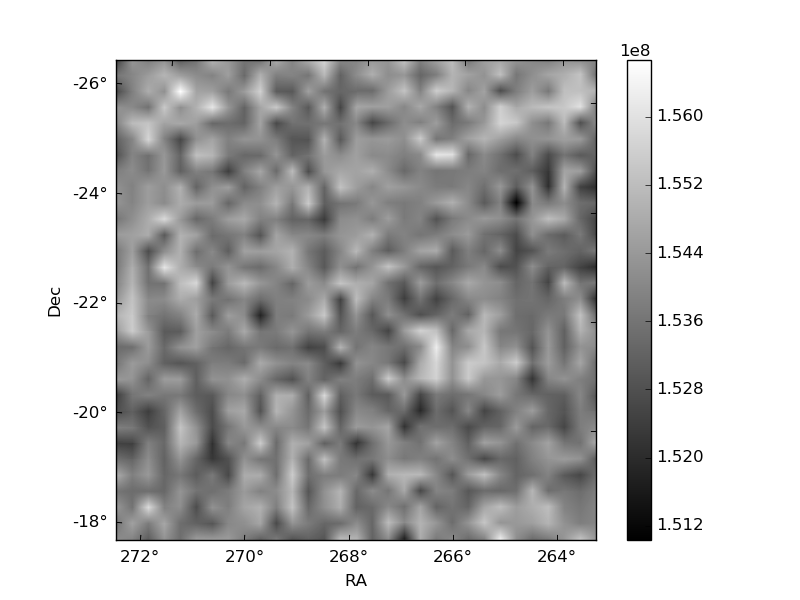
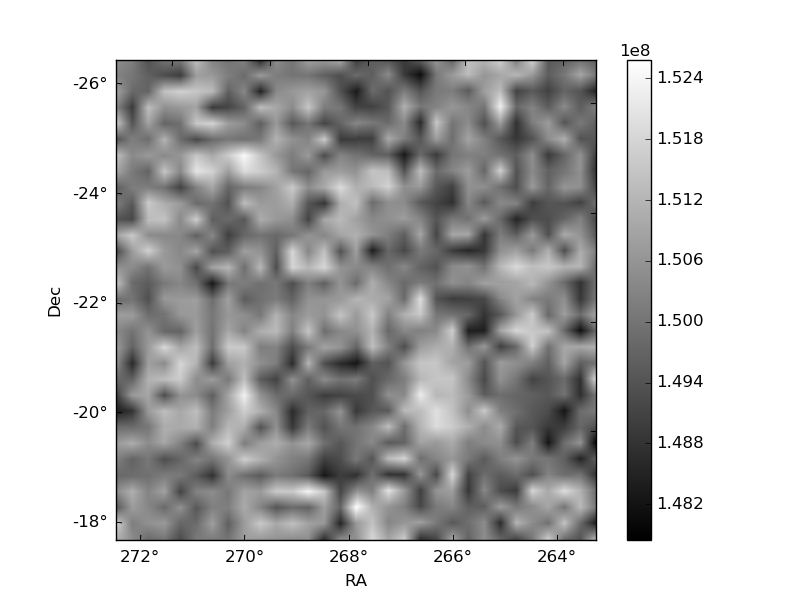
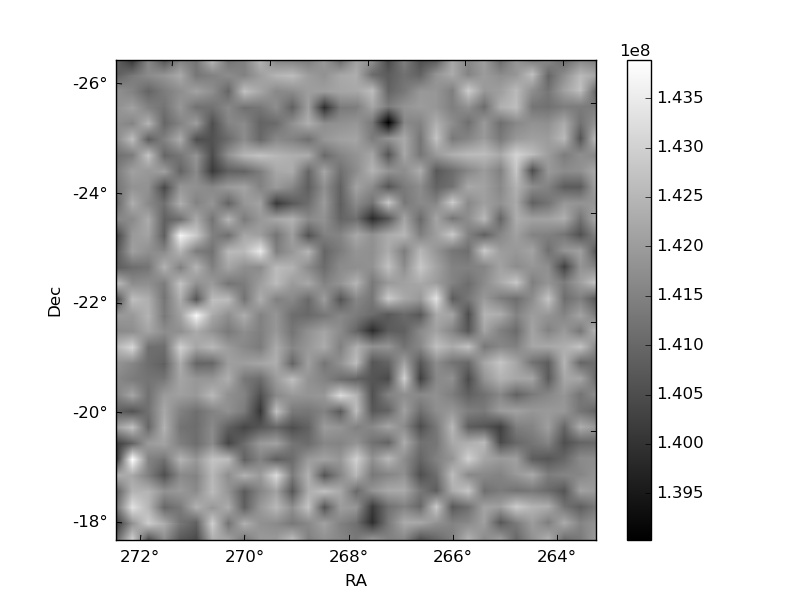
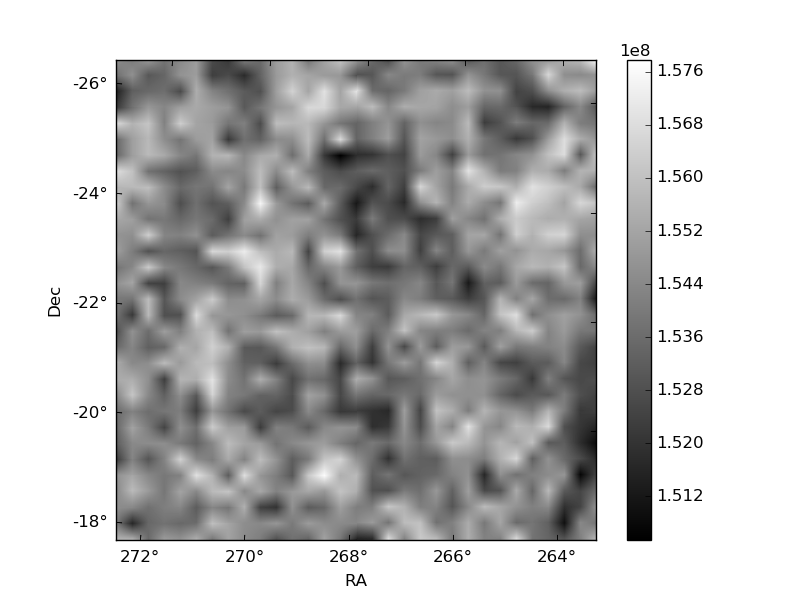
Histogram calculated using DETX and DETY for each event in the final _common_clean file
| Quadrant A | 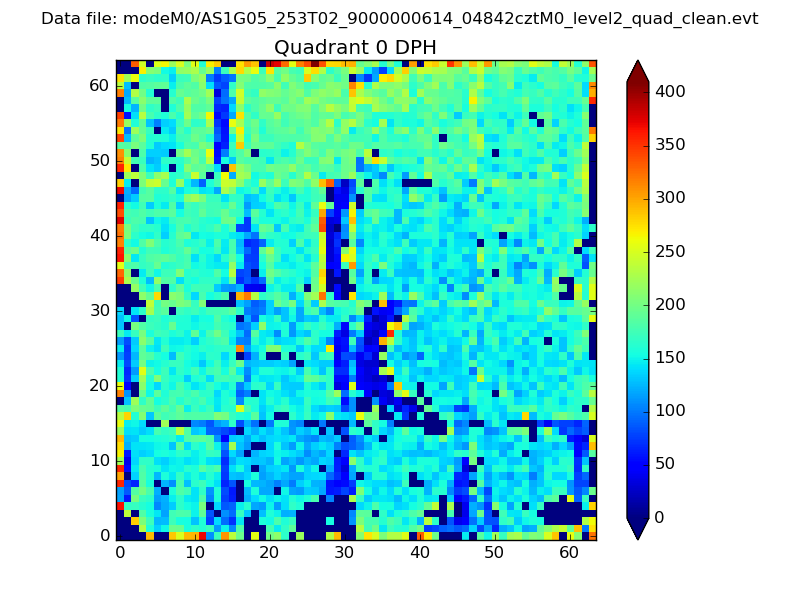 |
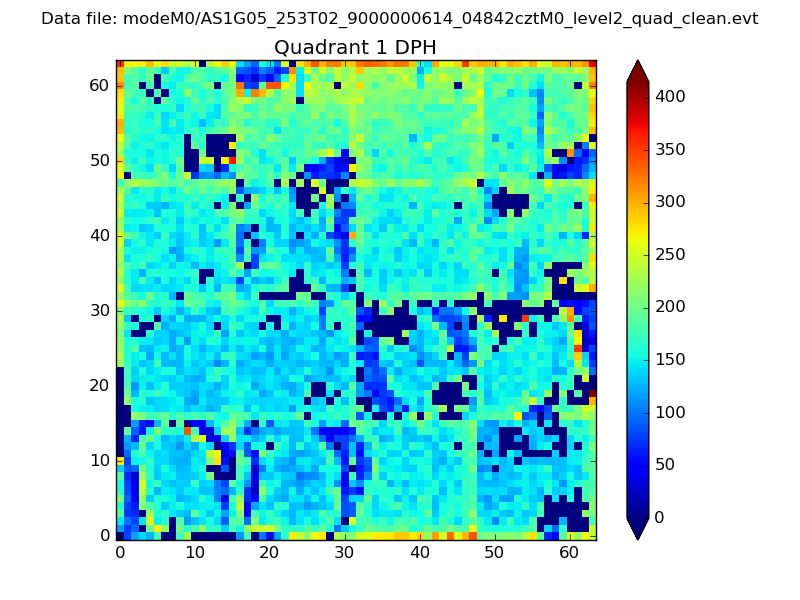 |
Quadrant B |
|---|---|---|---|
| Quadrant D | 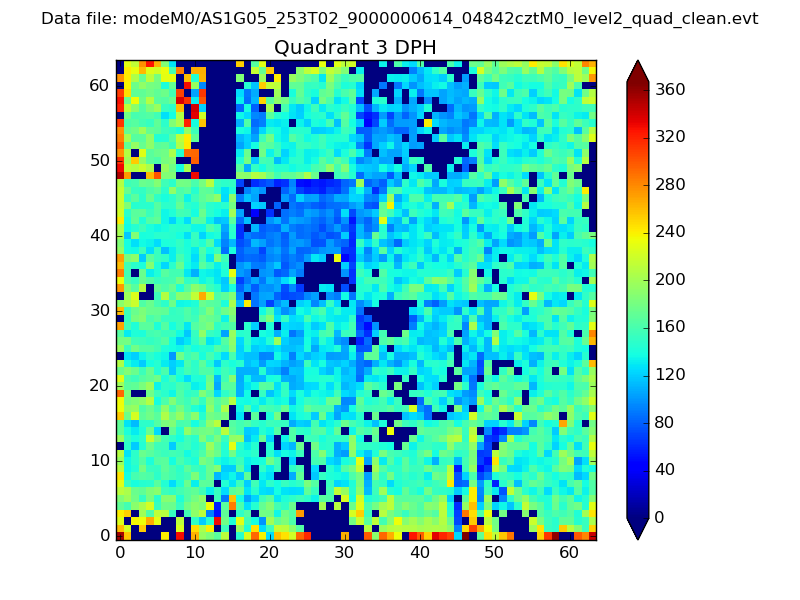 |
 |
Quadrant C |
| Plot type | Count rate plots | Images |
|---|---|---|
| Comparison with Poisson distribution Blue bars denote a histogram of data divided into 1 sec bins. Red curve is a Poisson curve with rate = median count rate of data. |
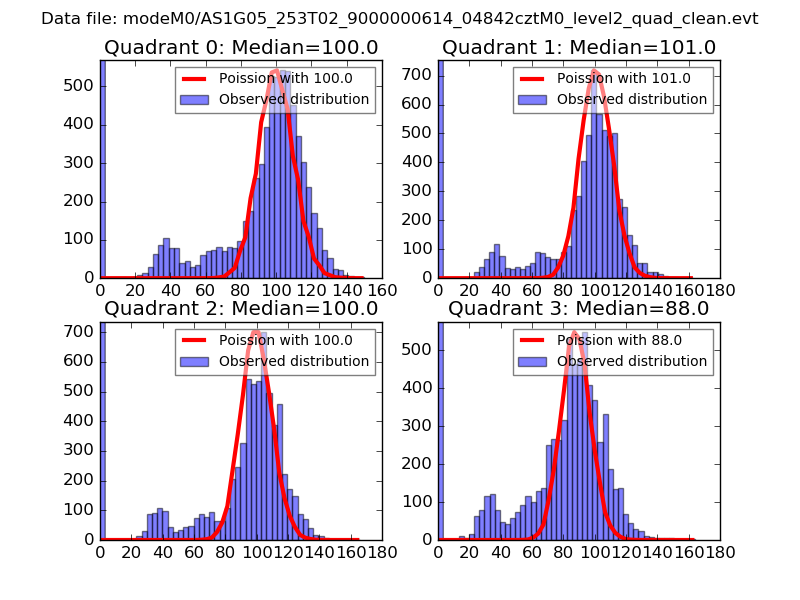 |
 |
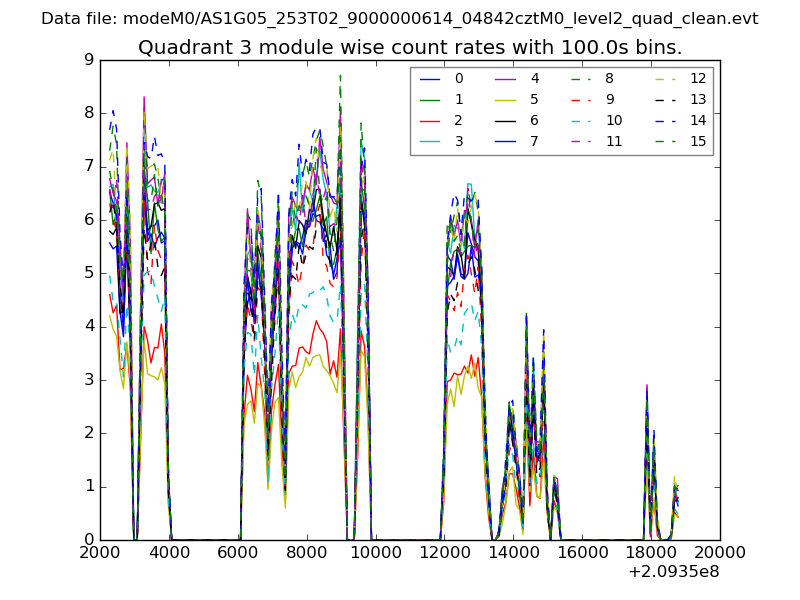
| Quadrant-wise count rates Data is divided into 100 sec bins |
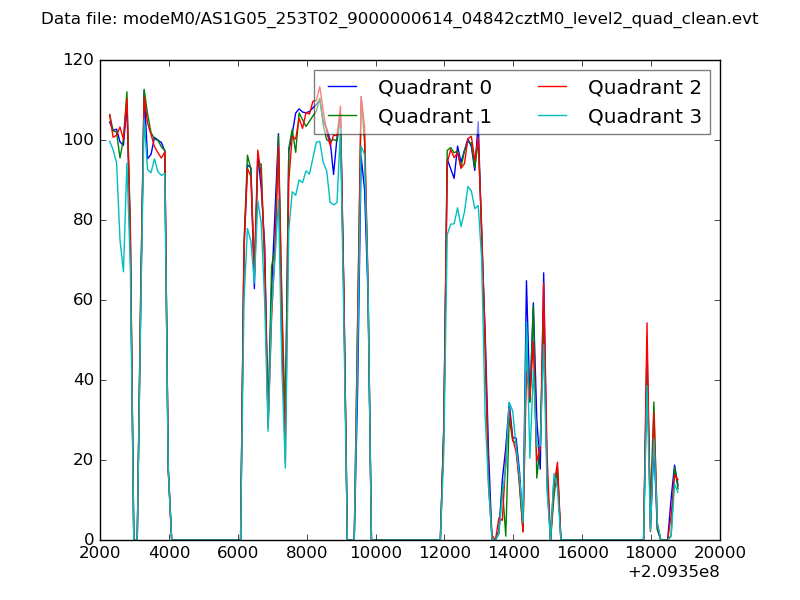 |
|
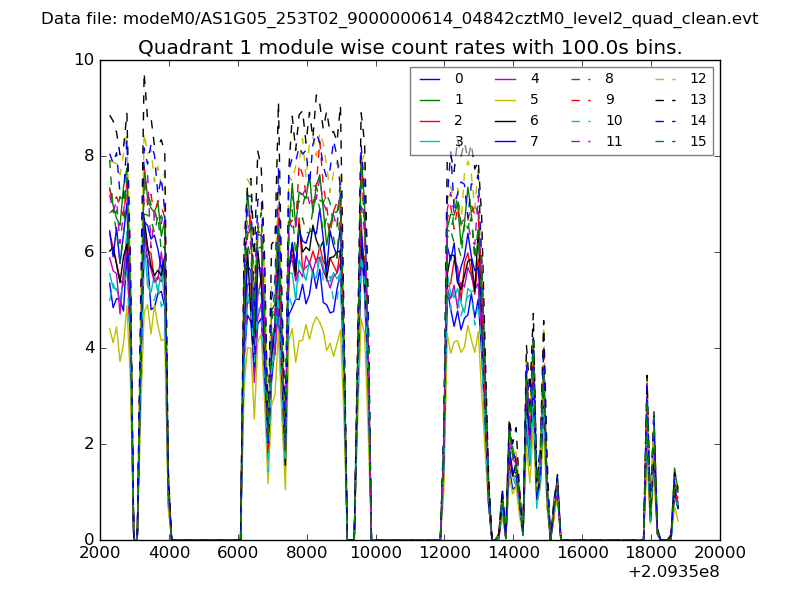
| Module-wise count rates for Quadrant A Data is divided into 100 sec bins |
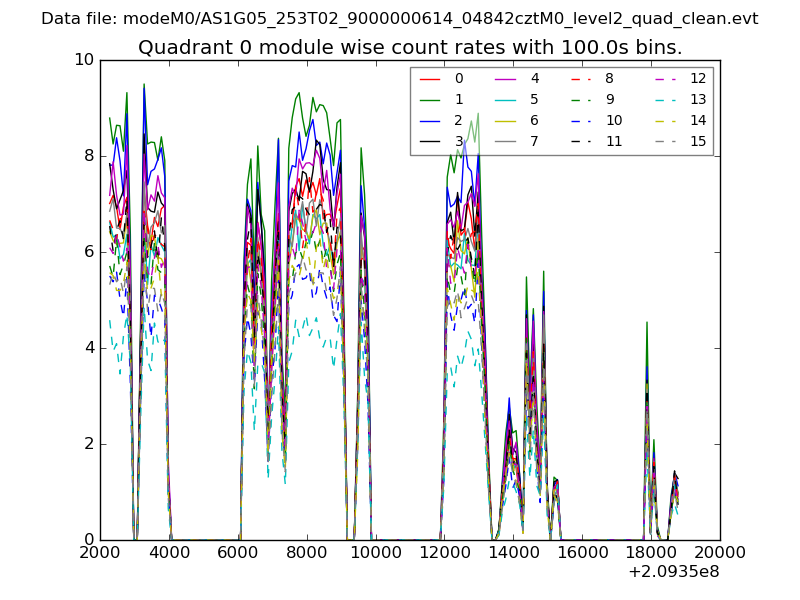 |
 |
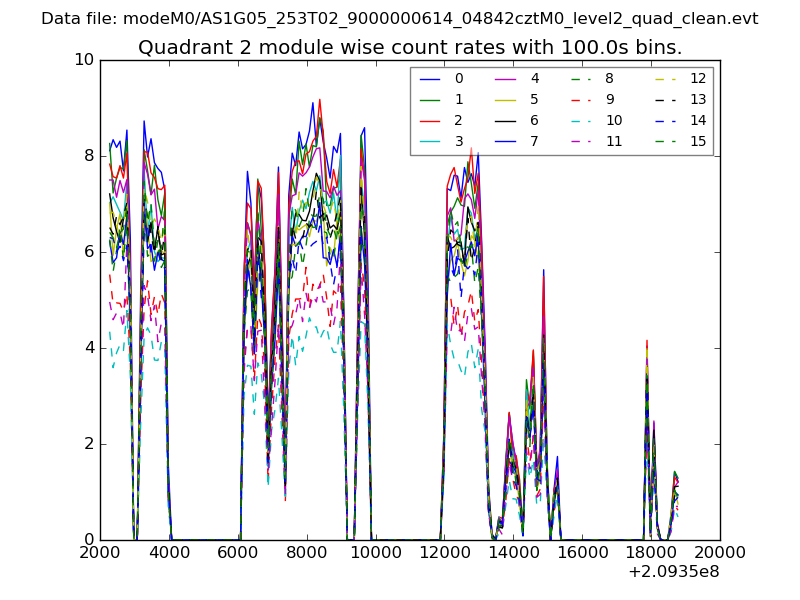
| Module-wise count rates for Quadrant B Data is divided into 100 sec bins |
 |
 |
| Module-wise count rates for Quadrant C Data is divided into 100 sec bins |
 |
 |
| Module-wise count rates for Quadrant D Data is divided into 100 sec bins |
 |
 |
| Parameter | Plot |
|---|---|
| CZT HV Monitor | 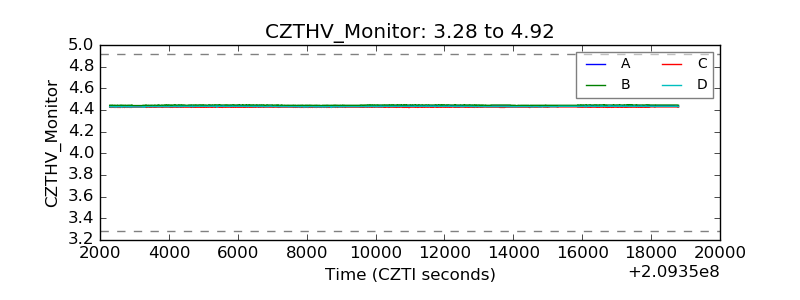 |
| D_VDD | 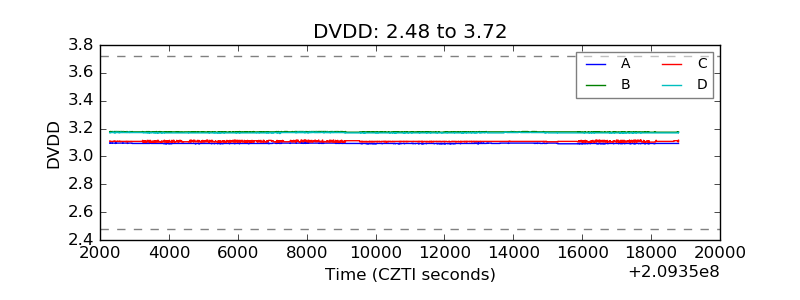 |
| Temperature 1 | 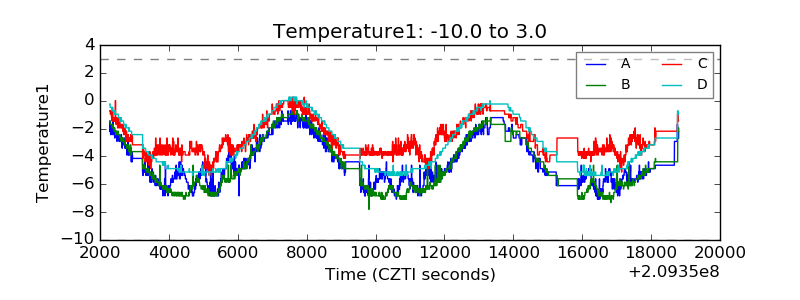 |
| Veto HV Monitor | 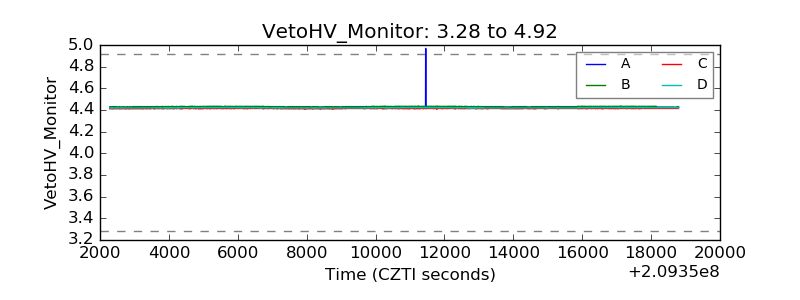 |
| Veto LLD | 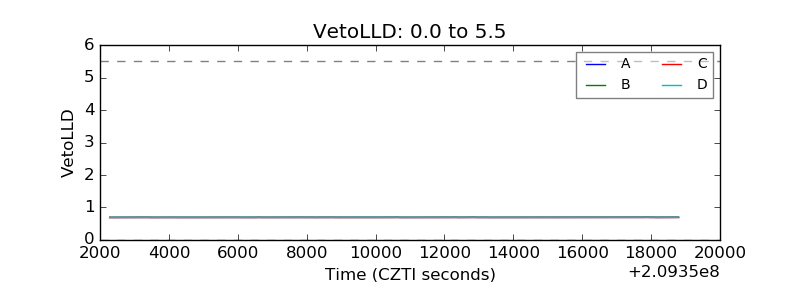 |
| Alpha Counter | 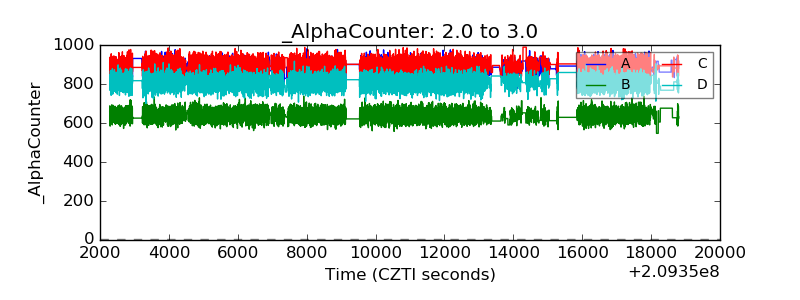 |
| _CPM_Rate | 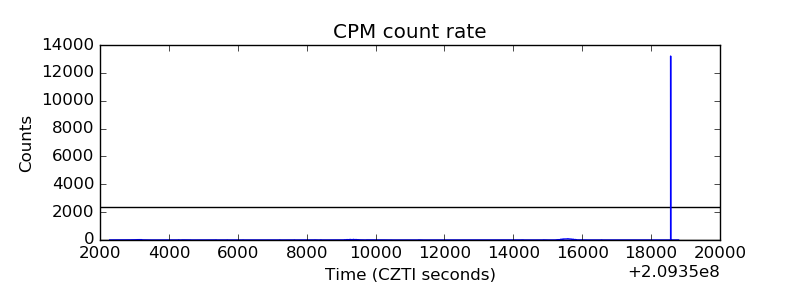 |
| CZT Counter | 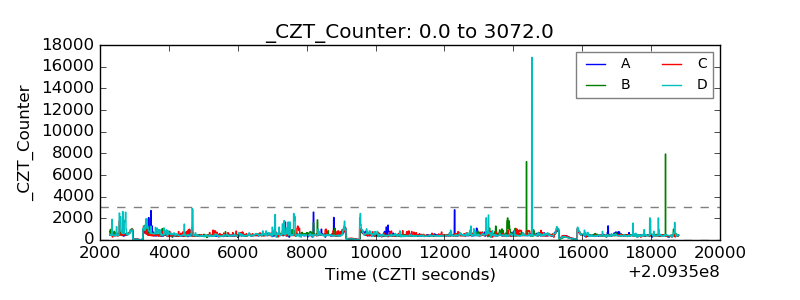 |
| +2.5 Volts monitor |  |
| +5 Volts monitor |  |
| _ROLL_ROT | 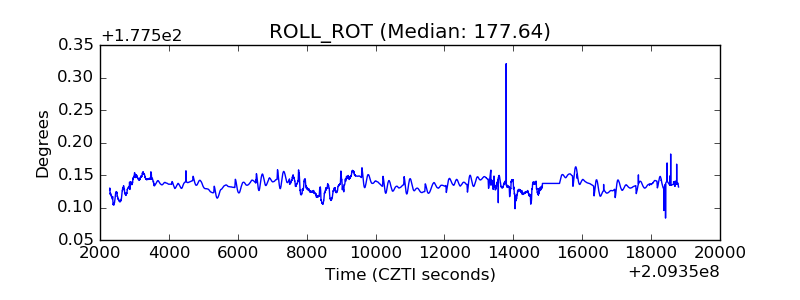 |
| _Roll_DEC | 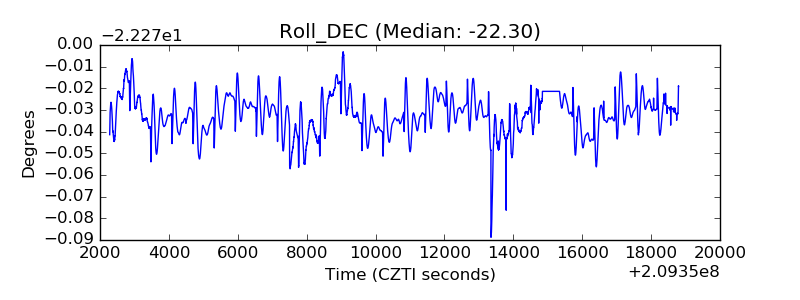 |
| _Roll_RA | 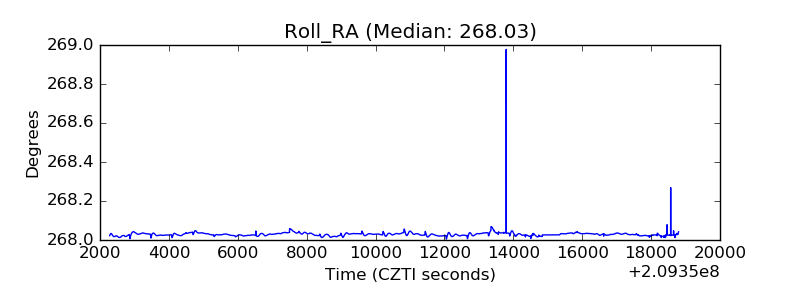 |
| Veto Counter | 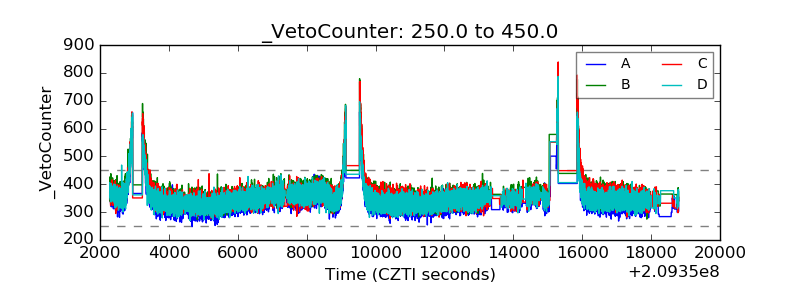 |