| Param | Original file | Final file |
|---|---|---|
| Filename | modeM0/AS1G05_253T02_9000000614_04844cztM0_level2.evt | modeM0/AS1G05_253T02_9000000614_04844cztM0_level2_quad_clean.evt |
| Size (bytes) | 469,825,920 | 73,782,720 |
| Size | 448.1 MB | 70.4 MB |
| Events in quadrant A | 3,272,309 | 445,721 |
| Events in quadrant B | 3,274,660 | 447,458 |
| Events in quadrant C | 3,229,037 | 450,228 |
| Events in quadrant D | 4,000,887 | 427,086 |
| Mode M9 | |||
|---|---|---|---|
| Quadrant | BADHDUFLAG | Total packets | Discarded packets |
| A | 0 | 19 | 0 |
| B | 0 | 19 | 0 |
| C | 0 | 19 | 0 |
| D | 0 | 19 | 0 |
| Mode SS | |||
|---|---|---|---|
| Quadrant | BADHDUFLAG | Total packets | Discarded packets |
| A | 0 | 138 | 0 |
| B | 0 | 138 | 0 |
| C | 0 | 138 | 0 |
| D | 0 | 138 | 0 |
| Mode M0 | |||
|---|---|---|---|
| Quadrant | BADHDUFLAG | Total packets | Discarded packets |
| A | 0 | 14215 | 22 |
| B | 0 | 14009 | 12 |
| C | 0 | 14101 | 10 |
| D | 0 | 16481 | 18 |
| Quadrant | Total seconds | Saturated seconds | Saturation percentage |
|---|---|---|---|
| A | 6645 | 108 | 1.625282% |
| B | 6646 | 92 | 1.384291% |
| C | 6647 | 72 | 1.083195% |
| D | 6644 | 276 | 4.154124% |
Noise dominated data is calculated using 1-second bins in cleaned event files. If a bin has >2000 counts, and if more than 50% of those come from <1% of pixels, then it is considered to be noise-dominated and hence unusable.
| Quadrant | # 1 sec bins | Bins with >0 counts | Bins with >2000 counts | High rate bins dominated by noise | Noise dominated (total time) | Noise dominated (detector-on time) | Marked lightcurve |
|---|---|---|---|---|---|---|---|
| A | 8581 | 6651 | 11 | 11 | 0.13% | 0.17% | 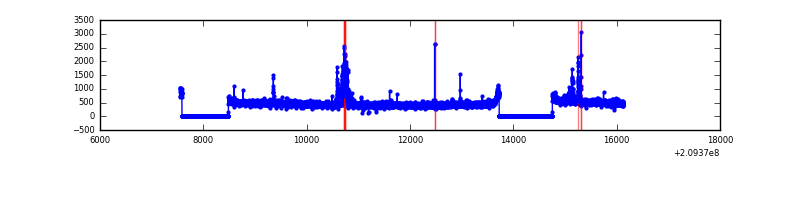 |
| B | 8581 | 6651 | 8 | 8 | 0.09% | 0.12% | 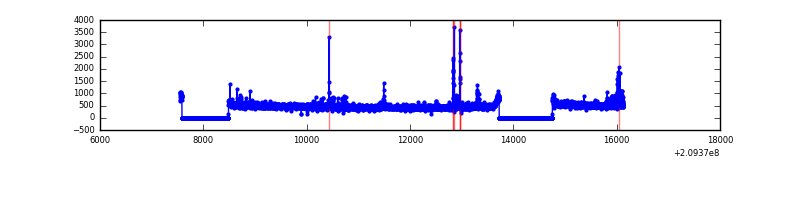 |
| C | 8581 | 6652 | 5 | 5 | 0.06% | 0.08% | 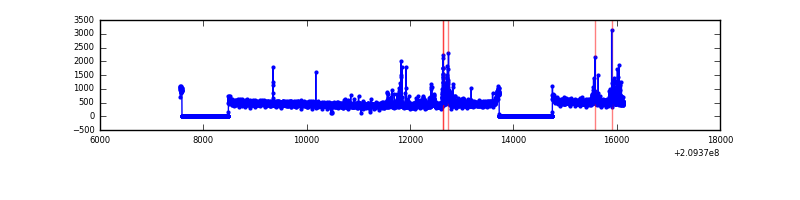 |
| D | 8581 | 6651 | 139 | 139 | 1.62% | 2.09% | 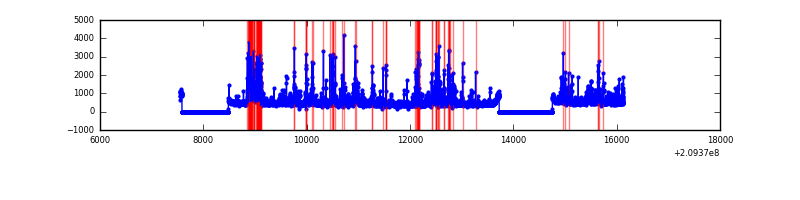 |
Top three noisy pixels from each quadrant. If the there are fewer than three noisy pixels in the level2.evt file, extra rows are filled as -1
| Pixel properties | Quadrant properties | ||||||
|---|---|---|---|---|---|---|---|
| Quadrant | DetID | PixID | Counts | Sigma | Mean | Median | Sigma |
| A | 0 | 149 | 128626 | 780.14 | 793 | 775 | 163.9 |
| A | 0 | 50 | 59687 | 359.48 | 793 | 775 | 163.9 |
| A | 0 | 226 | 19150 | 112.12 | 793 | 775 | 163.9 |
| B | 10 | 246 | 64415 | 415.75 | 797 | 780 | 153.1 |
| B | 15 | 54 | 29118 | 185.14 | 797 | 780 | 153.1 |
| B | 10 | 16 | 26612 | 168.77 | 797 | 780 | 153.1 |
| C | 12 | 4 | 132804 | 732.68 | 769 | 774 | 180.2 |
| C | 9 | 247 | 91279 | 502.24 | 769 | 774 | 180.2 |
| C | 13 | 61 | 6096 | 29.53 | 769 | 774 | 180.2 |
| D | 13 | 235 | 496714 | 2648.09 | 761 | 737 | 187.3 |
| D | 2 | 136 | 202718 | 1078.41 | 761 | 737 | 187.3 |
| D | 13 | 239 | 112954 | 599.14 | 761 | 737 | 187.3 |
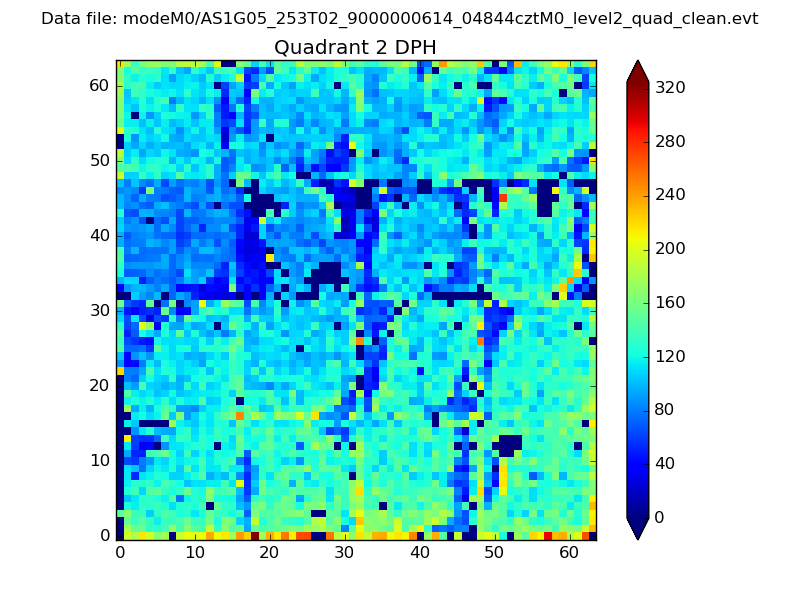
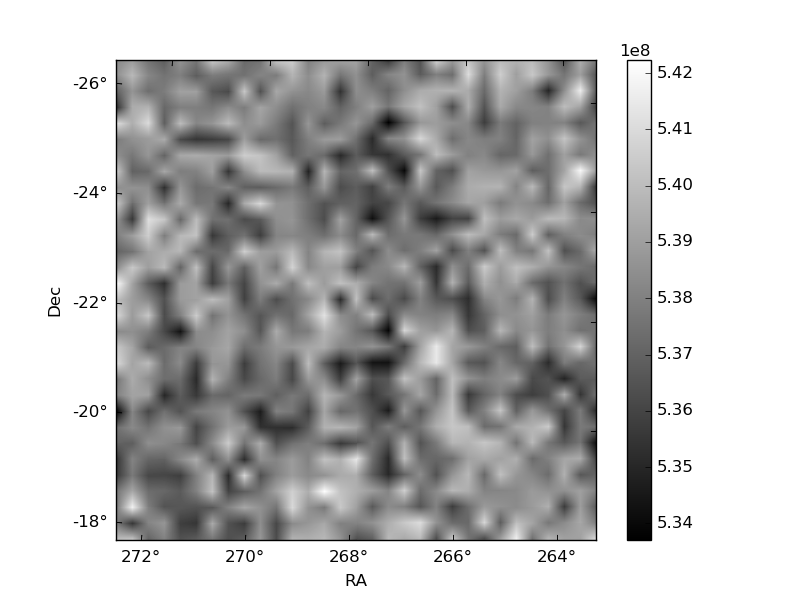
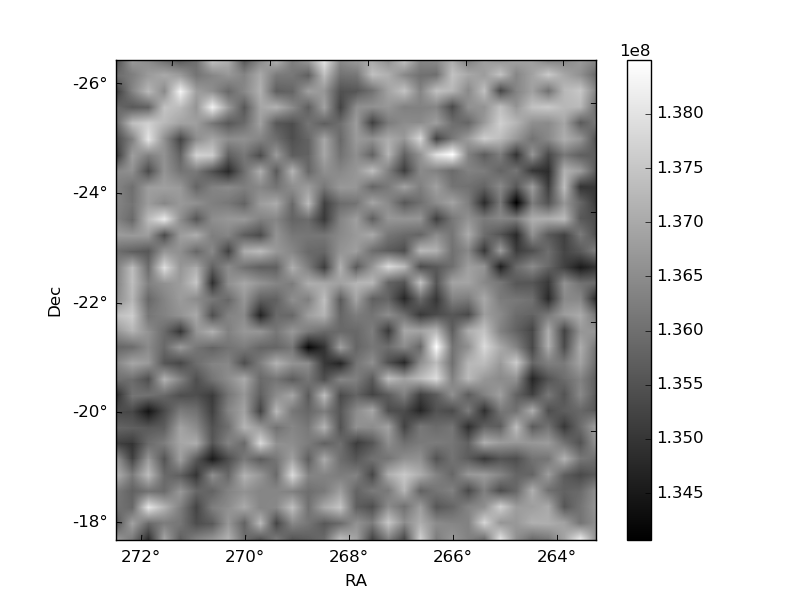
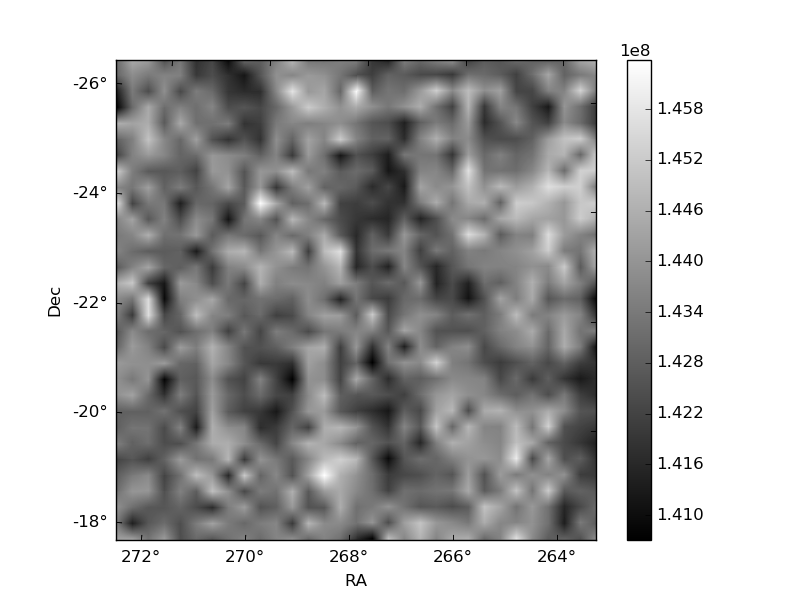
Histogram calculated using DETX and DETY for each event in the final _common_clean file
| Quadrant A | 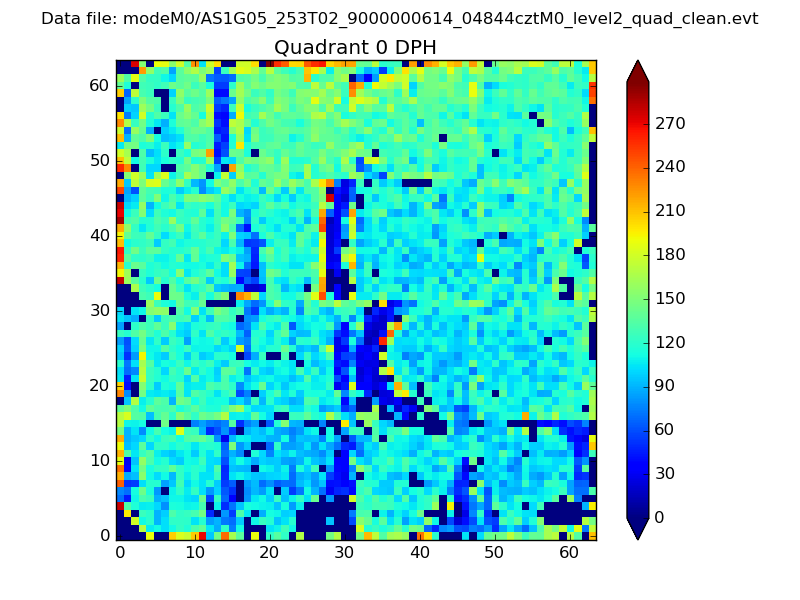 |
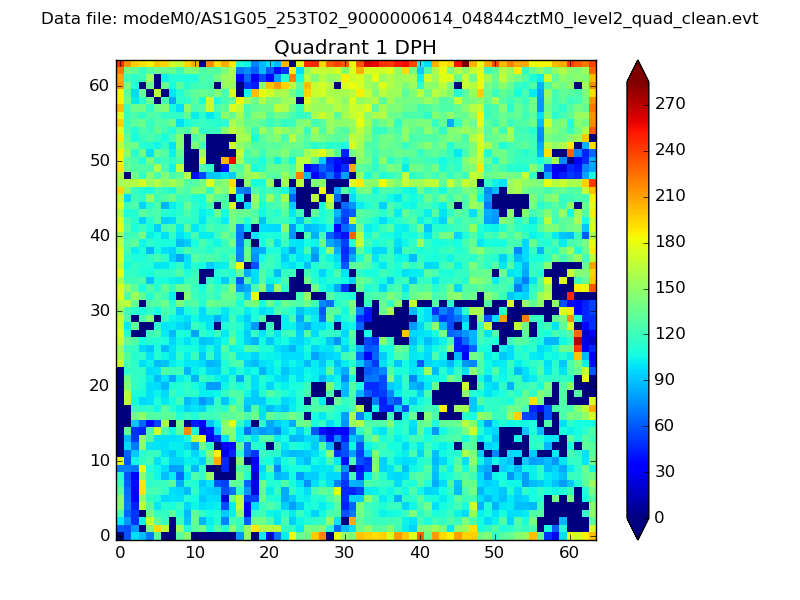 |
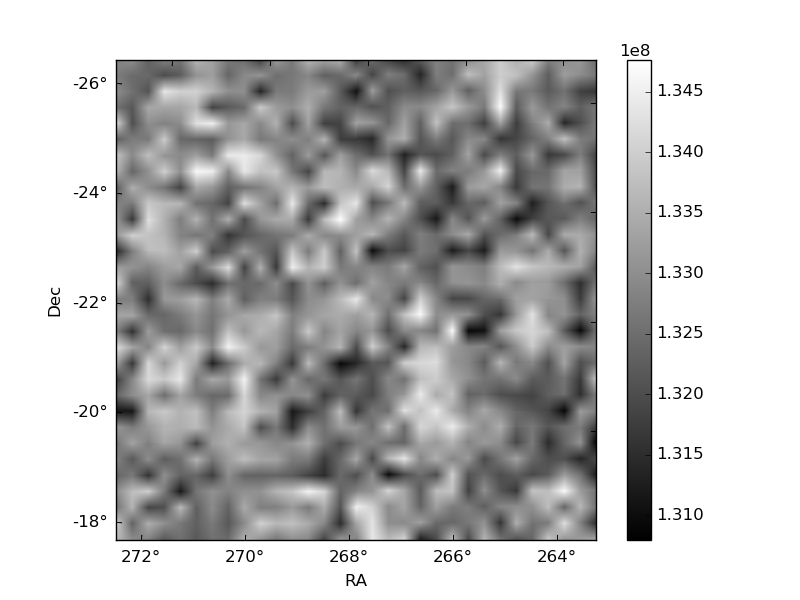
Quadrant B |
|---|---|---|---|
| Quadrant D | 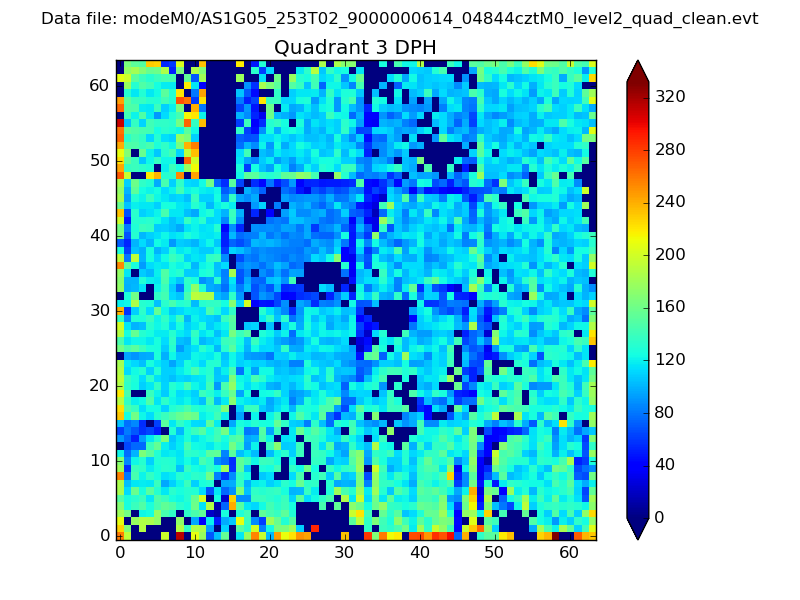 |
 |
Quadrant C |
| Plot type | Count rate plots | Images |
|---|---|---|
| Comparison with Poisson distribution Blue bars denote a histogram of data divided into 1 sec bins. Red curve is a Poisson curve with rate = median count rate of data. |
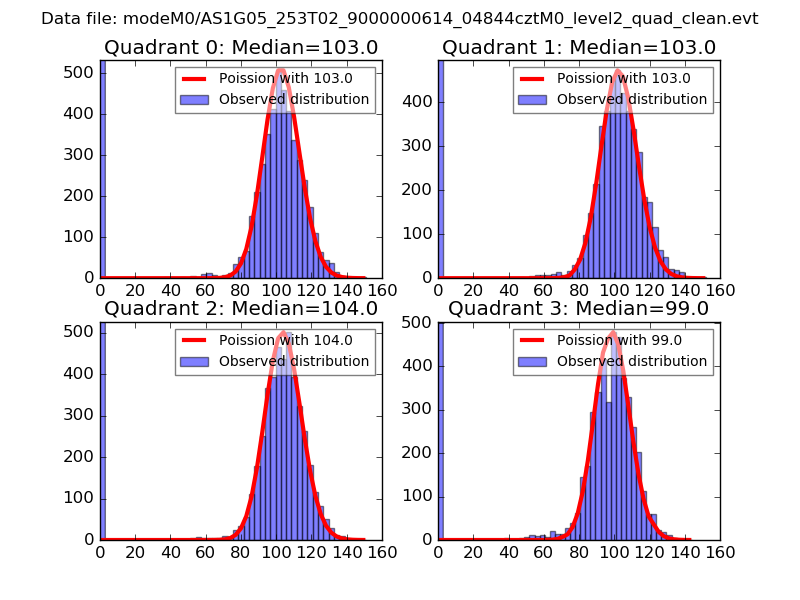 |
 |
| Quadrant-wise count rates Data is divided into 100 sec bins |
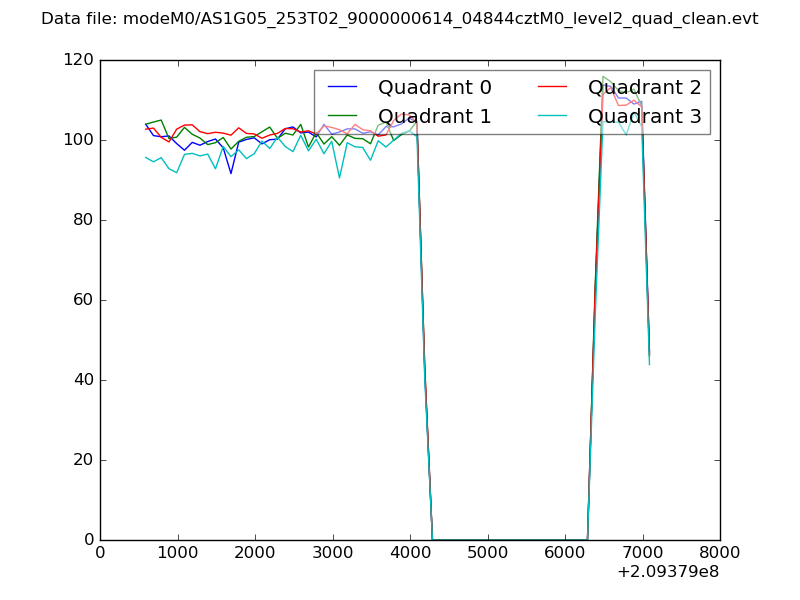 |
|
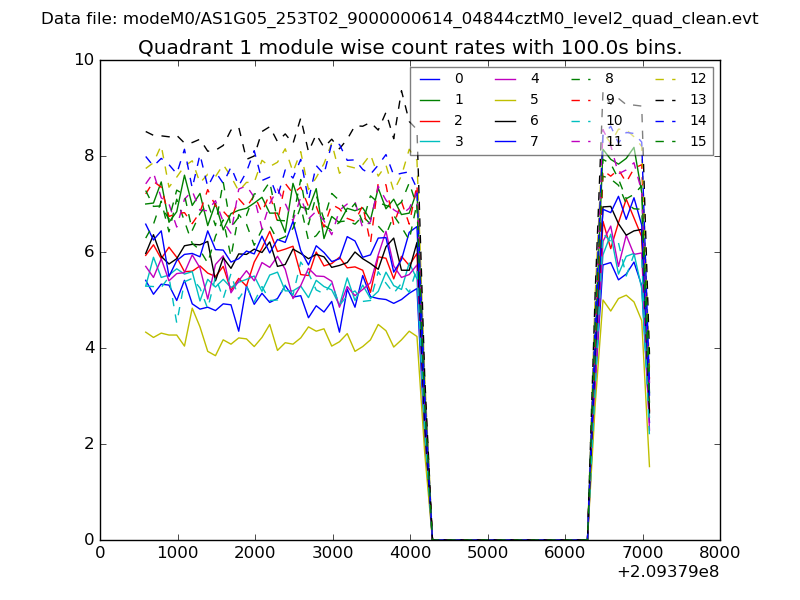
| Module-wise count rates for Quadrant A Data is divided into 100 sec bins |
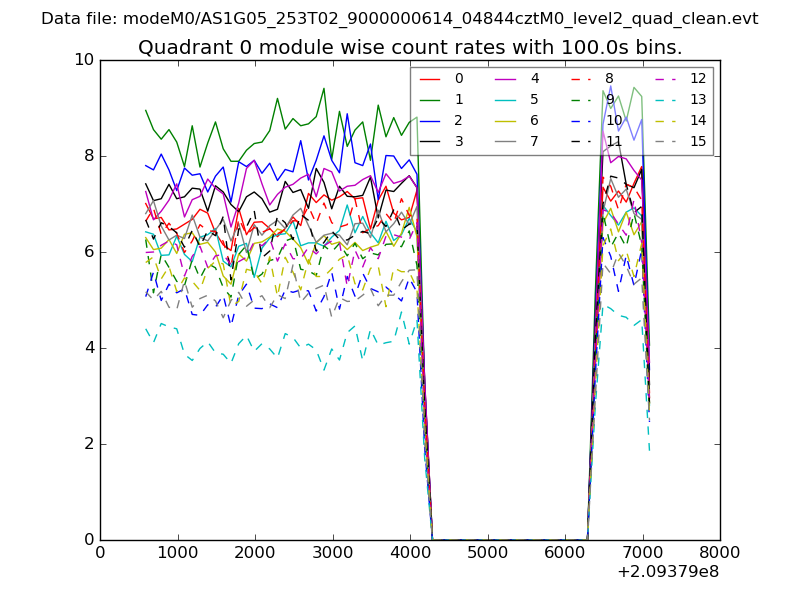 |
 |
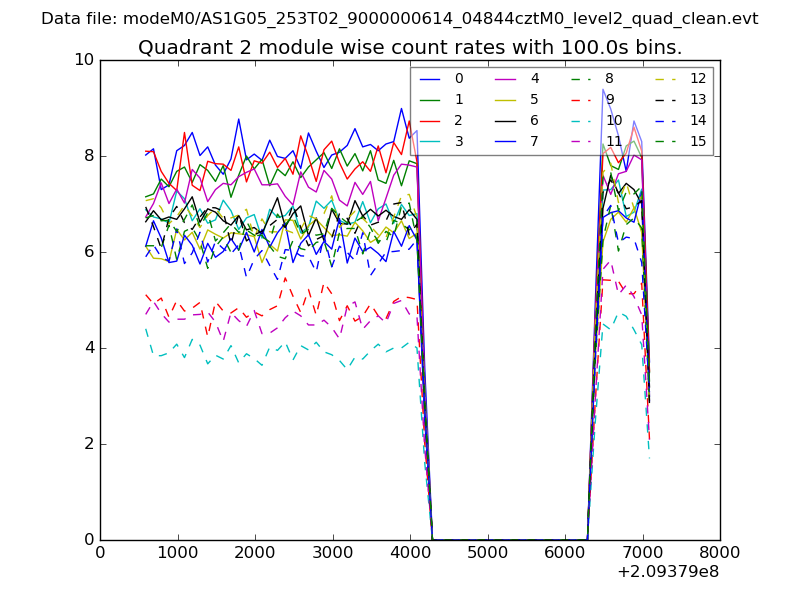
| Module-wise count rates for Quadrant B Data is divided into 100 sec bins |
 |
 |
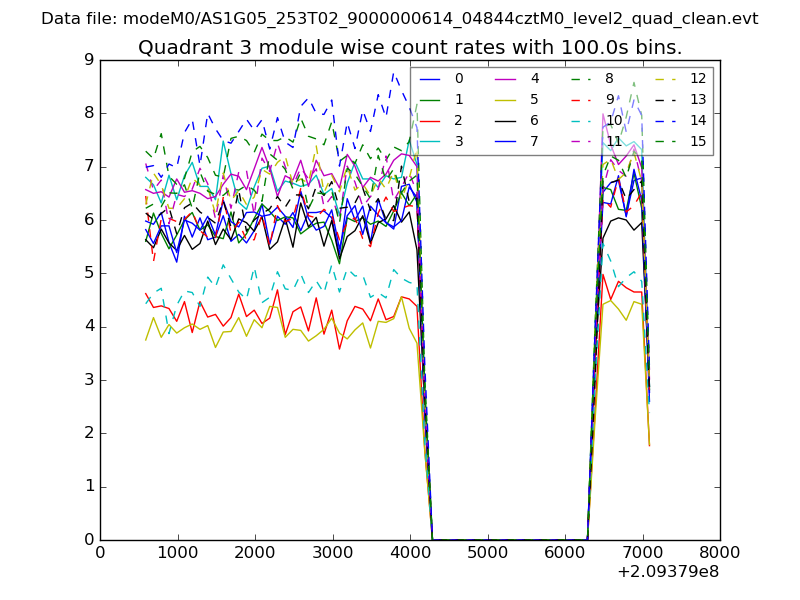
| Module-wise count rates for Quadrant C Data is divided into 100 sec bins |
 |
 |
| Module-wise count rates for Quadrant D Data is divided into 100 sec bins |
 |
 |
| Parameter | Plot |
|---|---|
| CZT HV Monitor | 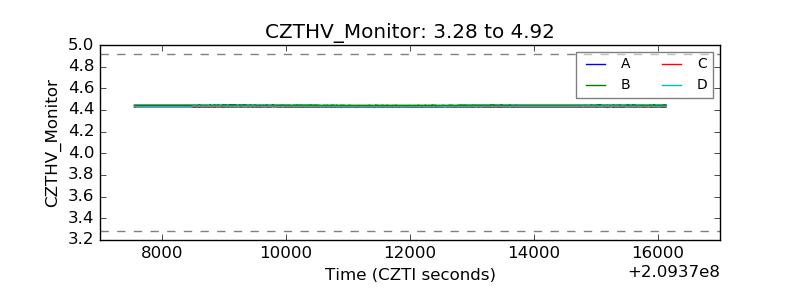 |
| D_VDD | 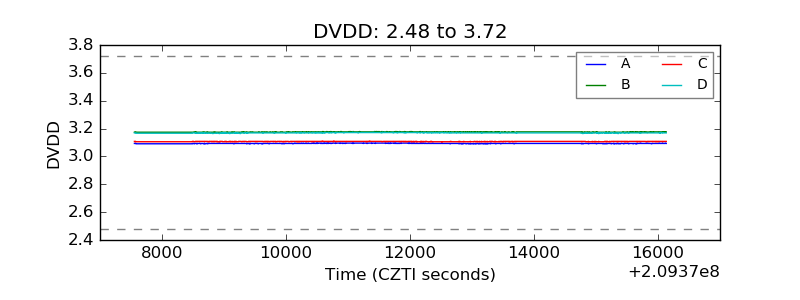 |
| Temperature 1 | 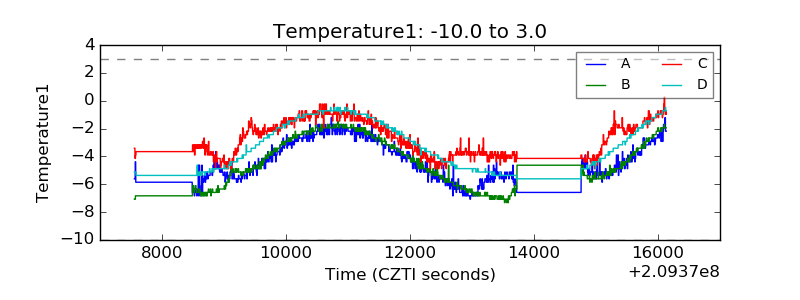 |
| Veto HV Monitor | 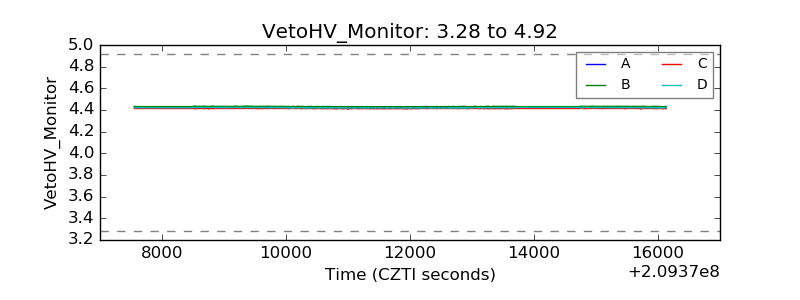 |
| Veto LLD | 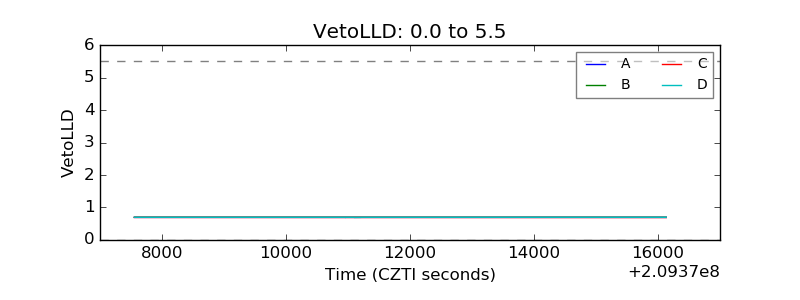 |
| Alpha Counter | 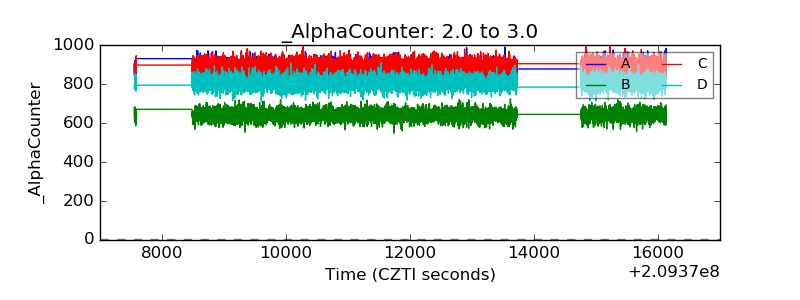 |
| _CPM_Rate |  |
| CZT Counter | 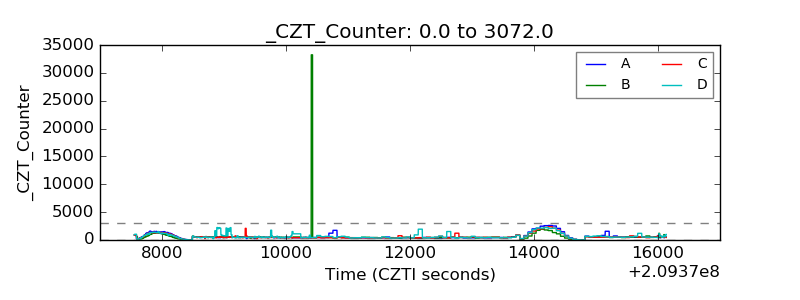 |
| +2.5 Volts monitor |  |
| +5 Volts monitor |  |
| _ROLL_ROT | 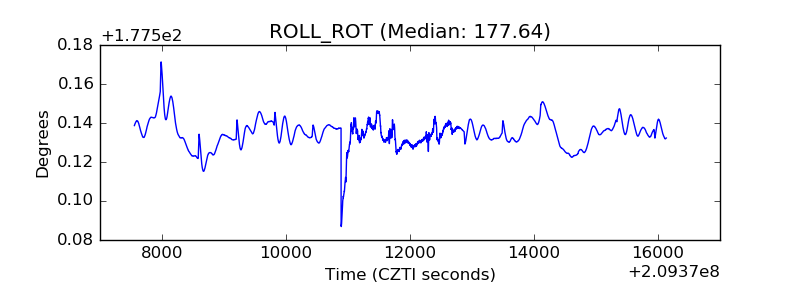 |
| _Roll_DEC | 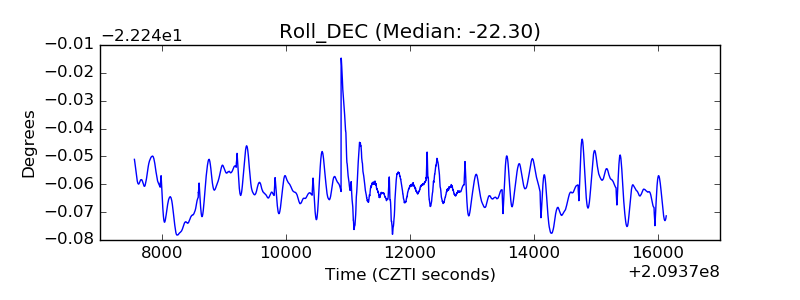 |
| _Roll_RA | 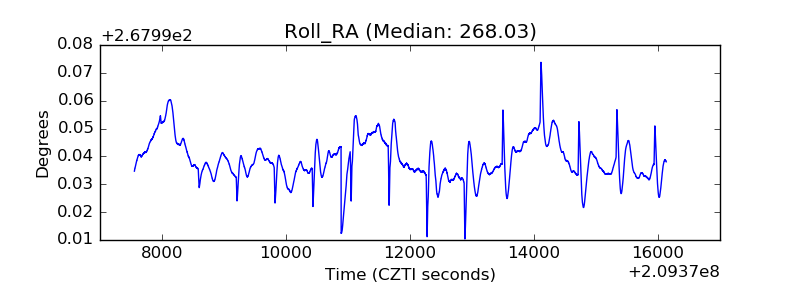 |
| Veto Counter | 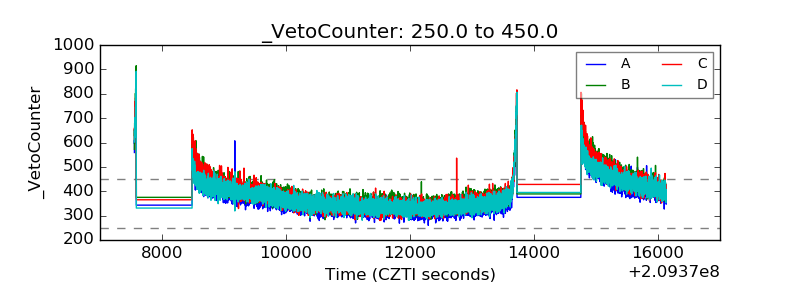 |