| Param | Original file | Final file |
|---|---|---|
| Filename | modeM0/AS1G05_253T02_9000000614_04847cztM0_level2.evt | modeM0/AS1G05_253T02_9000000614_04847cztM0_level2_quad_clean.evt |
| Size (bytes) | 491,863,680 | 93,971,520 |
| Size | 469.1 MB | 89.6 MB |
| Events in quadrant A | 3,455,118 | 607,310 |
| Events in quadrant B | 3,652,785 | 606,620 |
| Events in quadrant C | 3,294,289 | 600,096 |
| Events in quadrant D | 4,046,908 | 572,686 |
| Mode M9 | |||
|---|---|---|---|
| Quadrant | BADHDUFLAG | Total packets | Discarded packets |
| A | 0 | 14 | 0 |
| B | 0 | 14 | 0 |
| C | 0 | 14 | 0 |
| D | 0 | 15 | 0 |
| Mode SS | |||
|---|---|---|---|
| Quadrant | BADHDUFLAG | Total packets | Discarded packets |
| A | 0 | 134 | 0 |
| B | 0 | 134 | 0 |
| C | 0 | 134 | 2 |
| D | 0 | 134 | 2 |
| Mode M0 | |||
|---|---|---|---|
| Quadrant | BADHDUFLAG | Total packets | Discarded packets |
| A | 0 | 14799 | 127 |
| B | 0 | 15177 | 65 |
| C | 0 | 14332 | 80 |
| D | 0 | 16417 | 102 |
| Quadrant | Total seconds | Saturated seconds | Saturation percentage |
|---|---|---|---|
| A | 6578 | 159 | 2.417148% |
| B | 6594 | 144 | 2.183803% |
| C | 6585 | 92 | 1.397115% |
| D | 6587 | 260 | 3.947169% |
Noise dominated data is calculated using 1-second bins in cleaned event files. If a bin has >2000 counts, and if more than 50% of those come from <1% of pixels, then it is considered to be noise-dominated and hence unusable.
| Quadrant | # 1 sec bins | Bins with >0 counts | Bins with >2000 counts | High rate bins dominated by noise | Noise dominated (total time) | Noise dominated (detector-on time) | Marked lightcurve |
|---|---|---|---|---|---|---|---|
| A | 7772 | 6621 | 33 | 33 | 0.42% | 0.50% | 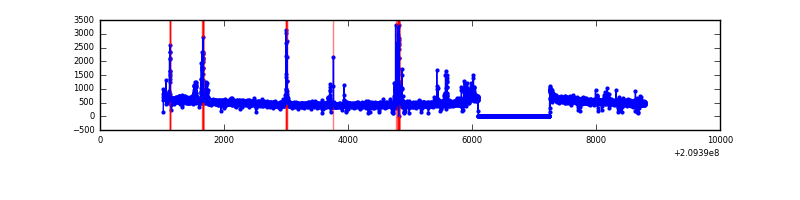 |
| B | 7772 | 6622 | 23 | 23 | 0.30% | 0.35% | 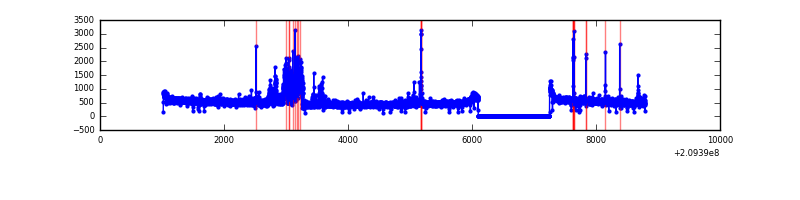 |
| C | 7772 | 6619 | 4 | 4 | 0.05% | 0.06% | 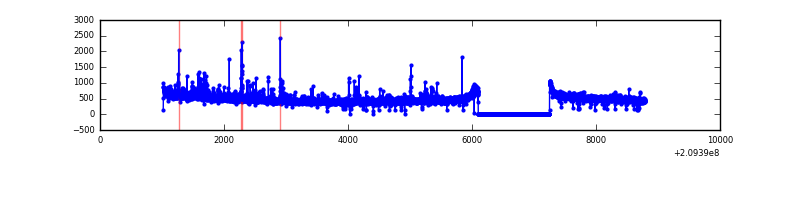 |
| D | 7772 | 6620 | 122 | 122 | 1.57% | 1.84% | 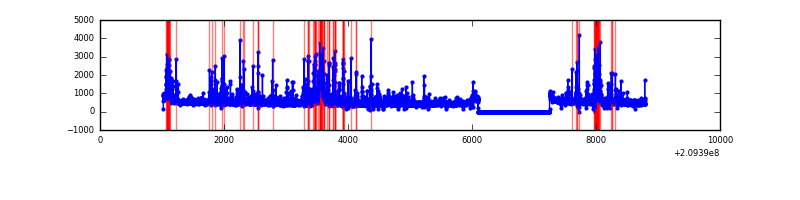 |
Top three noisy pixels from each quadrant. If the there are fewer than three noisy pixels in the level2.evt file, extra rows are filled as -1
| Pixel properties | Quadrant properties | ||||||
|---|---|---|---|---|---|---|---|
| Quadrant | DetID | PixID | Counts | Sigma | Mean | Median | Sigma |
| A | 0 | 50 | 204181 | 1208.14 | 829 | 813 | 168.3 |
| A | 13 | 251 | 43970 | 256.38 | 829 | 813 | 168.3 |
| A | 12 | 194 | 8443 | 45.33 | 829 | 813 | 168.3 |
| B | 8 | 3 | 237593 | 1501.58 | 828 | 811 | 157.7 |
| B | 4 | 80 | 62956 | 394.1 | 828 | 811 | 157.7 |
| B | 10 | 246 | 51245 | 319.83 | 828 | 811 | 157.7 |
| C | 9 | 247 | 170501 | 922.06 | 795 | 798 | 184.0 |
| C | 12 | 4 | 12873 | 65.61 | 795 | 798 | 184.0 |
| C | 1 | 16 | 8326 | 40.9 | 795 | 798 | 184.0 |
| D | 13 | 235 | 442108 | 2260.49 | 799 | 776 | 195.2 |
| D | 2 | 234 | 158016 | 805.38 | 799 | 776 | 195.2 |
| D | 2 | 136 | 123510 | 628.64 | 799 | 776 | 195.2 |
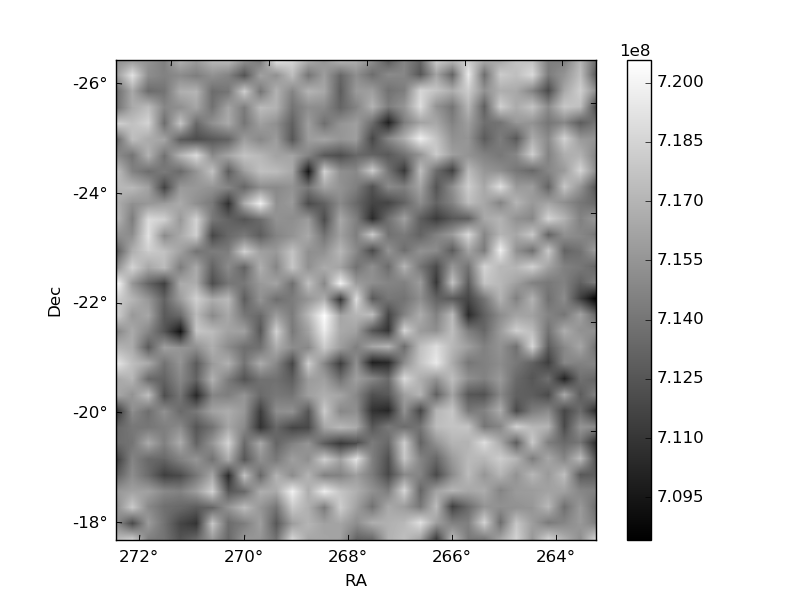
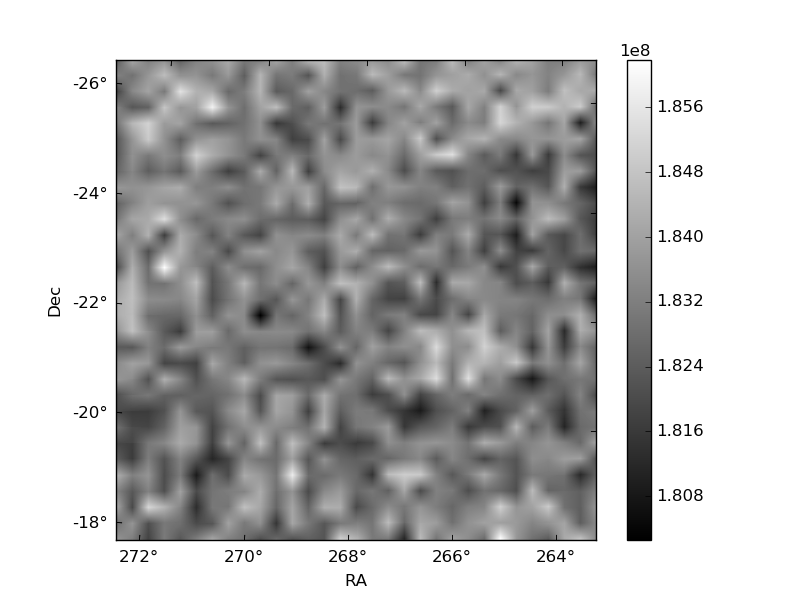
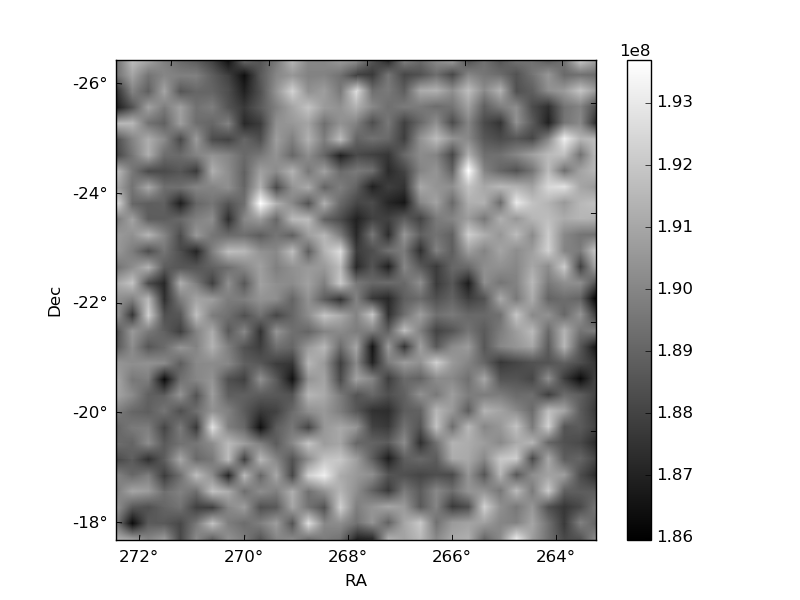
Histogram calculated using DETX and DETY for each event in the final _common_clean file
| Quadrant A | 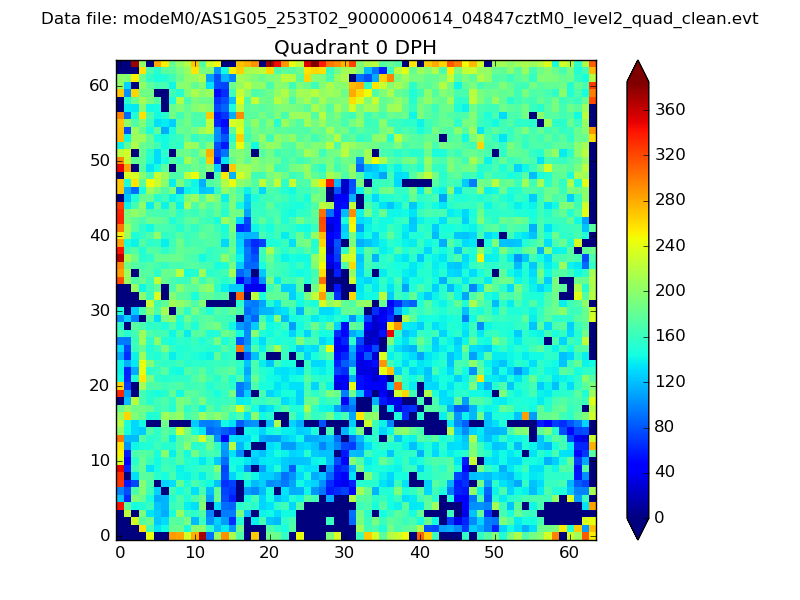 |
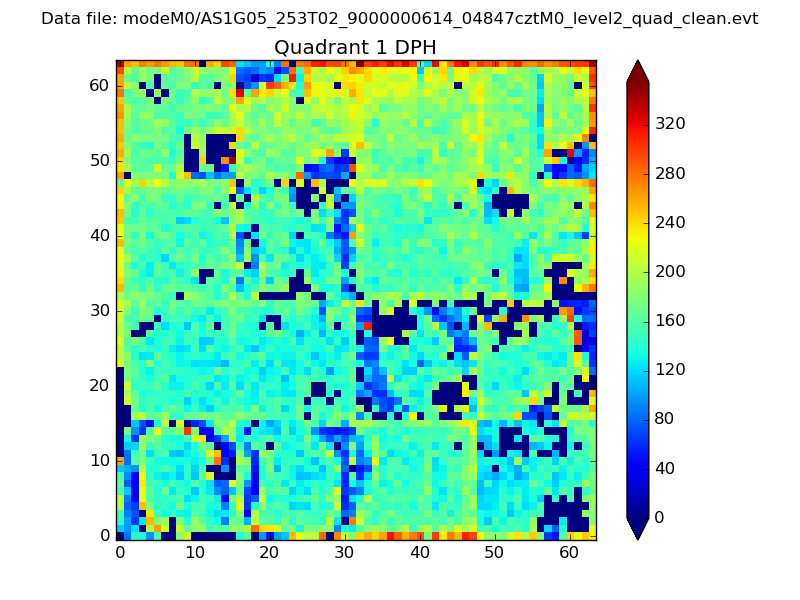 |
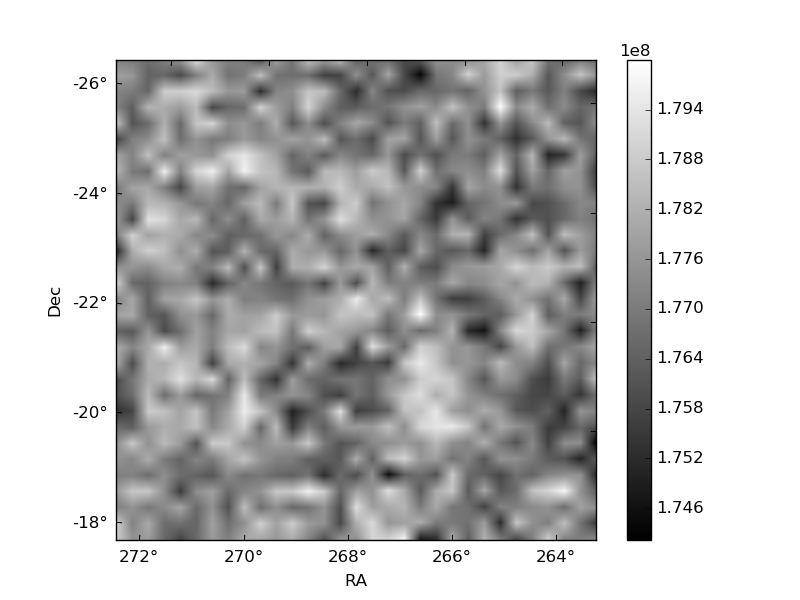
Quadrant B |
|---|---|---|---|
| Quadrant D | 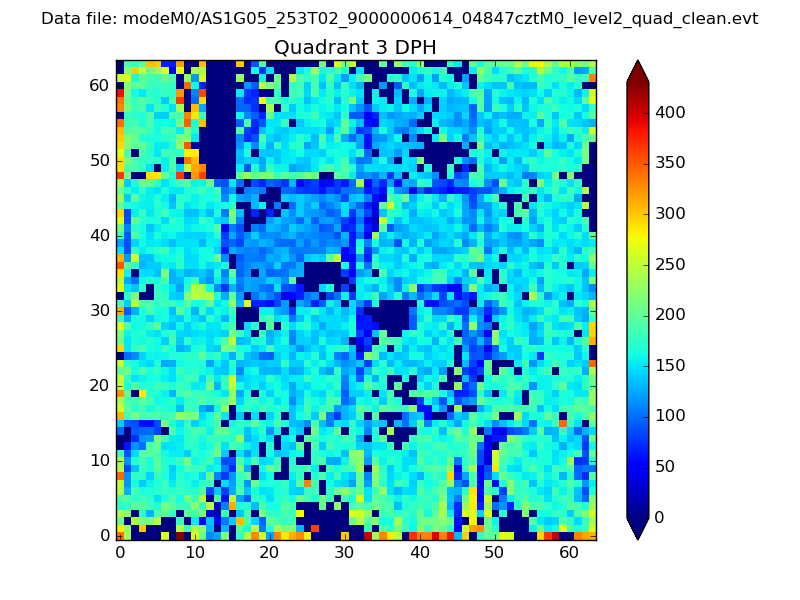 |
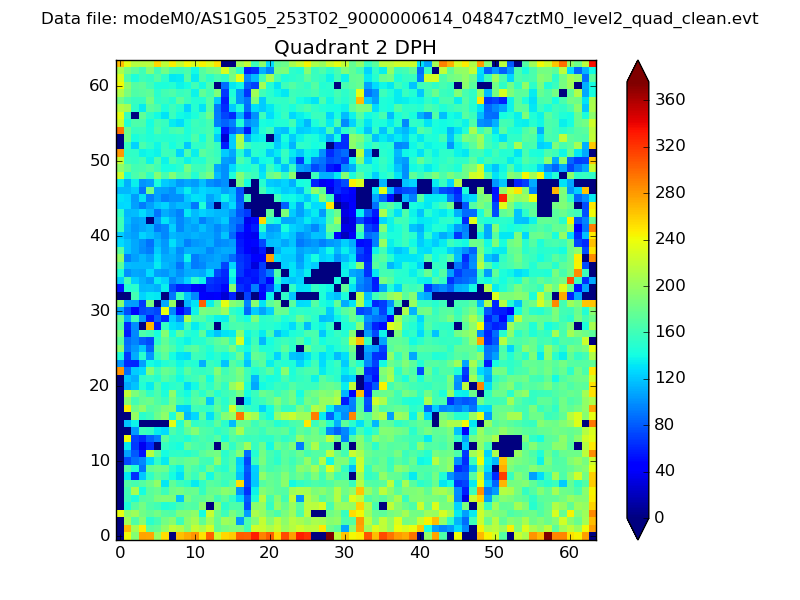 |
Quadrant C |
| Plot type | Count rate plots | Images |
|---|---|---|
| Comparison with Poisson distribution Blue bars denote a histogram of data divided into 1 sec bins. Red curve is a Poisson curve with rate = median count rate of data. |
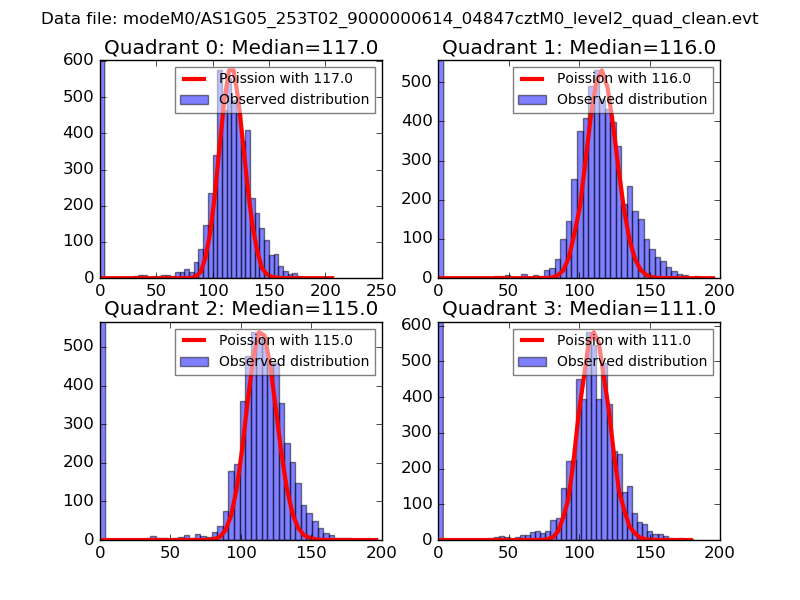 |
 |
| Quadrant-wise count rates Data is divided into 100 sec bins |
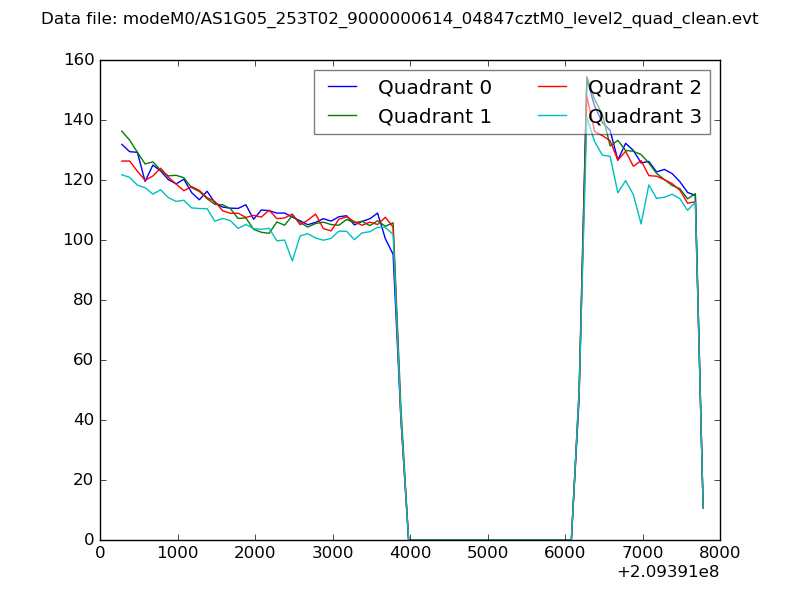 |
|
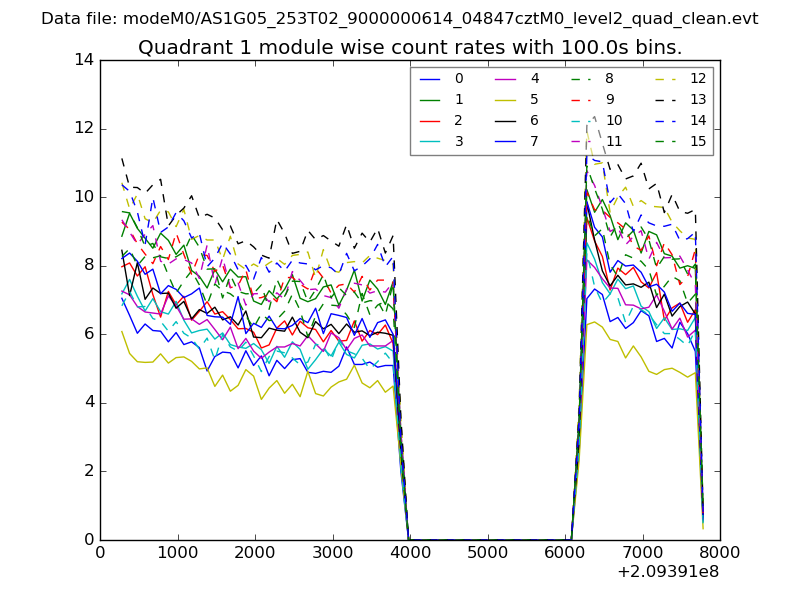
| Module-wise count rates for Quadrant A Data is divided into 100 sec bins |
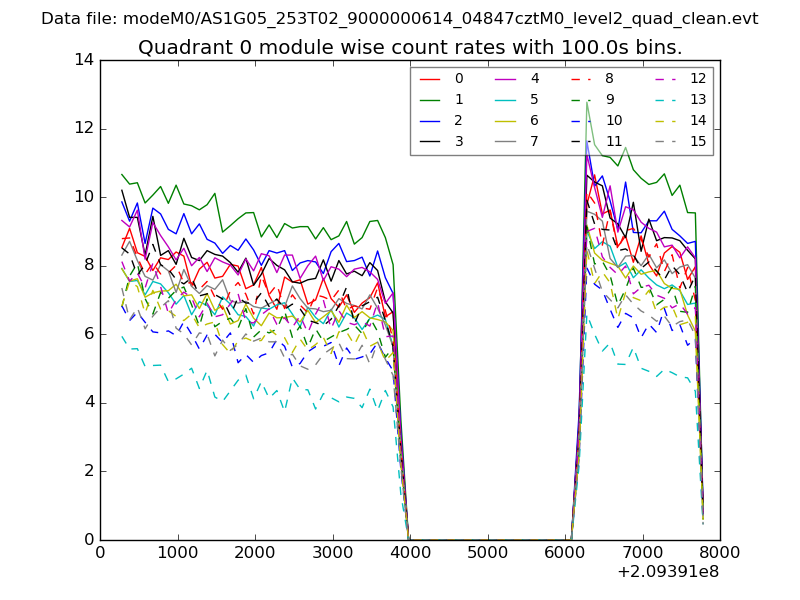 |
 |
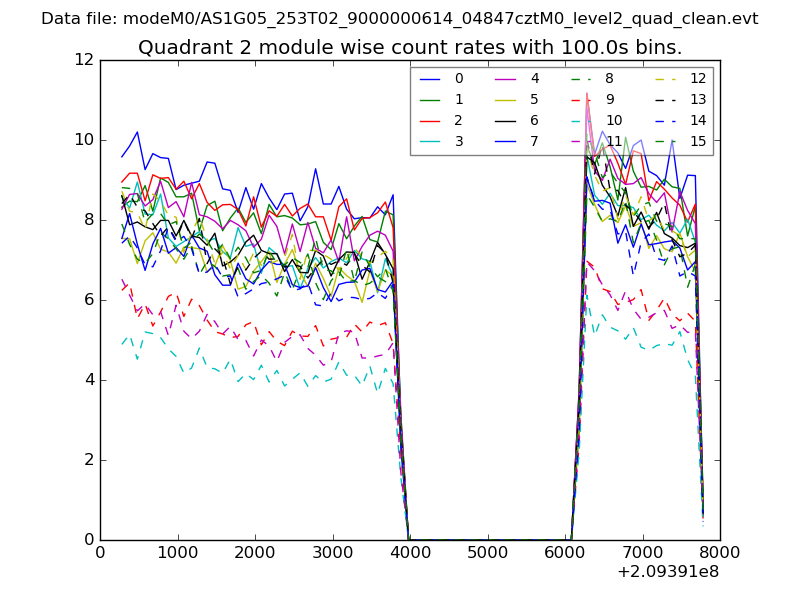
| Module-wise count rates for Quadrant B Data is divided into 100 sec bins |
 |
 |
| Module-wise count rates for Quadrant C Data is divided into 100 sec bins |
 |
 |
| Module-wise count rates for Quadrant D Data is divided into 100 sec bins |
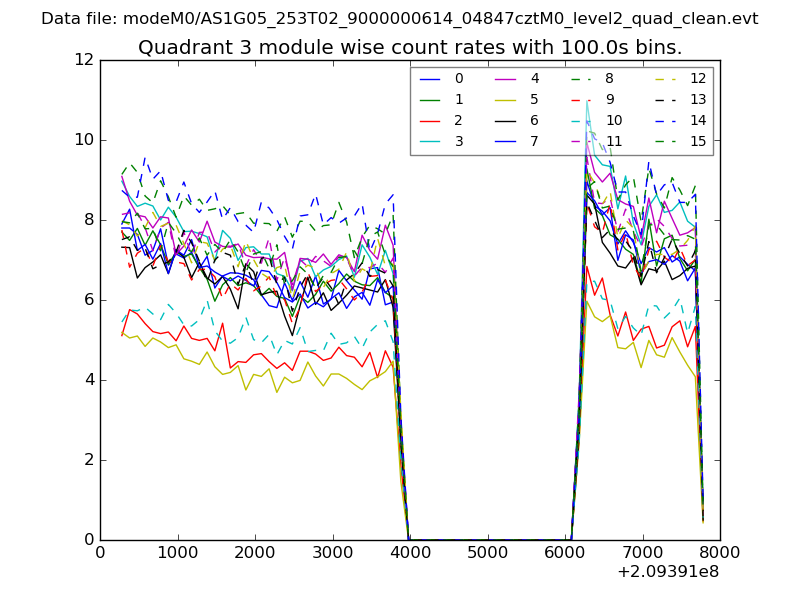 |
 |
| Parameter | Plot |
|---|---|
| CZT HV Monitor | 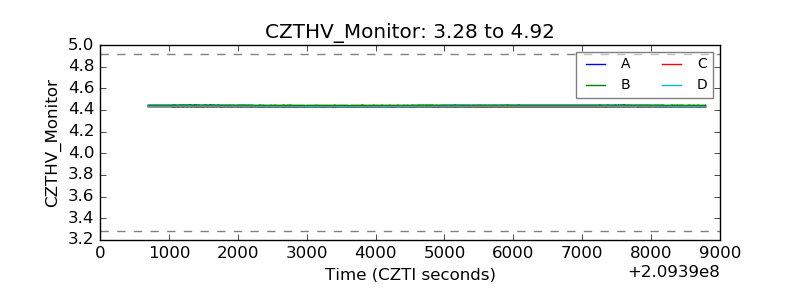 |
| D_VDD | 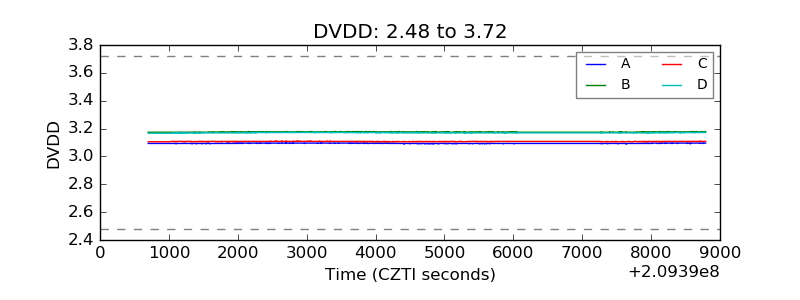 |
| Temperature 1 | 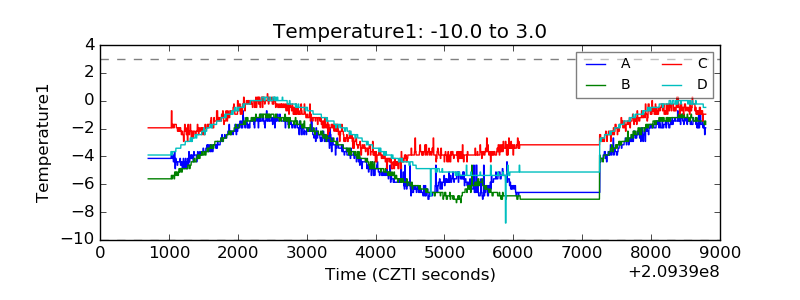 |
| Veto HV Monitor | 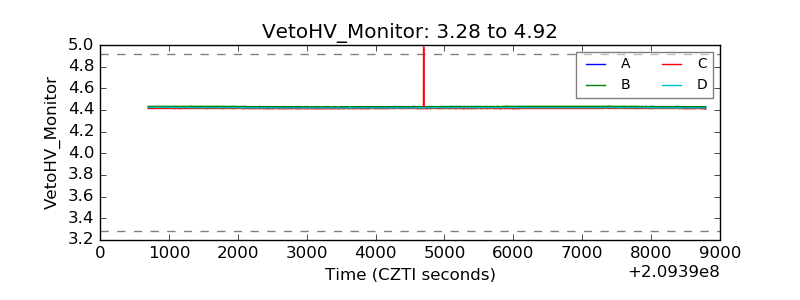 |
| Veto LLD | 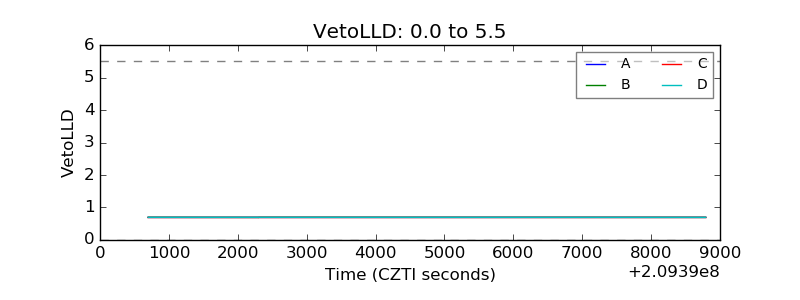 |
| Alpha Counter | 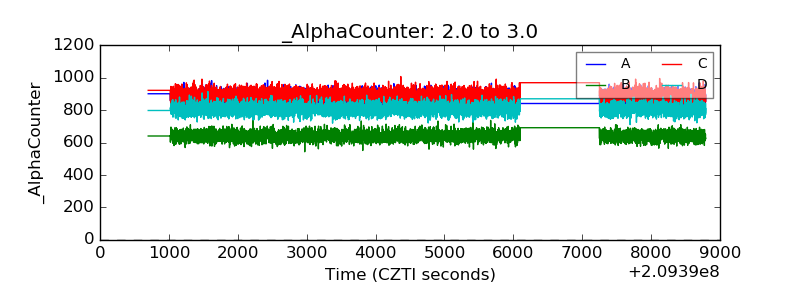 |
| _CPM_Rate | 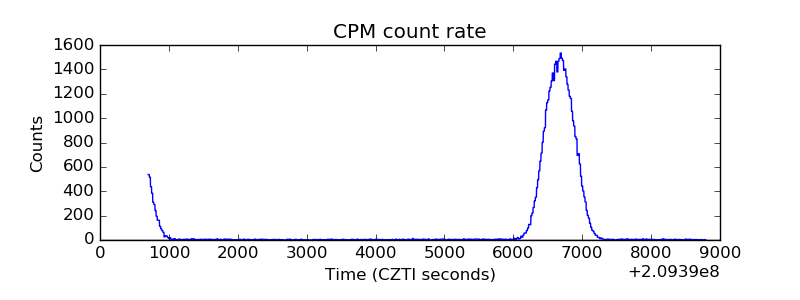 |
| CZT Counter | 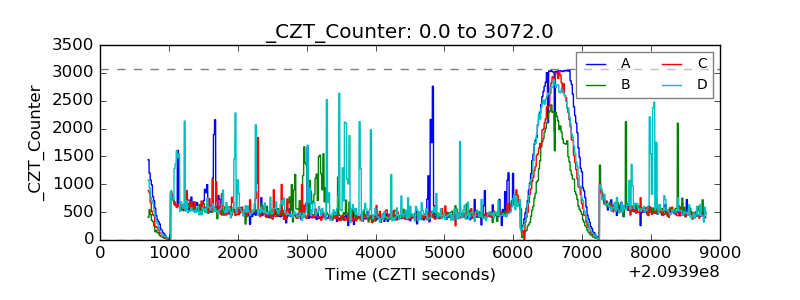 |
| +2.5 Volts monitor |  |
| +5 Volts monitor |  |
| _ROLL_ROT | 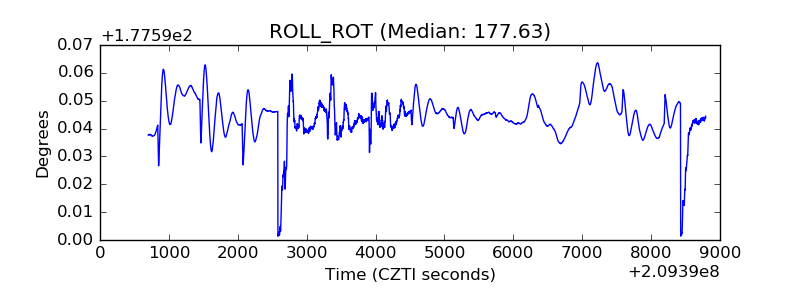 |
| _Roll_DEC | 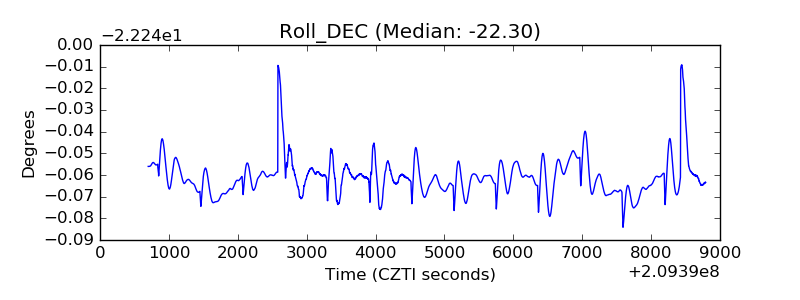 |
| _Roll_RA | 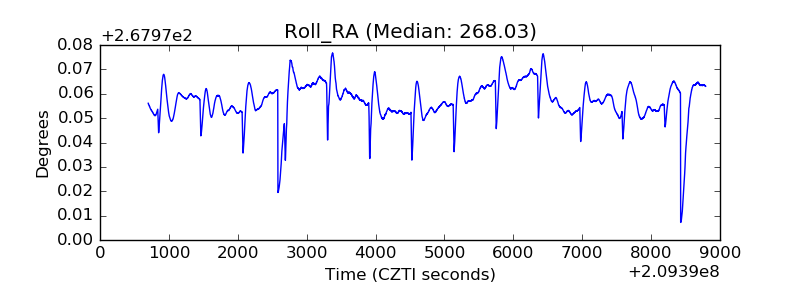 |
| Veto Counter | 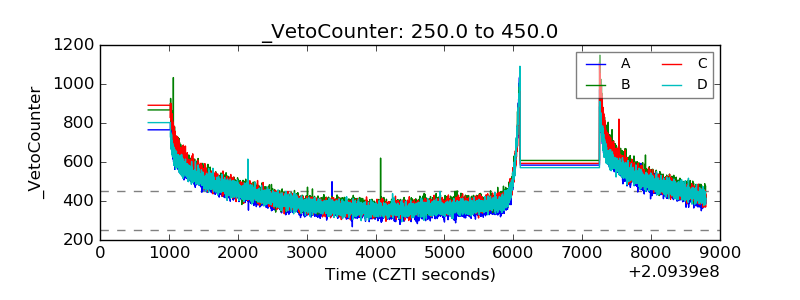 |