| Param | Original file | Final file |
|---|---|---|
| Filename | modeM0/AS1G05_002T01_9000000616cztM0_level2.fits | modeM0/AS1G05_002T01_9000000616cztM0_level2_quad_clean.evt |
| Size (bytes) | 90,132,480 | 62,089,920 |
| Size | 86.0 MB | 59.2 MB |
| Events in quadrant A | 551,812 | 318,900 |
| Events in quadrant B | 527,536 | 319,033 |
| Events in quadrant C | 536,424 | 307,912 |
| Events in quadrant D | 461,484 | 280,787 |
| Mode SS | |||
|---|---|---|---|
| Quadrant | BADHDUFLAG | Total packets | Discarded packets |
| A | 0 | 194 | 0 |
| B | 0 | 194 | 0 |
| C | 0 | 194 | 0 |
| D | 0 | 194 | 0 |
| Mode M0 | |||
|---|---|---|---|
| Quadrant | BADHDUFLAG | Total packets | Discarded packets |
| A | 0 | 19910 | 0 |
| B | 0 | 19964 | 0 |
| C | 0 | 19964 | 0 |
| D | 0 | 23448 | 0 |
| Mode M9 | |||
|---|---|---|---|
| Quadrant | BADHDUFLAG | Total packets | Discarded packets |
| A | 0 | 27 | 0 |
| B | 0 | 27 | 0 |
| C | 0 | 27 | 0 |
| D | 0 | 28 | 0 |
| Quadrant | Total seconds | Saturated seconds | Saturation percentage |
|---|---|---|---|
| A | 9403 | 148 | 1.573966% |
| B | 9401 | 110 | 1.170088% |
| C | 9400 | 105 | 1.117021% |
| D | 9405 | 316 | 3.359915% |
Noise dominated data is calculated using 1-second bins in cleaned event files. If a bin has >2000 counts, and if more than 50% of those come from <1% of pixels, then it is considered to be noise-dominated and hence unusable.
| Quadrant | # 1 sec bins | Bins with >0 counts | Bins with >2000 counts | High rate bins dominated by noise | Noise dominated (total time) | Noise dominated (detector-on time) | Marked lightcurve |
|---|---|---|---|---|---|---|---|
| A | 69082 | 9423 | 0 | 0 | 0.00% | 0.00% |  |
| B | 69082 | 9423 | 0 | 0 | 0.00% | 0.00% |  |
| C | 69082 | 9415 | 0 | 0 | 0.00% | 0.00% | 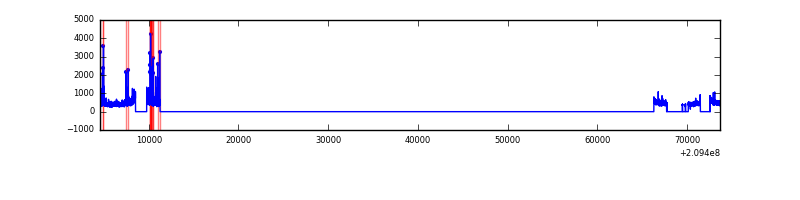 |
| D | 69082 | 9412 | 0 | 0 | 0.00% | 0.00% | 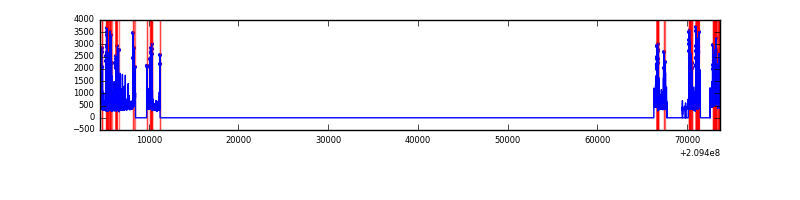 |
Top three noisy pixels from each quadrant. If the there are fewer than three noisy pixels in the level2.evt file, extra rows are filled as -1
| Pixel properties | Quadrant properties | ||||||
|---|---|---|---|---|---|---|---|
| Quadrant | DetID | PixID | Counts | Sigma | Mean | Median | Sigma |
| A | 0 | 29 | 551 | 10.82 | 143 | 135 | 38.5 |
| A | 7 | 110 | 449 | 8.17 | 143 | 135 | 38.5 |
| A | 0 | 30 | 439 | 7.91 | 143 | 135 | 38.5 |
| B | 2 | 9 | 475 | 11.45 | 139 | 134 | 29.8 |
| B | 14 | 254 | 393 | 8.69 | 139 | 134 | 29.8 |
| B | 12 | 226 | 382 | 8.32 | 139 | 134 | 29.8 |
| C | 12 | 241 | 374 | 6.19 | 141 | 131 | 39.3 |
| C | 2 | 191 | 369 | 6.06 | 141 | 131 | 39.3 |
| C | 9 | 188 | 365 | 5.96 | 141 | 131 | 39.3 |
| D | 11 | 82 | 369 | 7.01 | 131 | 119 | 35.7 |
| D | 6 | 44 | 346 | 6.36 | 131 | 119 | 35.7 |
| D | 3 | 14 | 339 | 6.17 | 131 | 119 | 35.7 |
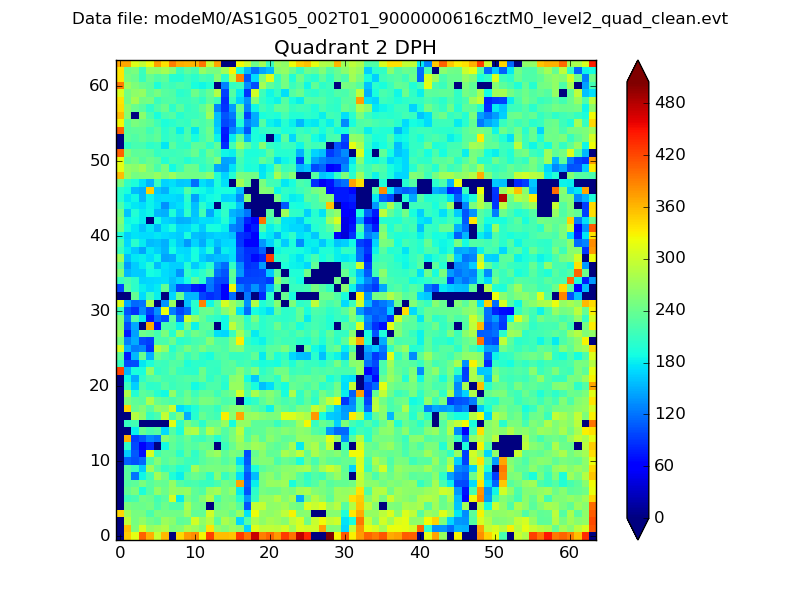
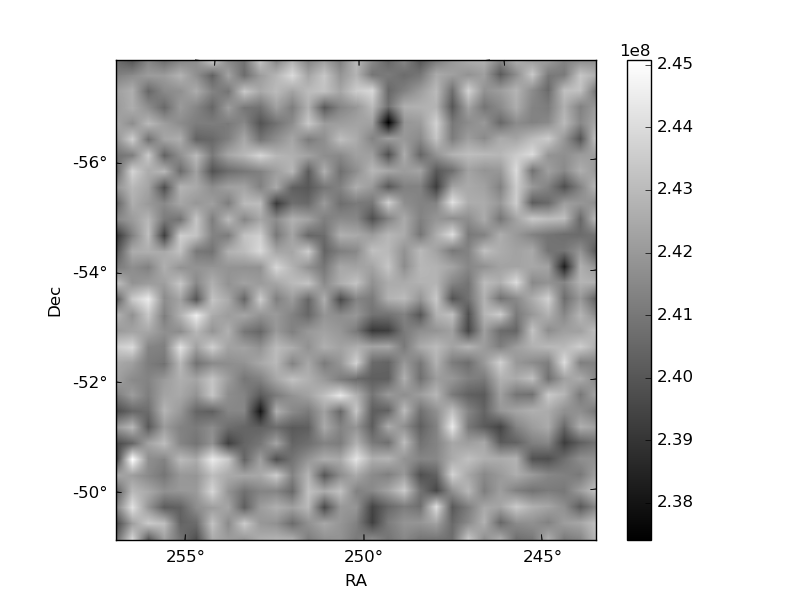
Histogram calculated using DETX and DETY for each event in the final _common_clean file
| Quadrant A | 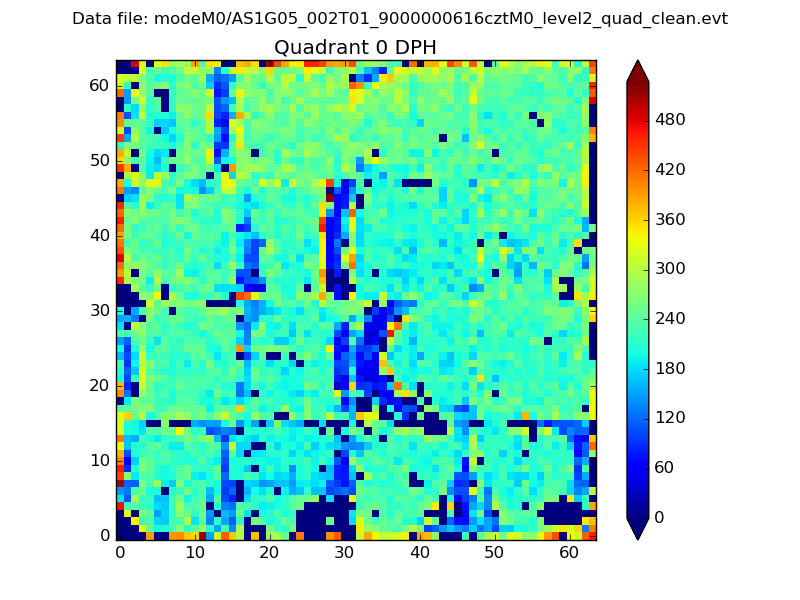 |
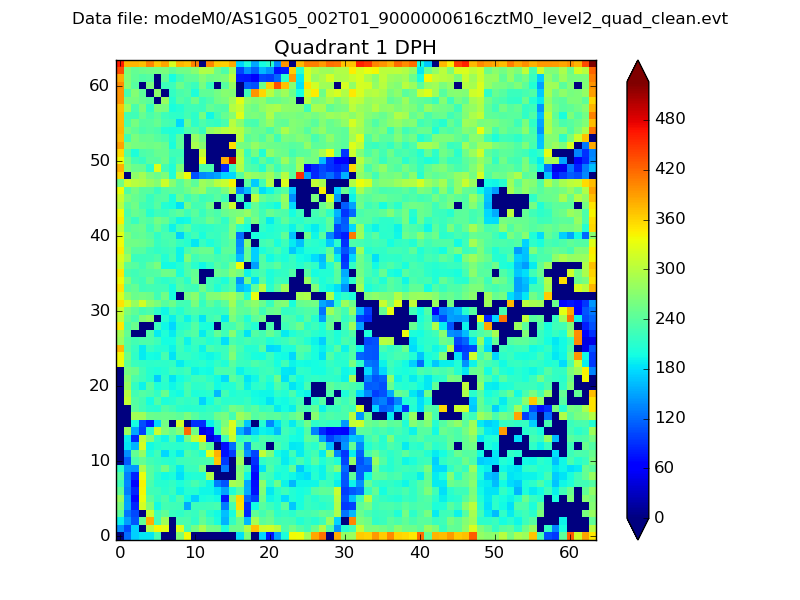 |
Quadrant B |
|---|---|---|---|
| Quadrant D | 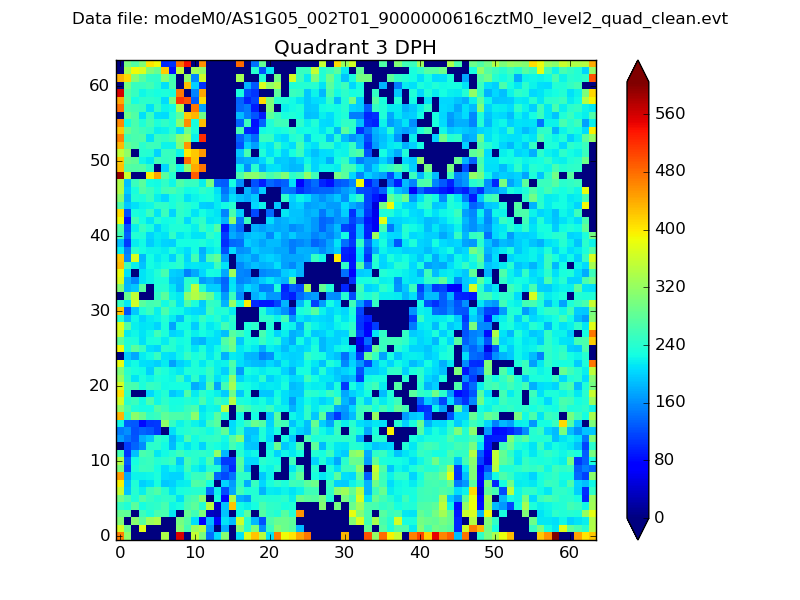 |
 |
Quadrant C |
| Plot type | Count rate plots | Images |
|---|---|---|
| Comparison with Poisson distribution Blue bars denote a histogram of data divided into 1 sec bins. Red curve is a Poisson curve with rate = median count rate of data. |
 |
 |
| Quadrant-wise count rates Data is divided into 100 sec bins |
 |
|
| Module-wise count rates for Quadrant A Data is divided into 100 sec bins |
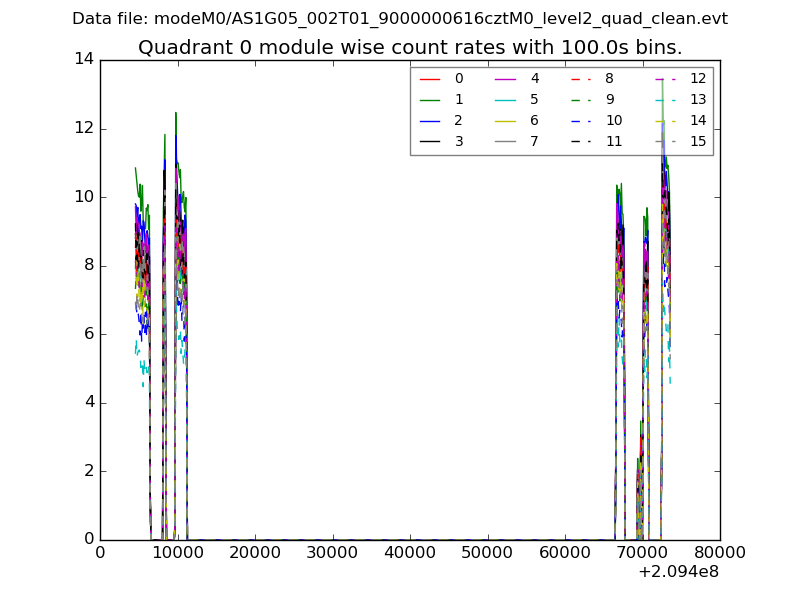 |
 |
| Module-wise count rates for Quadrant B Data is divided into 100 sec bins |
 |
 |
| Module-wise count rates for Quadrant C Data is divided into 100 sec bins |
 |
 |
| Module-wise count rates for Quadrant D Data is divided into 100 sec bins |
 |
 |
| Parameter | Plot |
|---|---|
| CZT HV Monitor | 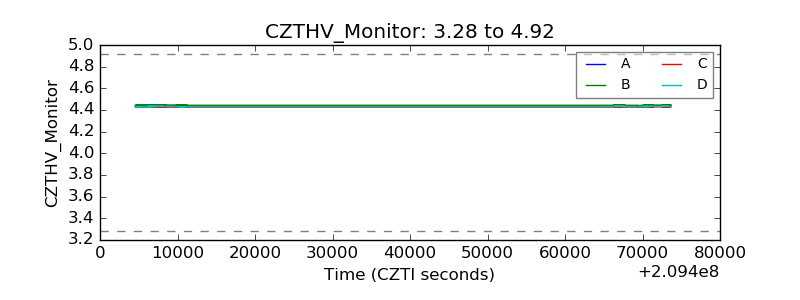 |
| D_VDD |  |
| Temperature 1 |  |
| Veto HV Monitor |  |
| Veto LLD |  |
| Alpha Counter | 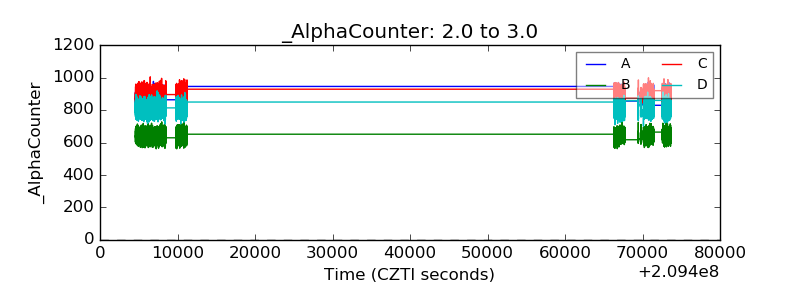 |
| _CPM_Rate | 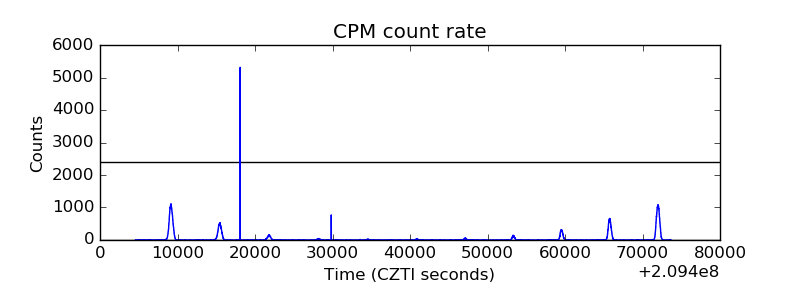 |
| CZT Counter |  |
| +2.5 Volts monitor |  |
| +5 Volts monitor | 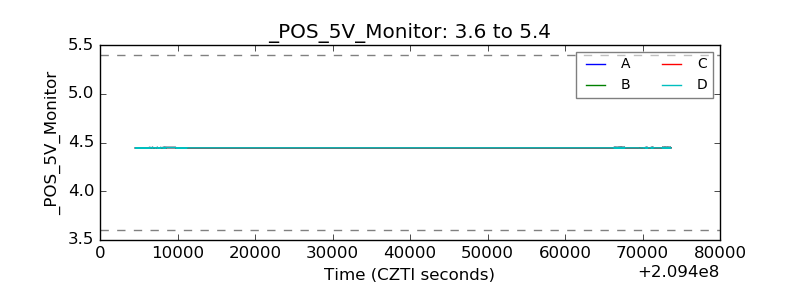 |
| _ROLL_ROT |  |
| _Roll_DEC |  |
| _Roll_RA |  |
| Veto Counter |  |