| Param | Original file | Final file |
|---|---|---|
| Filename | modeM0/AS1G05_002T01_9000000616_04848cztM0_level2.evt | modeM0/AS1G05_002T01_9000000616_04848cztM0_level2_quad_clean.evt |
| Size (bytes) | 32,633,280 | 8,668,800 |
| Size | 31.1 MB | 8.3 MB |
| Events in quadrant A | 220,342 | 55,535 |
| Events in quadrant B | 242,588 | 55,385 |
| Events in quadrant C | 254,016 | 54,739 |
| Events in quadrant D | 234,395 | 53,998 |
| Mode SS | |||
|---|---|---|---|
| Quadrant | BADHDUFLAG | Total packets | Discarded packets |
| A | 0 | 10 | 0 |
| B | 0 | 10 | 0 |
| C | 0 | 10 | 0 |
| D | 0 | 10 | 0 |
| Mode M0 | |||
|---|---|---|---|
| Quadrant | BADHDUFLAG | Total packets | Discarded packets |
| A | 0 | 985 | 1 |
| B | 0 | 1031 | 0 |
| C | 0 | 1098 | 0 |
| D | 0 | 1060 | 0 |
| Quadrant | Total seconds | Saturated seconds | Saturation percentage |
|---|---|---|---|
| A | 490 | 0 | 0.000000% |
| B | 490 | 0 | 0.000000% |
| C | 490 | 5 | 1.020408% |
| D | 490 | 3 | 0.612245% |
Noise dominated data is calculated using 1-second bins in cleaned event files. If a bin has >2000 counts, and if more than 50% of those come from <1% of pixels, then it is considered to be noise-dominated and hence unusable.
| Quadrant | # 1 sec bins | Bins with >0 counts | Bins with >2000 counts | High rate bins dominated by noise | Noise dominated (total time) | Noise dominated (detector-on time) | Marked lightcurve |
|---|---|---|---|---|---|---|---|
| A | 490 | 490 | 0 | 0 | 0.00% | 0.00% | 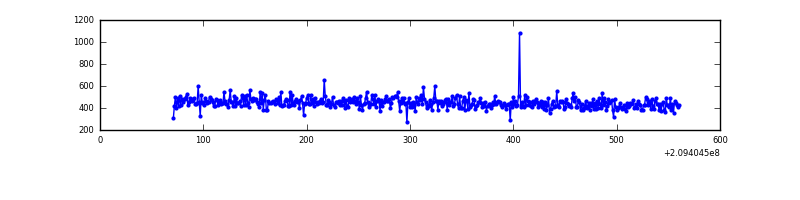 |
| B | 490 | 490 | 0 | 0 | 0.00% | 0.00% | 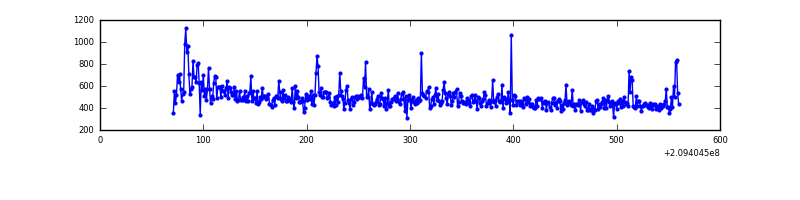 |
| C | 490 | 490 | 3 | 3 | 0.61% | 0.61% | 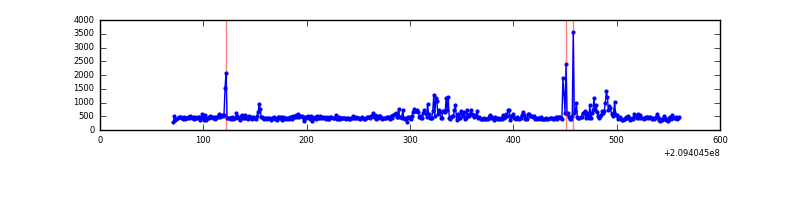 |
| D | 490 | 490 | 3 | 3 | 0.61% | 0.61% | 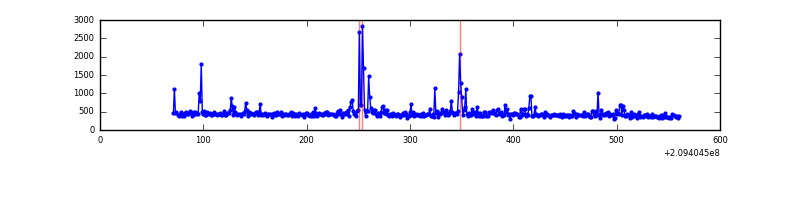 |
Top three noisy pixels from each quadrant. If the there are fewer than three noisy pixels in the level2.evt file, extra rows are filled as -1
| Pixel properties | Quadrant properties | ||||||
|---|---|---|---|---|---|---|---|
| Quadrant | DetID | PixID | Counts | Sigma | Mean | Median | Sigma |
| A | 13 | 251 | 2424 | 174.02 | 56 | 54 | 13.6 |
| A | 12 | 194 | 585 | 38.99 | 56 | 54 | 13.6 |
| A | 0 | 226 | 561 | 37.23 | 56 | 54 | 13.6 |
| B | 14 | 167 | 13465 | 1042.5 | 55 | 54 | 12.9 |
| B | 10 | 246 | 5047 | 388.13 | 55 | 54 | 12.9 |
| B | 0 | 244 | 2830 | 215.79 | 55 | 54 | 12.9 |
| C | 9 | 247 | 47617 | 3468.98 | 52 | 52 | 13.7 |
| C | 14 | 67 | 869 | 59.58 | 52 | 52 | 13.7 |
| C | 13 | 61 | 479 | 31.14 | 52 | 52 | 13.7 |
| D | 13 | 235 | 14990 | 994.61 | 52 | 50 | 15.0 |
| D | 10 | 15 | 9251 | 612.54 | 52 | 50 | 15.0 |
| D | 2 | 136 | 7796 | 515.68 | 52 | 50 | 15.0 |
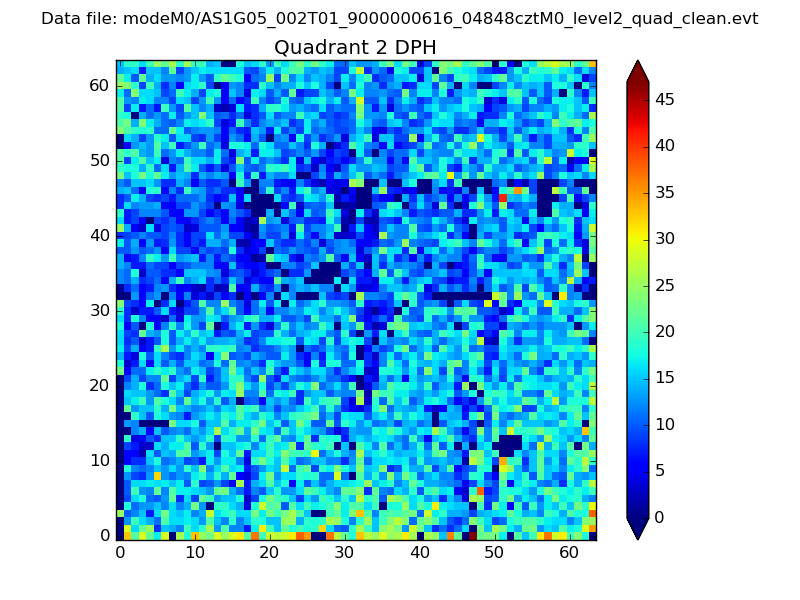
Histogram calculated using DETX and DETY for each event in the final _common_clean file
| Quadrant A | 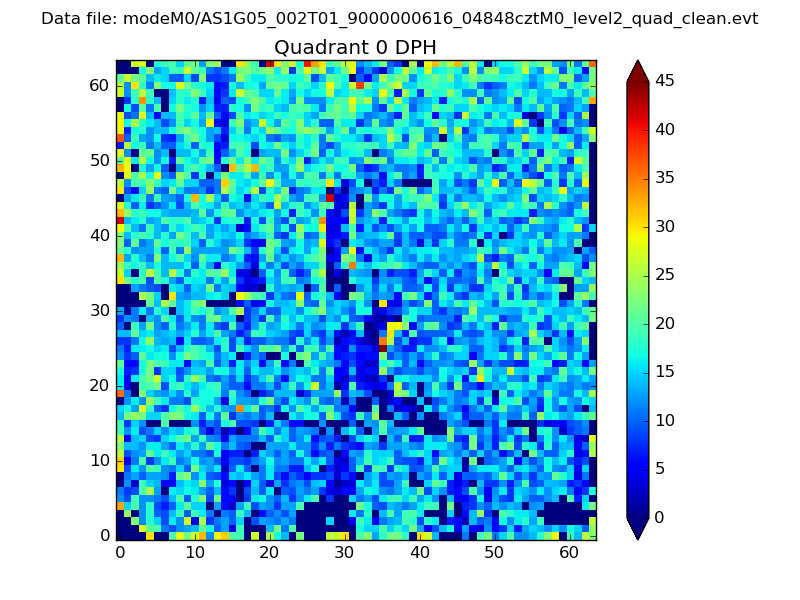 |
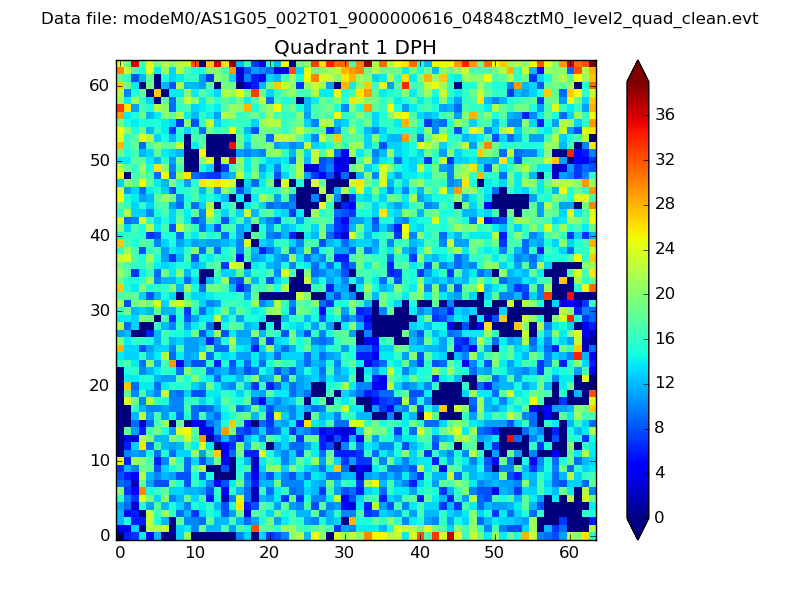 |
Quadrant B |
|---|---|---|---|
| Quadrant D | 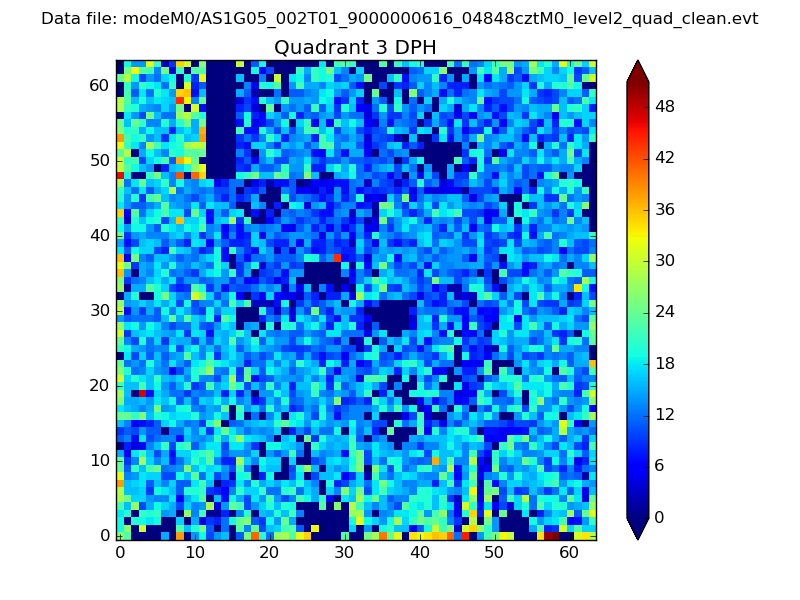 |
 |
Quadrant C |
| Plot type | Count rate plots | Images |
|---|---|---|
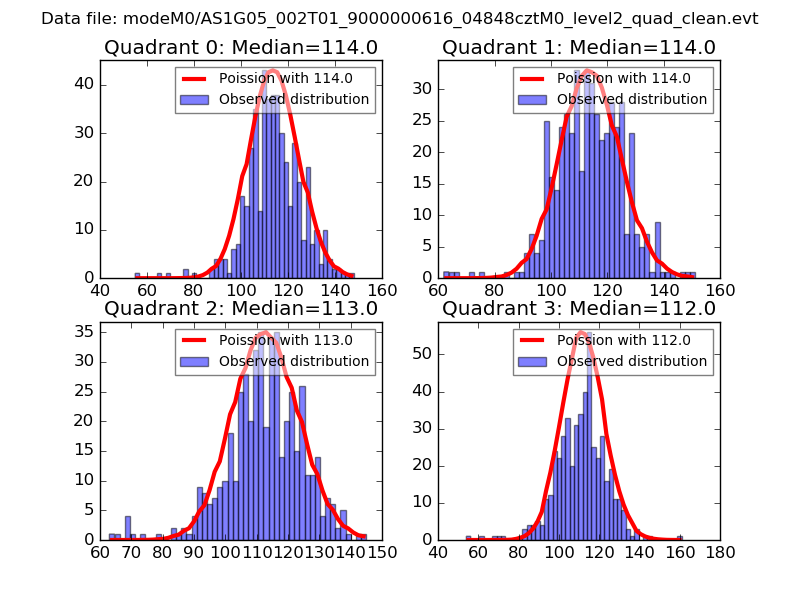
| Comparison with Poisson distribution Blue bars denote a histogram of data divided into 1 sec bins. Red curve is a Poisson curve with rate = median count rate of data. |
 |
 |
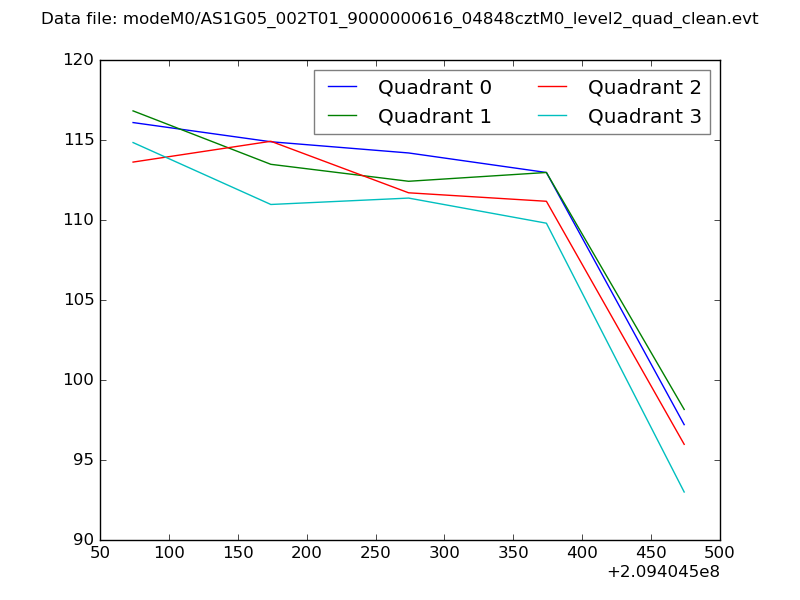
| Quadrant-wise count rates Data is divided into 100 sec bins |
 |
|
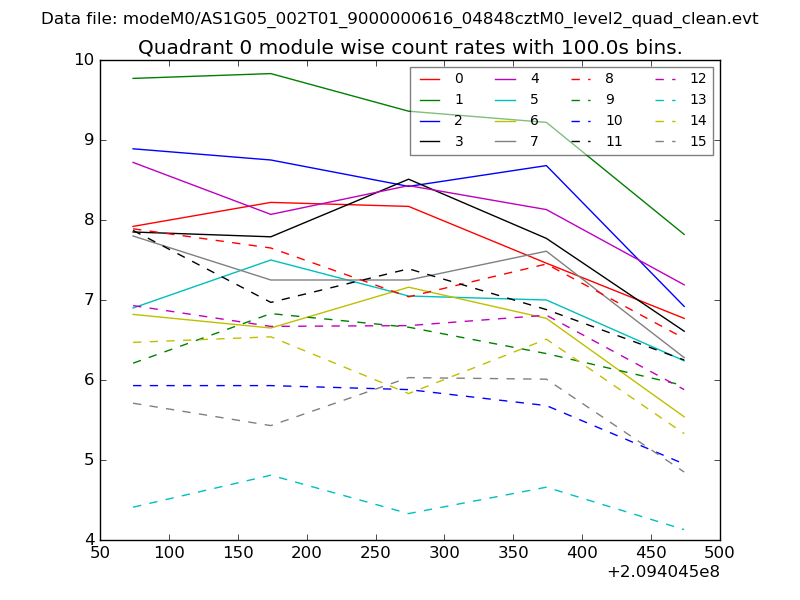
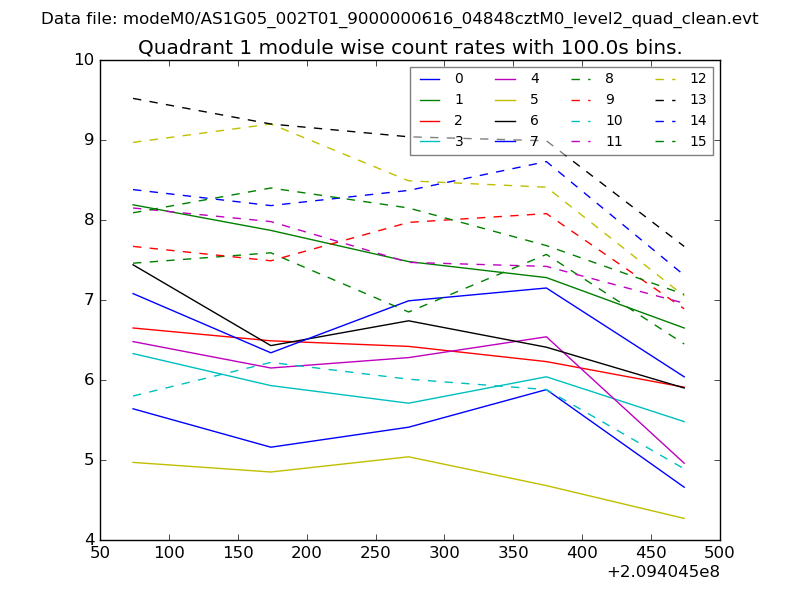
| Module-wise count rates for Quadrant A Data is divided into 100 sec bins |
 |
 |
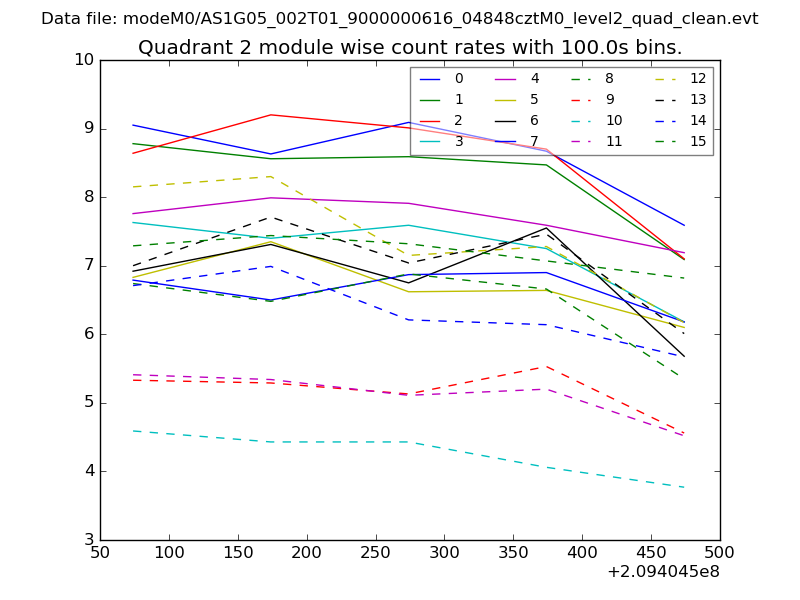
| Module-wise count rates for Quadrant B Data is divided into 100 sec bins |
 |
 |
| Module-wise count rates for Quadrant C Data is divided into 100 sec bins |
 |
 |
| Module-wise count rates for Quadrant D Data is divided into 100 sec bins |
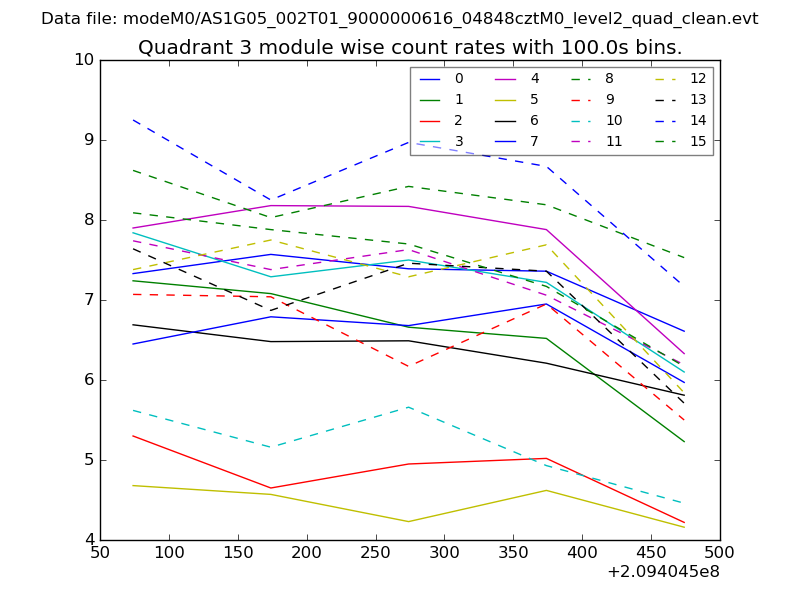 |
 |
| Parameter | Plot |
|---|---|
| CZT HV Monitor | 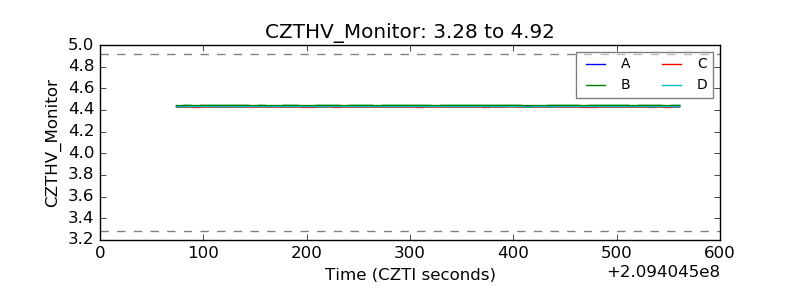 |
| D_VDD | 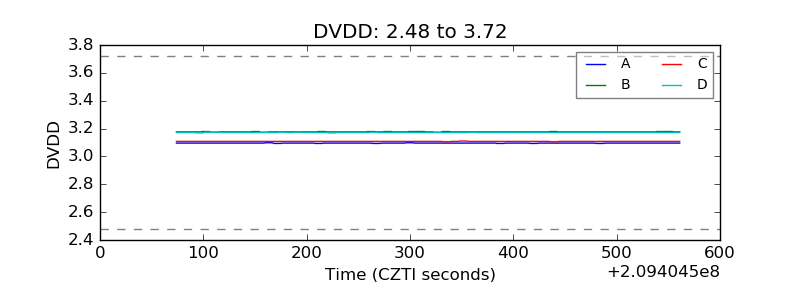 |
| Temperature 1 | 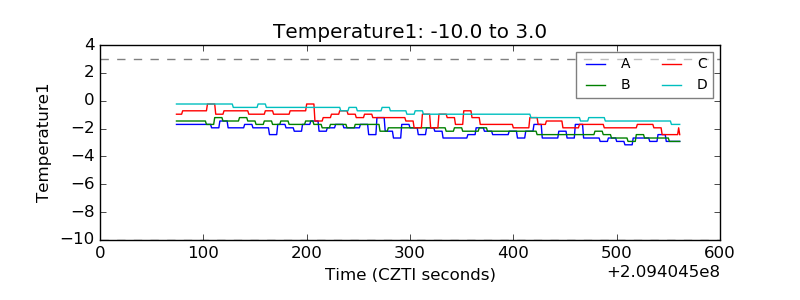 |
| Veto HV Monitor | 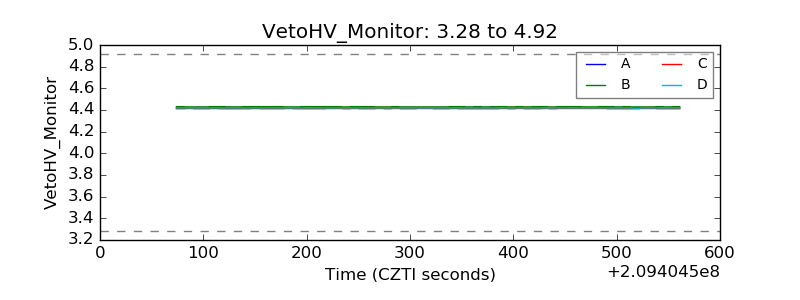 |
| Veto LLD | 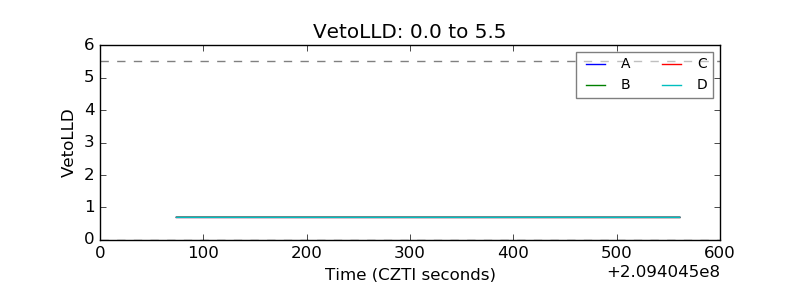 |
| Alpha Counter | 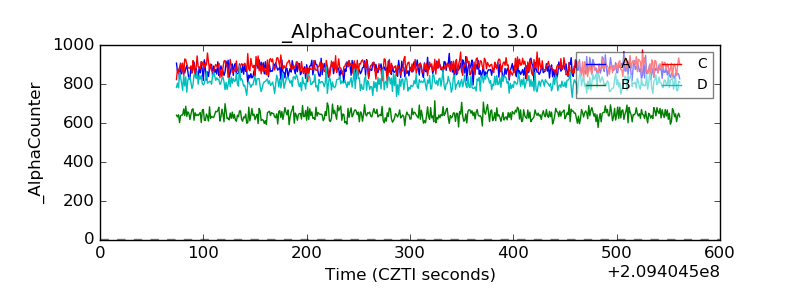 |
| _CPM_Rate | 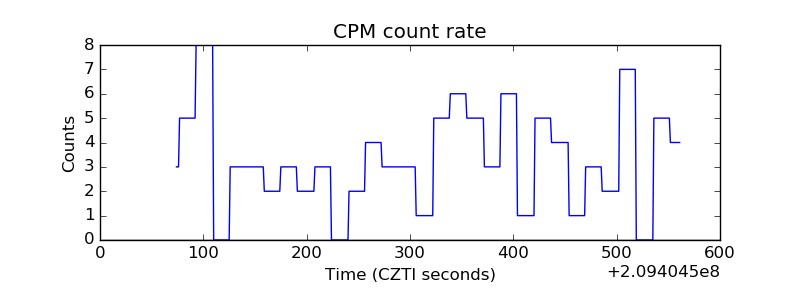 |
| CZT Counter | 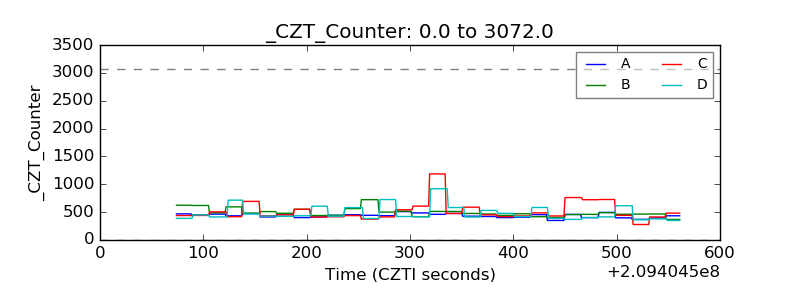 |
| +2.5 Volts monitor |  |
| +5 Volts monitor | 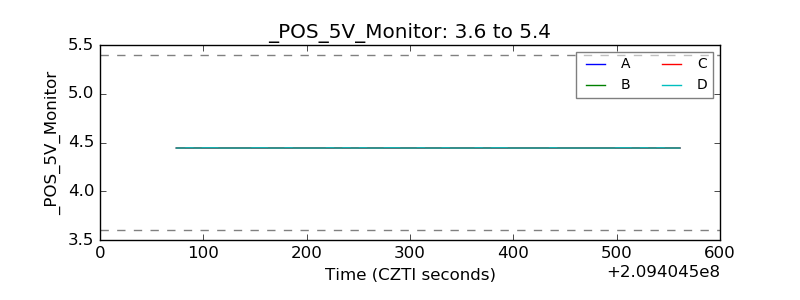 |
| _ROLL_ROT | 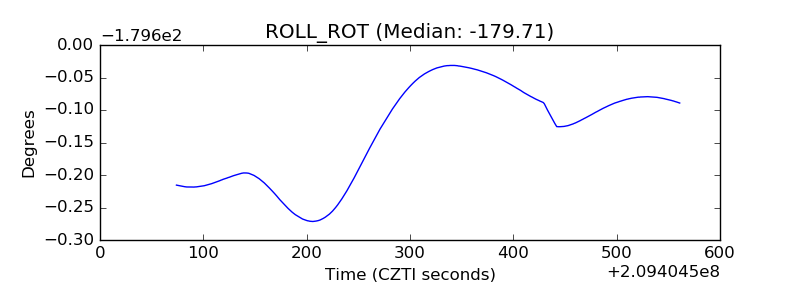 |
| _Roll_DEC | 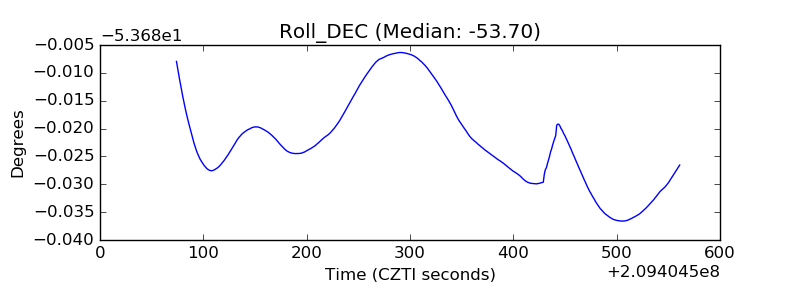 |
| _Roll_RA | 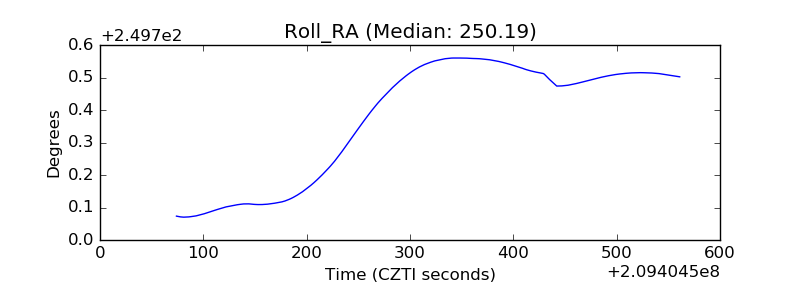 |
| Veto Counter | 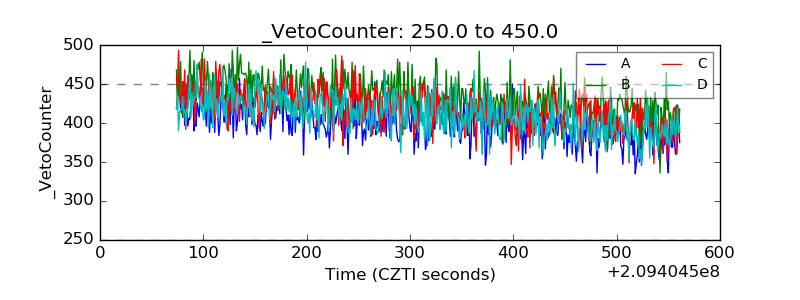 |