| Param | Original file | Final file |
|---|---|---|
| Filename | modeM0/AS1G05_002T01_9000000616_04849cztM0_level2.evt | modeM0/AS1G05_002T01_9000000616_04849cztM0_level2_quad_clean.evt |
| Size (bytes) | 365,016,960 | 66,913,920 |
| Size | 348.1 MB | 63.8 MB |
| Events in quadrant A | 2,620,450 | 417,871 |
| Events in quadrant B | 2,610,054 | 416,108 |
| Events in quadrant C | 2,596,154 | 414,205 |
| Events in quadrant D | 2,857,438 | 397,067 |
| Mode SS | |||
|---|---|---|---|
| Quadrant | BADHDUFLAG | Total packets | Discarded packets |
| A | 0 | 112 | 0 |
| B | 0 | 112 | 0 |
| C | 0 | 112 | 0 |
| D | 0 | 112 | 0 |
| Mode M0 | |||
|---|---|---|---|
| Quadrant | BADHDUFLAG | Total packets | Discarded packets |
| A | 0 | 11619 | 2 |
| B | 0 | 11471 | 1 |
| C | 0 | 11706 | 1 |
| D | 0 | 12442 | 1 |
| Mode M9 | |||
|---|---|---|---|
| Quadrant | BADHDUFLAG | Total packets | Discarded packets |
| A | 0 | 12 | 0 |
| B | 0 | 12 | 0 |
| C | 0 | 12 | 0 |
| D | 0 | 12 | 0 |
| Quadrant | Total seconds | Saturated seconds | Saturation percentage |
|---|---|---|---|
| A | 5435 | 78 | 1.435143% |
| B | 5435 | 54 | 0.993560% |
| C | 5435 | 51 | 0.938362% |
| D | 5435 | 107 | 1.968721% |
Noise dominated data is calculated using 1-second bins in cleaned event files. If a bin has >2000 counts, and if more than 50% of those come from <1% of pixels, then it is considered to be noise-dominated and hence unusable.
| Quadrant | # 1 sec bins | Bins with >0 counts | Bins with >2000 counts | High rate bins dominated by noise | Noise dominated (total time) | Noise dominated (detector-on time) | Marked lightcurve |
|---|---|---|---|---|---|---|---|
| A | 6685 | 5436 | 15 | 15 | 0.22% | 0.28% | 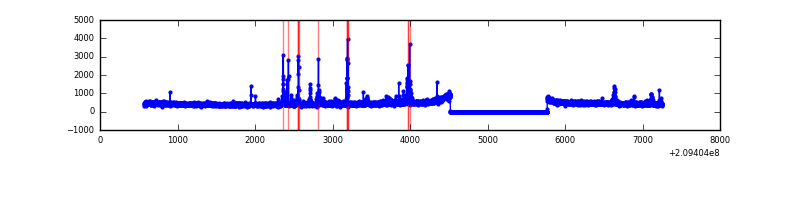 |
| B | 6685 | 5436 | 1 | 1 | 0.01% | 0.02% | 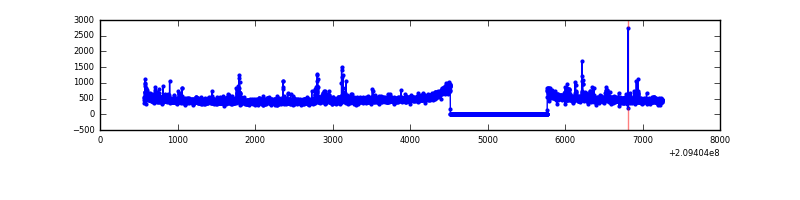 |
| C | 6685 | 5436 | 18 | 18 | 0.27% | 0.33% | 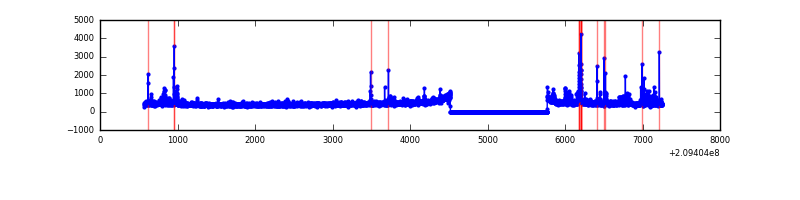 |
| D | 6685 | 5436 | 63 | 63 | 0.94% | 1.16% | 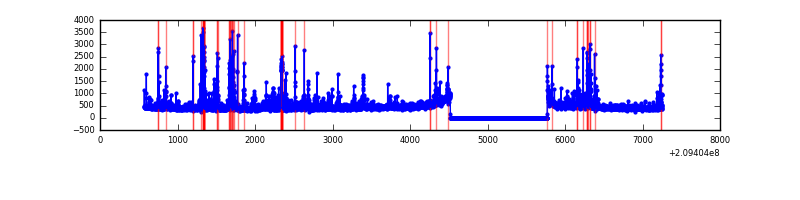 |
Top three noisy pixels from each quadrant. If the there are fewer than three noisy pixels in the level2.evt file, extra rows are filled as -1
| Pixel properties | Quadrant properties | ||||||
|---|---|---|---|---|---|---|---|
| Quadrant | DetID | PixID | Counts | Sigma | Mean | Median | Sigma |
| A | 0 | 50 | 177960 | 1390.29 | 629 | 617 | 127.6 |
| A | 8 | 15 | 9274 | 67.87 | 629 | 617 | 127.6 |
| A | 13 | 251 | 8390 | 60.94 | 629 | 617 | 127.6 |
| B | 14 | 167 | 74897 | 610.47 | 634 | 621 | 121.7 |
| B | 10 | 246 | 41483 | 335.84 | 634 | 621 | 121.7 |
| B | 4 | 80 | 16271 | 128.63 | 634 | 621 | 121.7 |
| C | 9 | 247 | 235013 | 1685.89 | 602 | 604 | 139.0 |
| C | 13 | 61 | 5062 | 32.06 | 602 | 604 | 139.0 |
| C | 14 | 67 | 4271 | 26.37 | 602 | 604 | 139.0 |
| D | 13 | 235 | 246485 | 1676.39 | 600 | 581 | 146.7 |
| D | 2 | 136 | 127392 | 864.5 | 600 | 581 | 146.7 |
| D | 2 | 234 | 54844 | 369.93 | 600 | 581 | 146.7 |
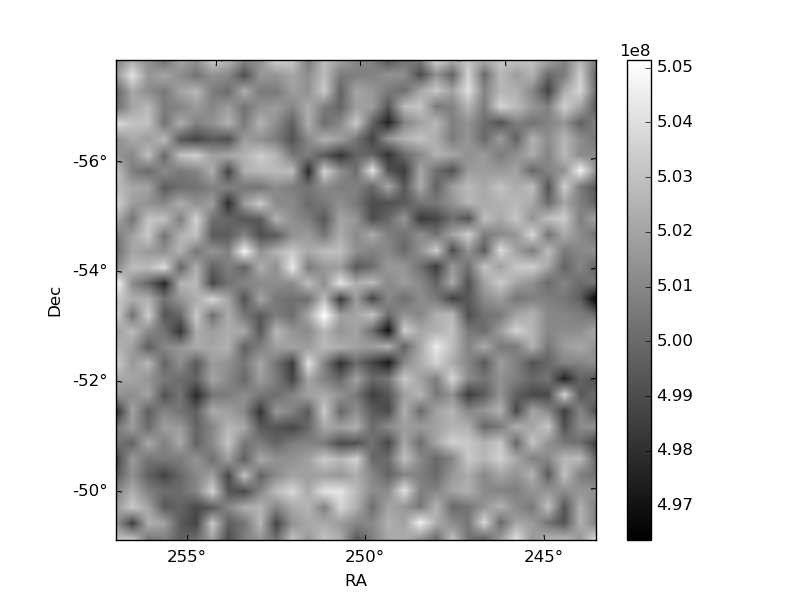
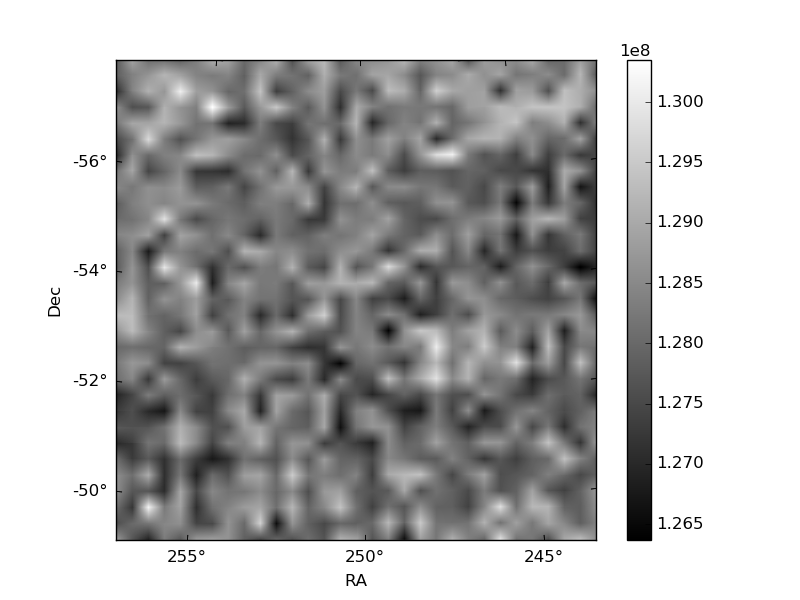
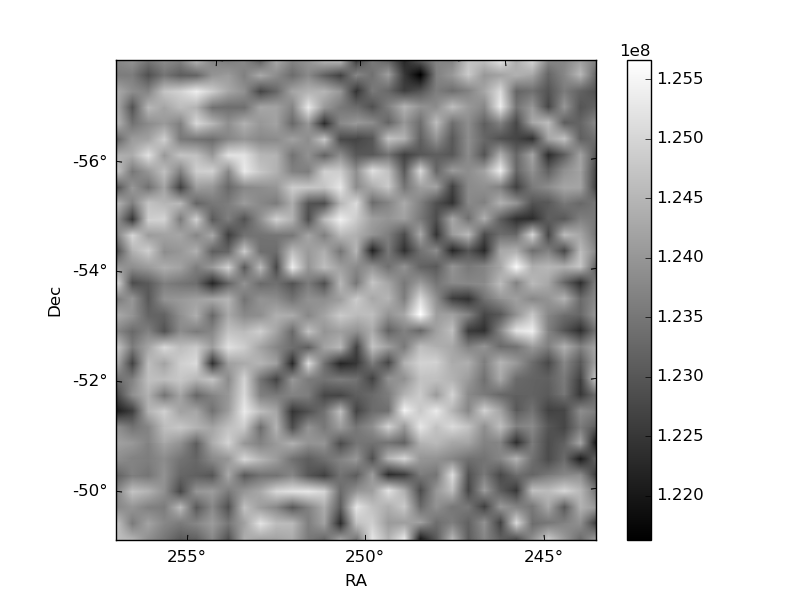
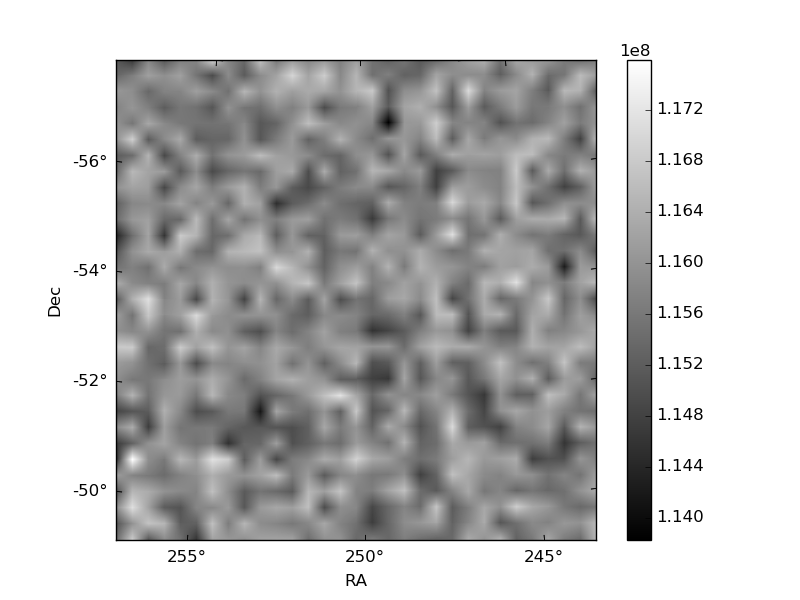
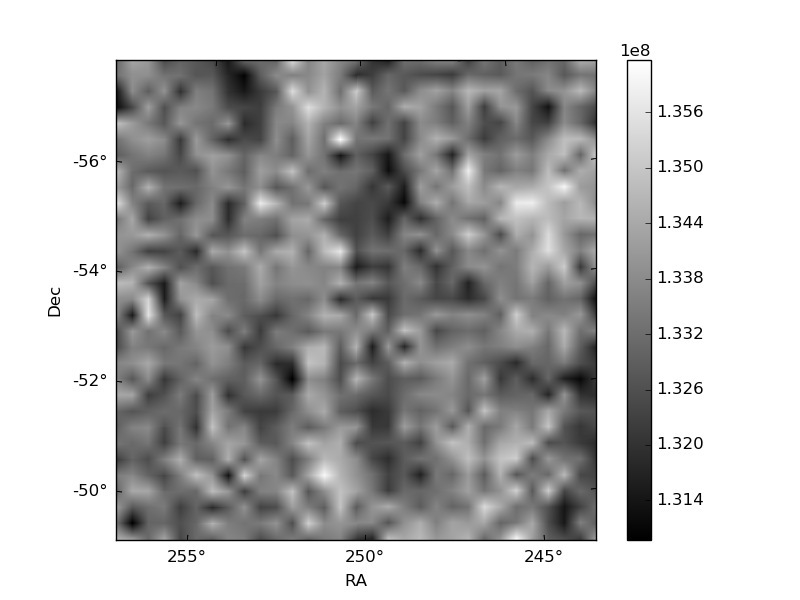
Histogram calculated using DETX and DETY for each event in the final _common_clean file
| Quadrant A | 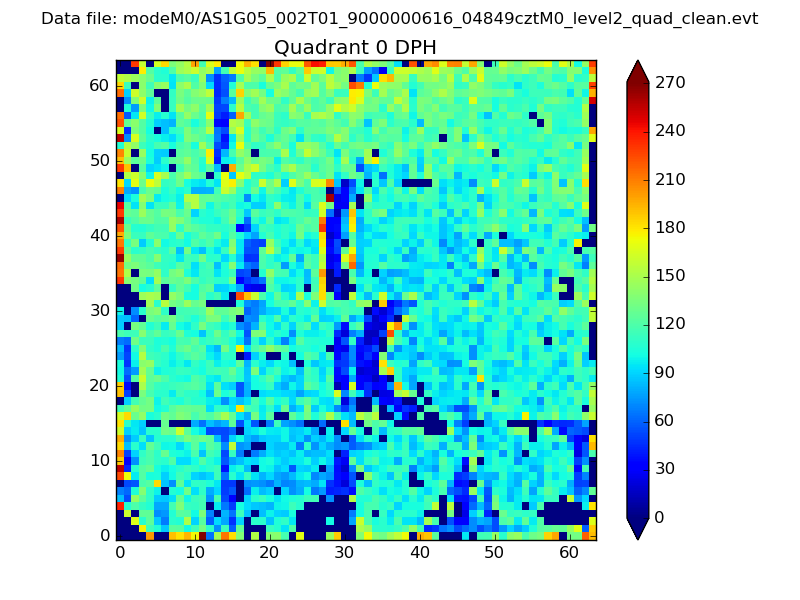 |
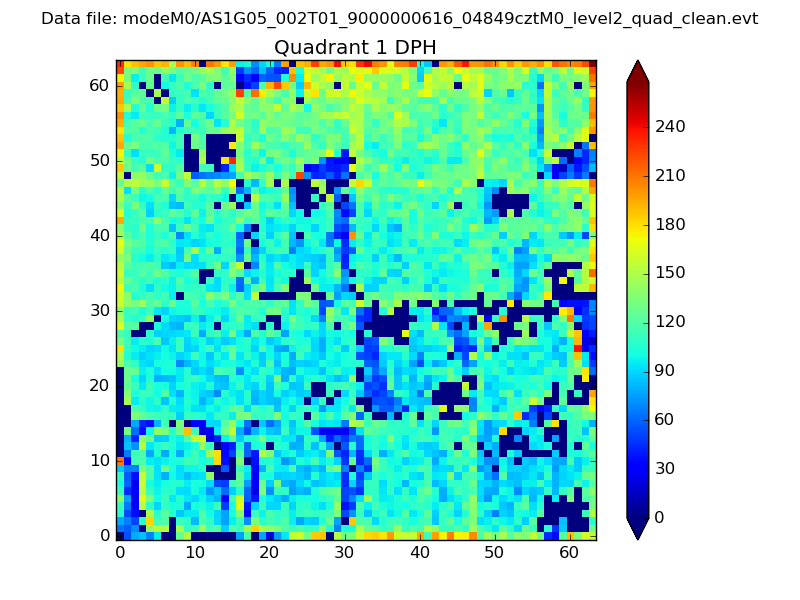 |
Quadrant B |
|---|---|---|---|
| Quadrant D | 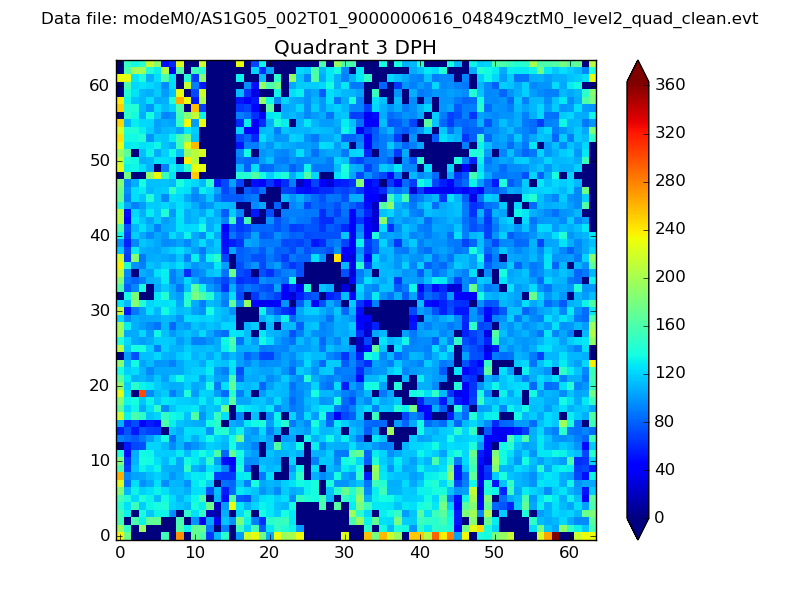 |
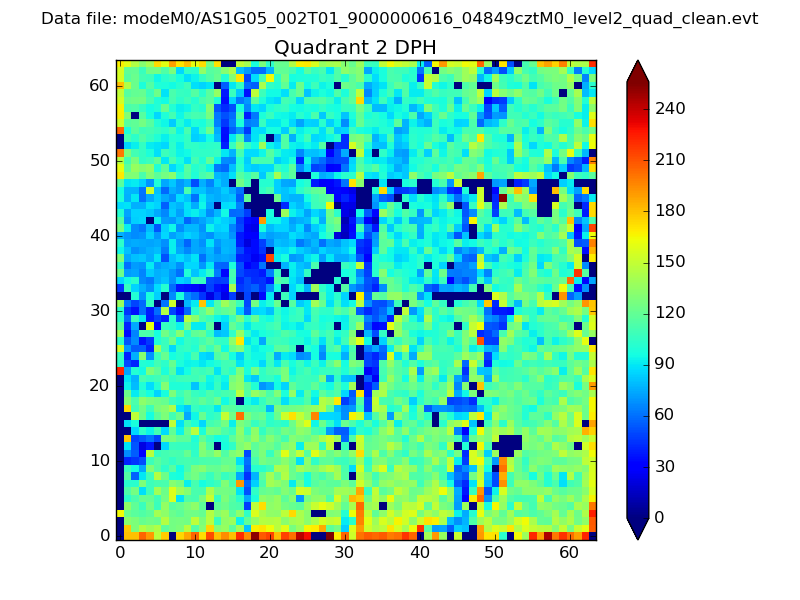 |
Quadrant C |
| Plot type | Count rate plots | Images |
|---|---|---|
| Comparison with Poisson distribution Blue bars denote a histogram of data divided into 1 sec bins. Red curve is a Poisson curve with rate = median count rate of data. |
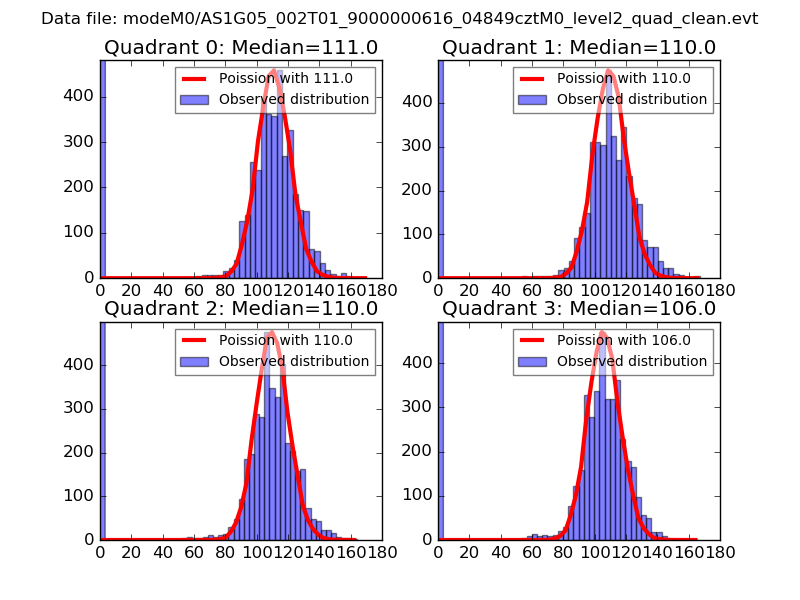 |
 |
| Quadrant-wise count rates Data is divided into 100 sec bins |
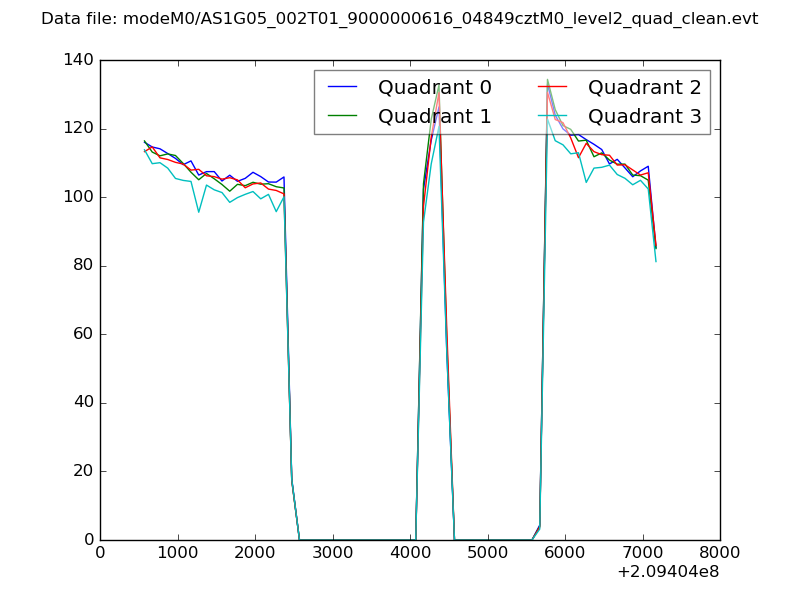 |
|
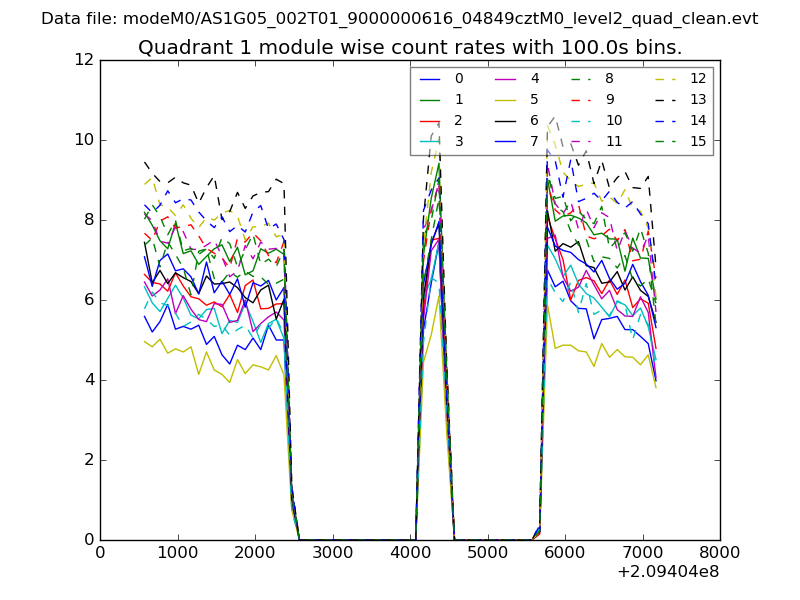
| Module-wise count rates for Quadrant A Data is divided into 100 sec bins |
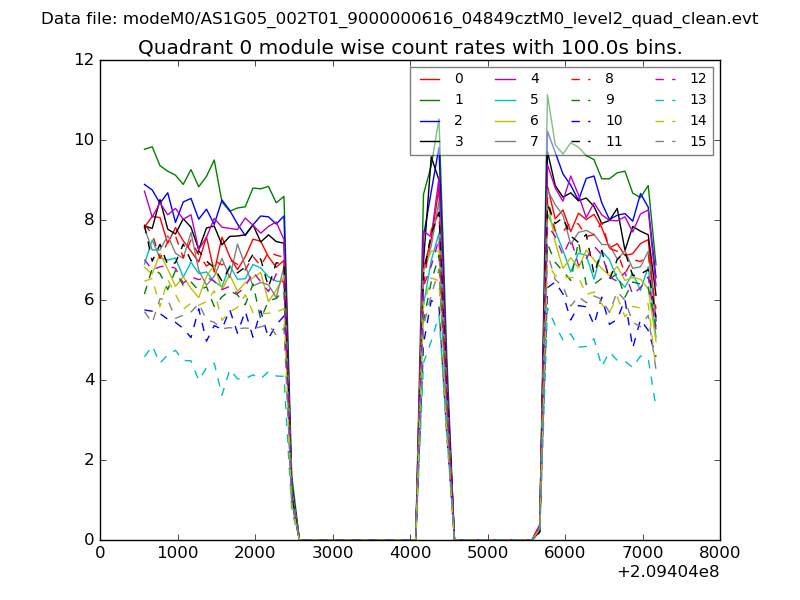 |
 |
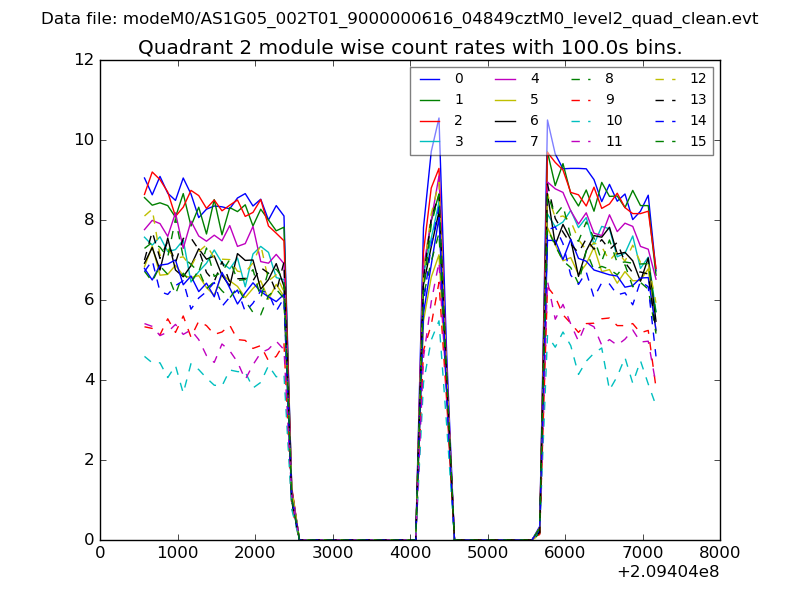
| Module-wise count rates for Quadrant B Data is divided into 100 sec bins |
 |
 |
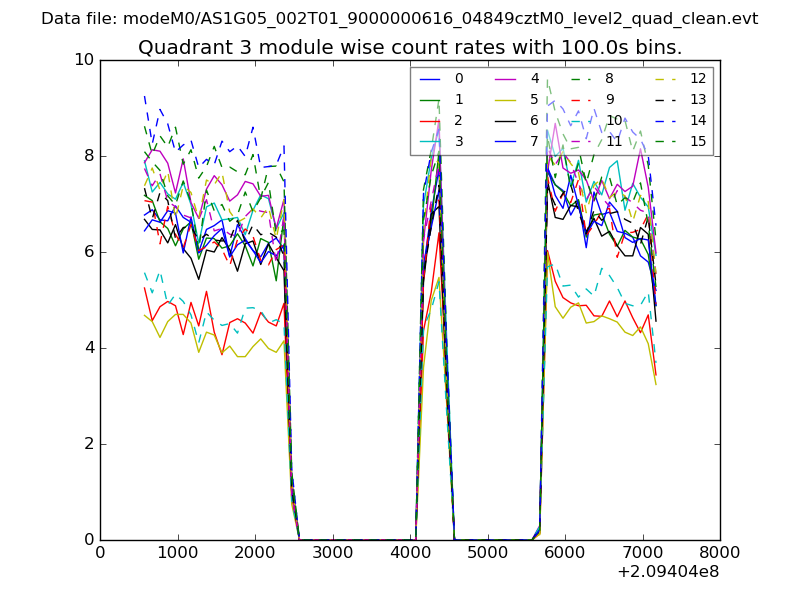
| Module-wise count rates for Quadrant C Data is divided into 100 sec bins |
 |
 |
| Module-wise count rates for Quadrant D Data is divided into 100 sec bins |
 |
 |
| Parameter | Plot |
|---|---|
| CZT HV Monitor | 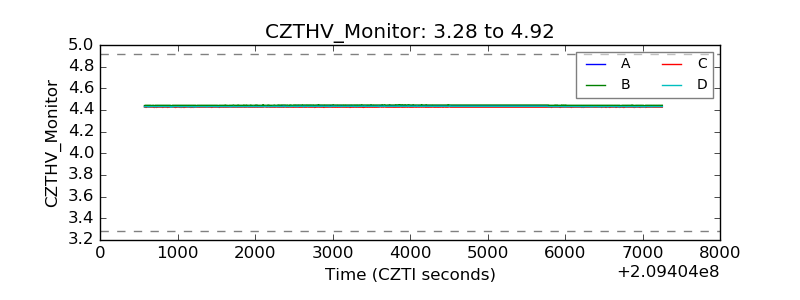 |
| D_VDD | 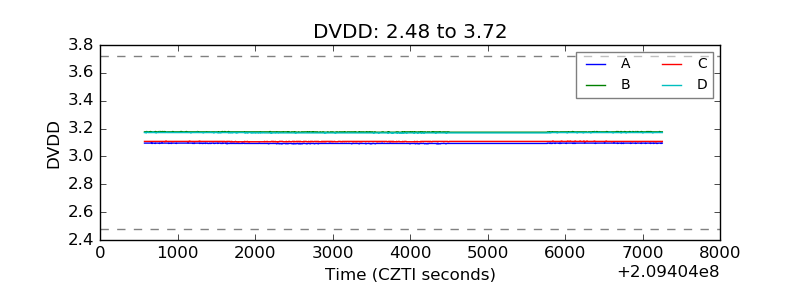 |
| Temperature 1 | 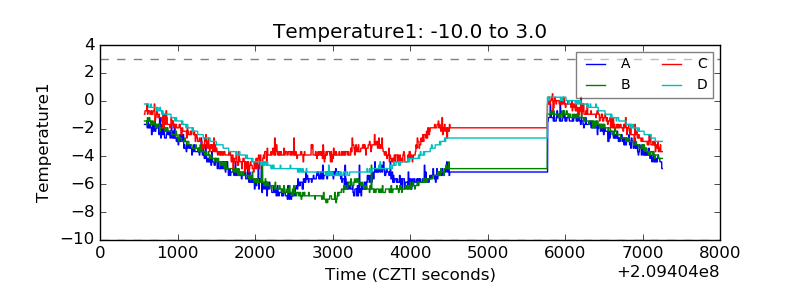 |
| Veto HV Monitor | 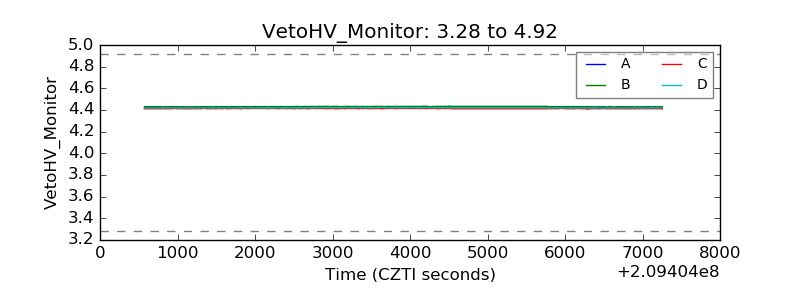 |
| Veto LLD | 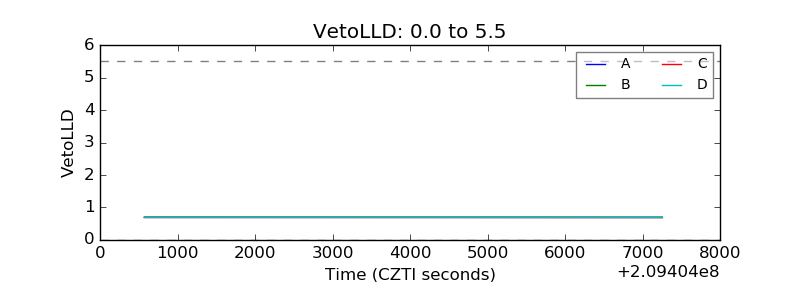 |
| Alpha Counter | 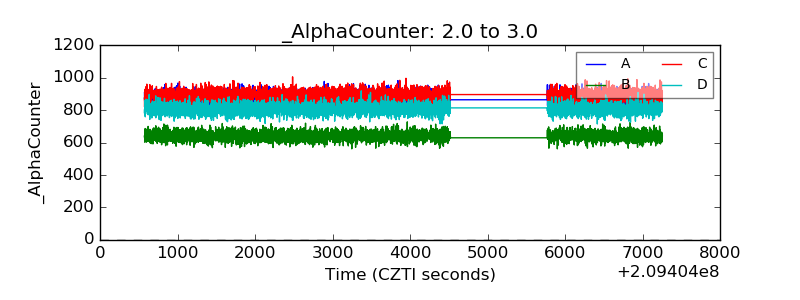 |
| _CPM_Rate | 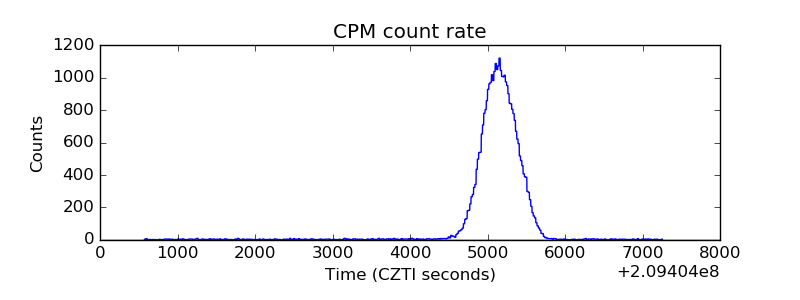 |
| CZT Counter | 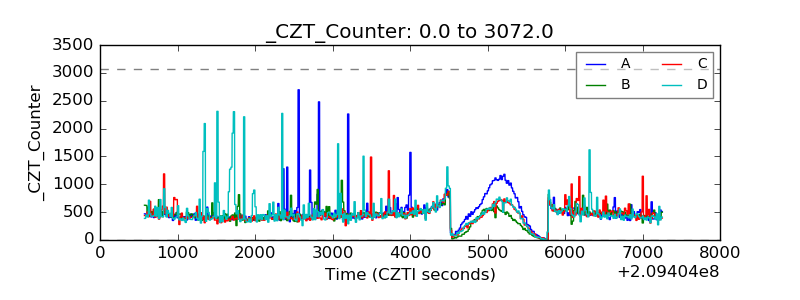 |
| +2.5 Volts monitor | 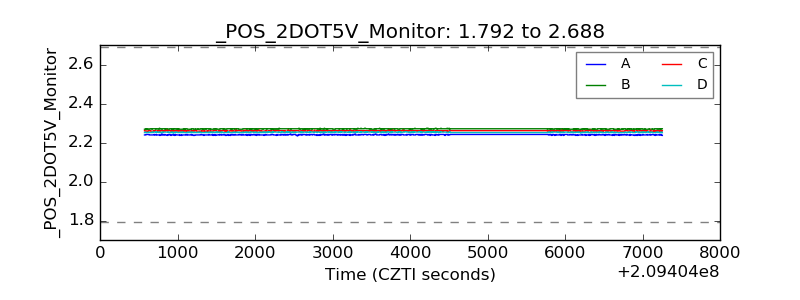 |
| +5 Volts monitor |  |
| _ROLL_ROT |  |
| _Roll_DEC | 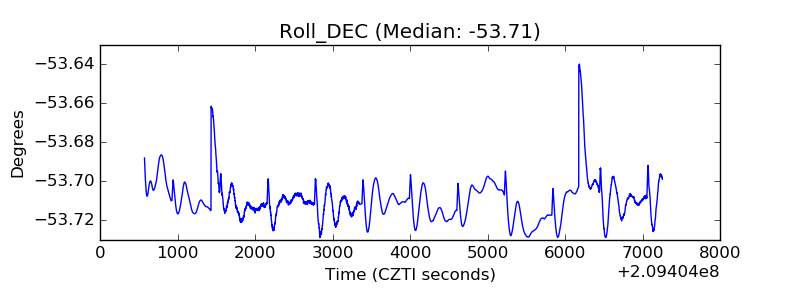 |
| _Roll_RA | 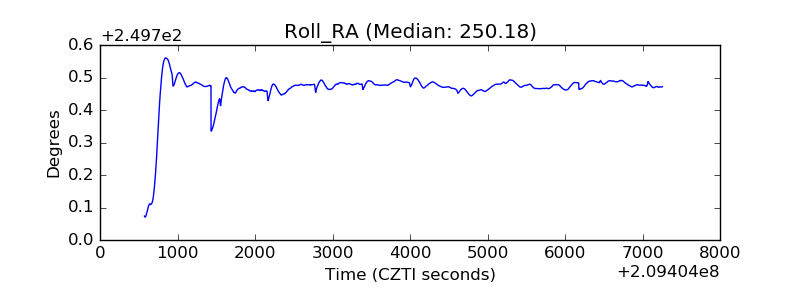 |
| Veto Counter | 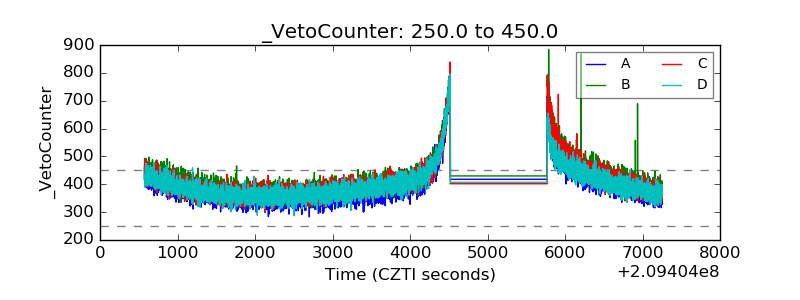 |