| Param | Original file | Final file |
|---|---|---|
| Filename | modeM0/AS1G05_002T01_9000000616_04850cztM0_level2.evt | modeM0/AS1G05_002T01_9000000616_04850cztM0_level2_quad_clean.evt |
| Size (bytes) | 432,806,400 | 82,958,400 |
| Size | 412.8 MB | 79.1 MB |
| Events in quadrant A | 2,987,367 | 522,845 |
| Events in quadrant B | 3,080,439 | 520,833 |
| Events in quadrant C | 3,070,227 | 520,062 |
| Events in quadrant D | 3,529,263 | 496,764 |
| Mode SS | |||
|---|---|---|---|
| Quadrant | BADHDUFLAG | Total packets | Discarded packets |
| A | 0 | 132 | 0 |
| B | 0 | 132 | 0 |
| C | 0 | 132 | 0 |
| D | 0 | 132 | 0 |
| Mode M0 | |||
|---|---|---|---|
| Quadrant | BADHDUFLAG | Total packets | Discarded packets |
| A | 0 | 13449 | 3 |
| B | 0 | 13652 | 2 |
| C | 0 | 13869 | 2 |
| D | 0 | 15181 | 2 |
| Mode M9 | |||
|---|---|---|---|
| Quadrant | BADHDUFLAG | Total packets | Discarded packets |
| A | 0 | 20 | 0 |
| B | 0 | 20 | 0 |
| C | 0 | 20 | 0 |
| D | 0 | 21 | 0 |
| Quadrant | Total seconds | Saturated seconds | Saturation percentage |
|---|---|---|---|
| A | 6473 | 22 | 0.339873% |
| B | 6473 | 35 | 0.540708% |
| C | 6473 | 26 | 0.401668% |
| D | 6473 | 107 | 1.653020% |
Noise dominated data is calculated using 1-second bins in cleaned event files. If a bin has >2000 counts, and if more than 50% of those come from <1% of pixels, then it is considered to be noise-dominated and hence unusable.
| Quadrant | # 1 sec bins | Bins with >0 counts | Bins with >2000 counts | High rate bins dominated by noise | Noise dominated (total time) | Noise dominated (detector-on time) | Marked lightcurve |
|---|---|---|---|---|---|---|---|
| A | 7648 | 6474 | 1 | 1 | 0.01% | 0.02% | 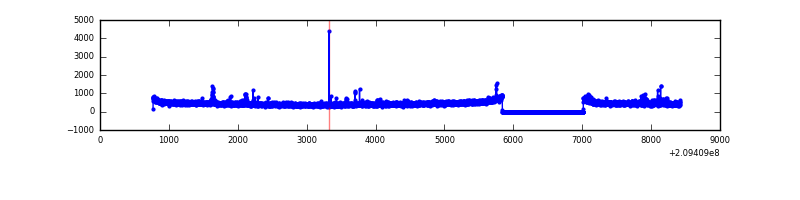 |
| B | 7648 | 6474 | 2 | 2 | 0.03% | 0.03% | 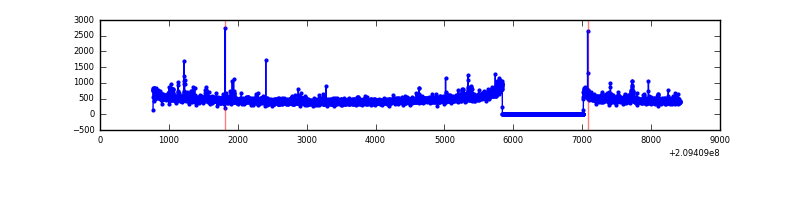 |
| C | 7648 | 6474 | 18 | 18 | 0.24% | 0.28% | 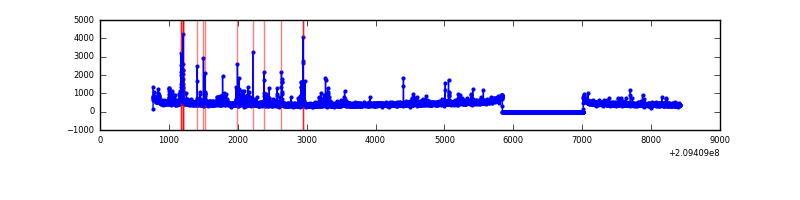 |
| D | 7648 | 6474 | 69 | 69 | 0.90% | 1.07% | 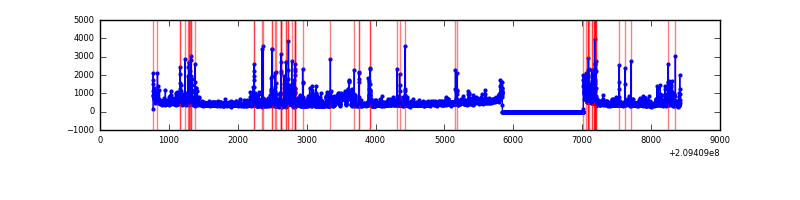 |
Top three noisy pixels from each quadrant. If the there are fewer than three noisy pixels in the level2.evt file, extra rows are filled as -1
| Pixel properties | Quadrant properties | ||||||
|---|---|---|---|---|---|---|---|
| Quadrant | DetID | PixID | Counts | Sigma | Mean | Median | Sigma |
| A | 8 | 6 | 42894 | 280.52 | 742 | 726 | 150.3 |
| A | 0 | 50 | 31233 | 202.94 | 742 | 726 | 150.3 |
| A | 8 | 15 | 27392 | 177.39 | 742 | 726 | 150.3 |
| B | 14 | 167 | 103433 | 722.86 | 750 | 734 | 142.1 |
| B | 10 | 16 | 20489 | 139.05 | 750 | 734 | 142.1 |
| B | 4 | 239 | 13626 | 90.74 | 750 | 734 | 142.1 |
| C | 9 | 247 | 271224 | 1648.14 | 711 | 715 | 164.1 |
| C | 12 | 4 | 12727 | 73.19 | 711 | 715 | 164.1 |
| C | 13 | 61 | 5799 | 30.98 | 711 | 715 | 164.1 |
| D | 13 | 235 | 211428 | 1220.01 | 708 | 685 | 172.7 |
| D | 2 | 136 | 179200 | 1033.44 | 708 | 685 | 172.7 |
| D | 10 | 172 | 155437 | 895.87 | 708 | 685 | 172.7 |
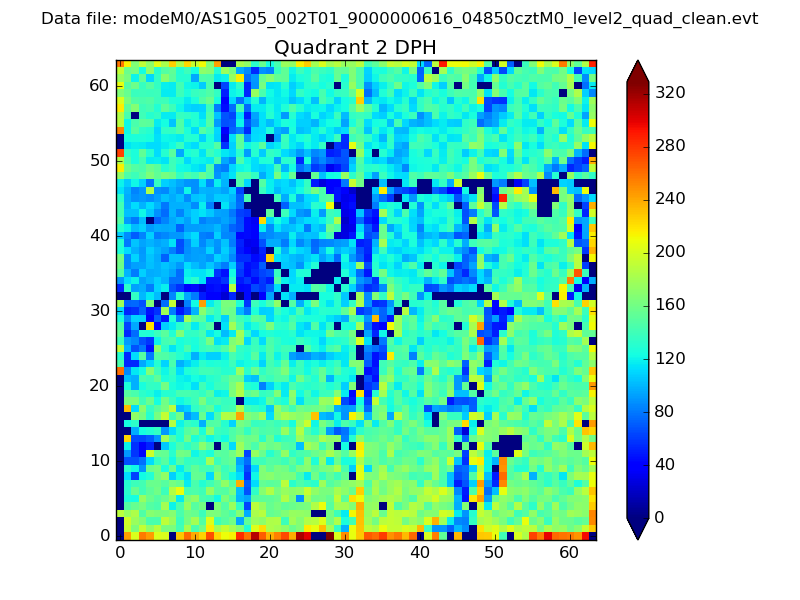
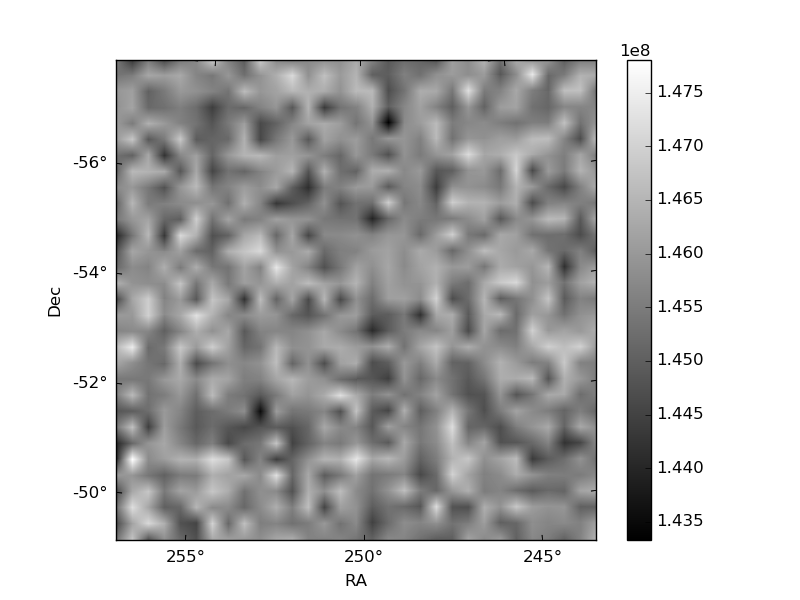
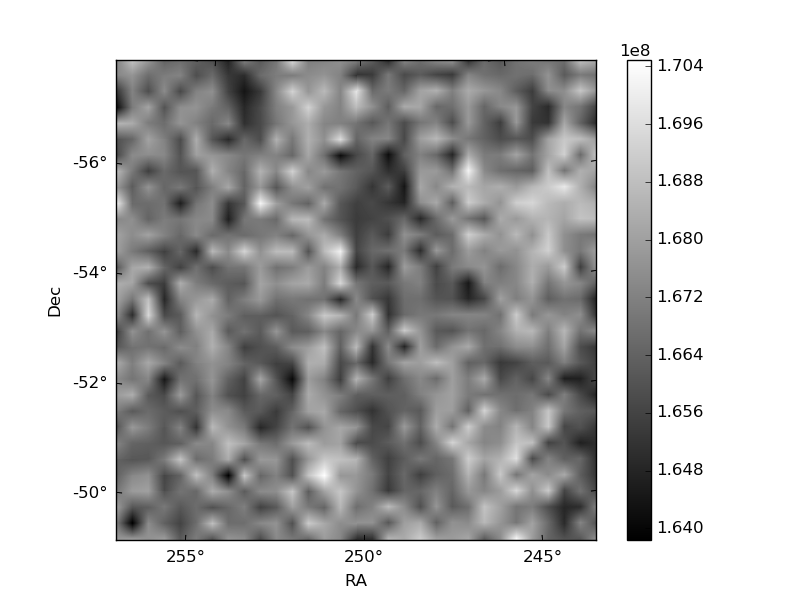
Histogram calculated using DETX and DETY for each event in the final _common_clean file
| Quadrant A | 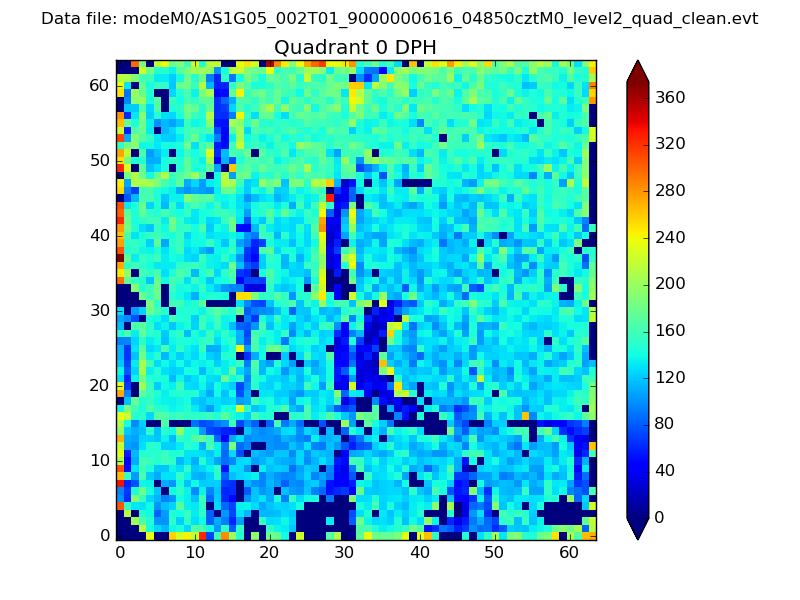 |
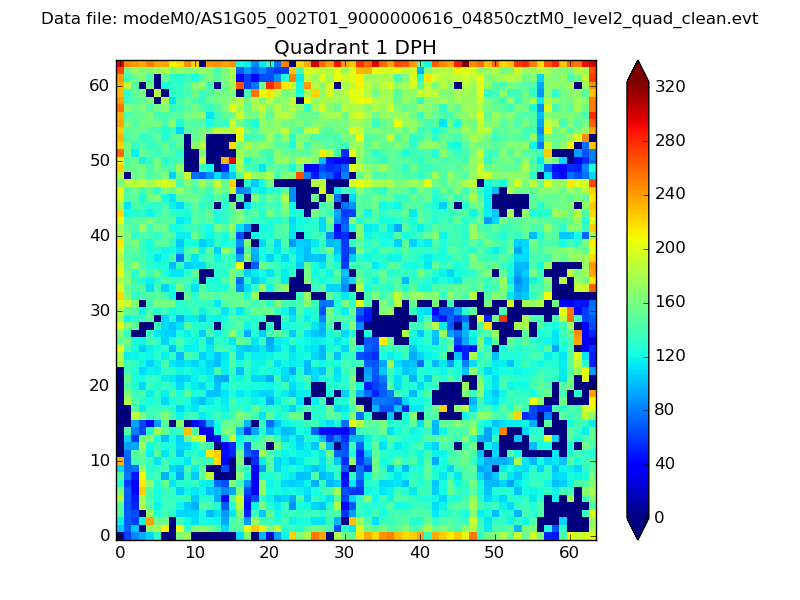 |
Quadrant B |
|---|---|---|---|
| Quadrant D | 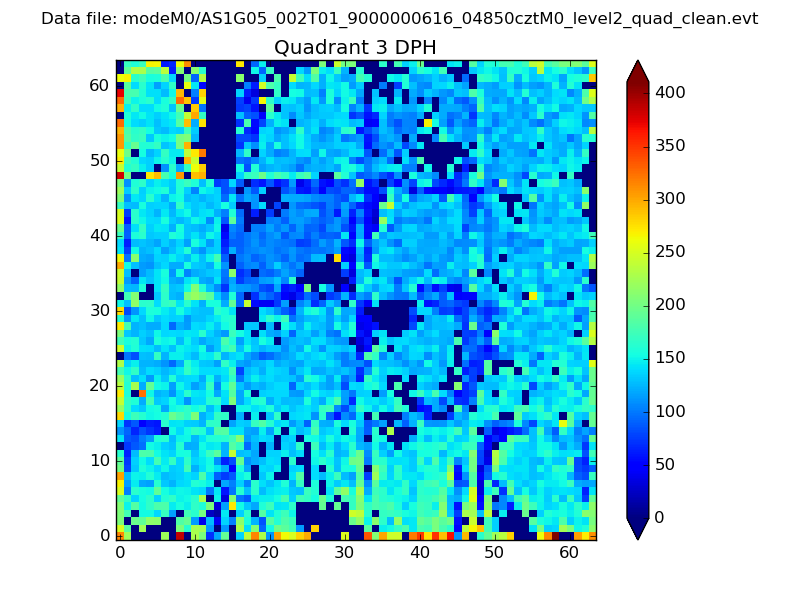 |
 |
Quadrant C |
| Plot type | Count rate plots | Images |
|---|---|---|
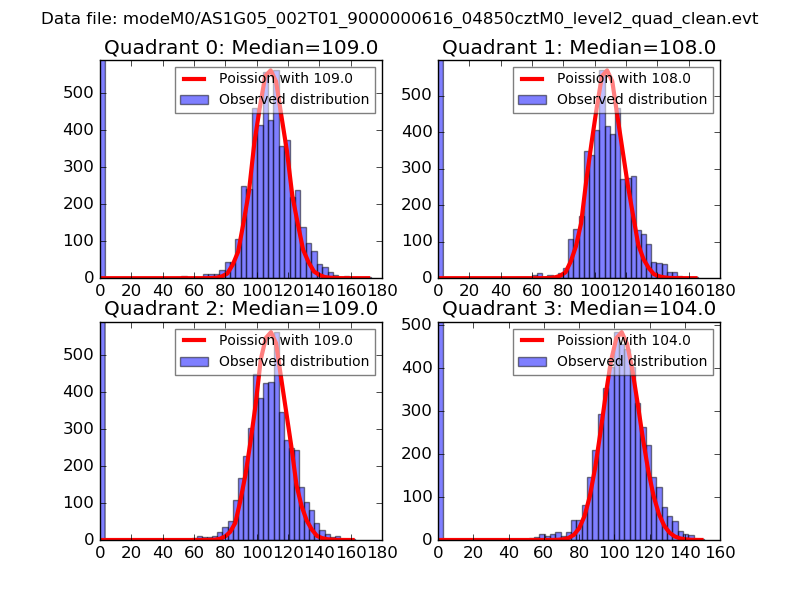
| Comparison with Poisson distribution Blue bars denote a histogram of data divided into 1 sec bins. Red curve is a Poisson curve with rate = median count rate of data. |
 |
 |
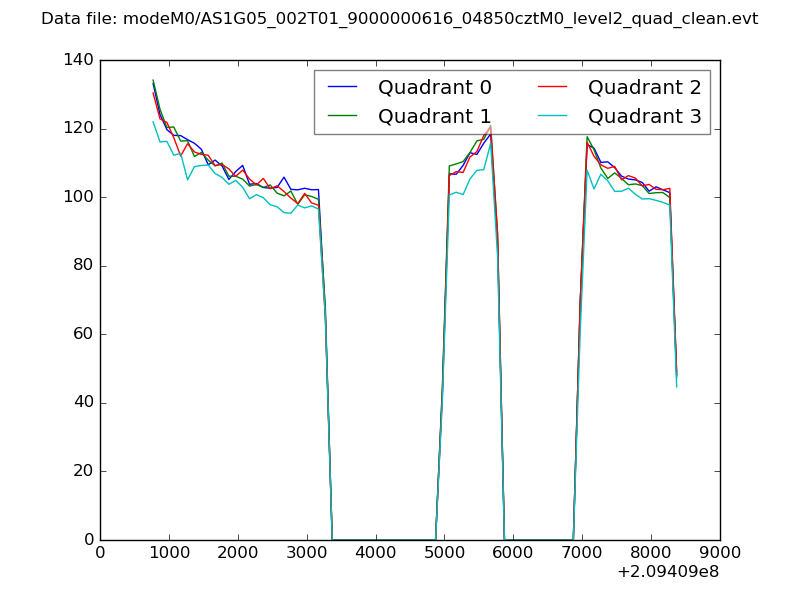
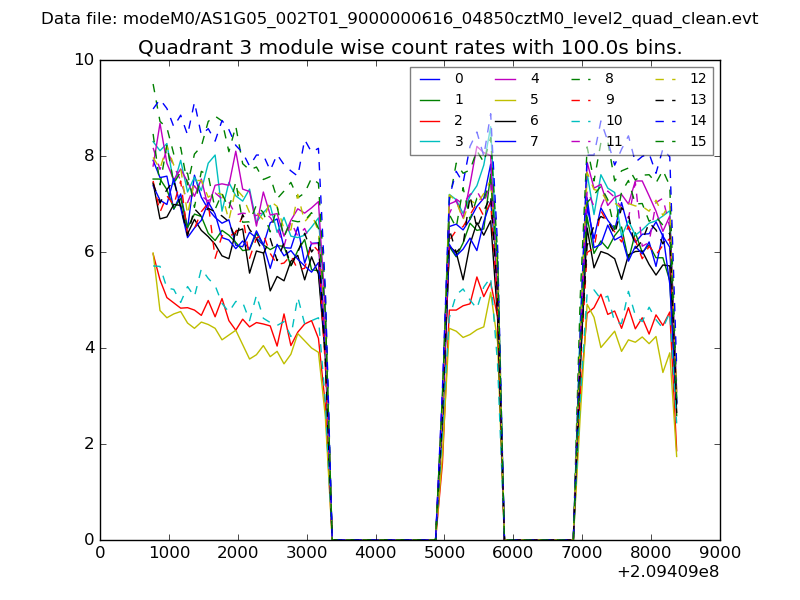
| Quadrant-wise count rates Data is divided into 100 sec bins |
 |
|
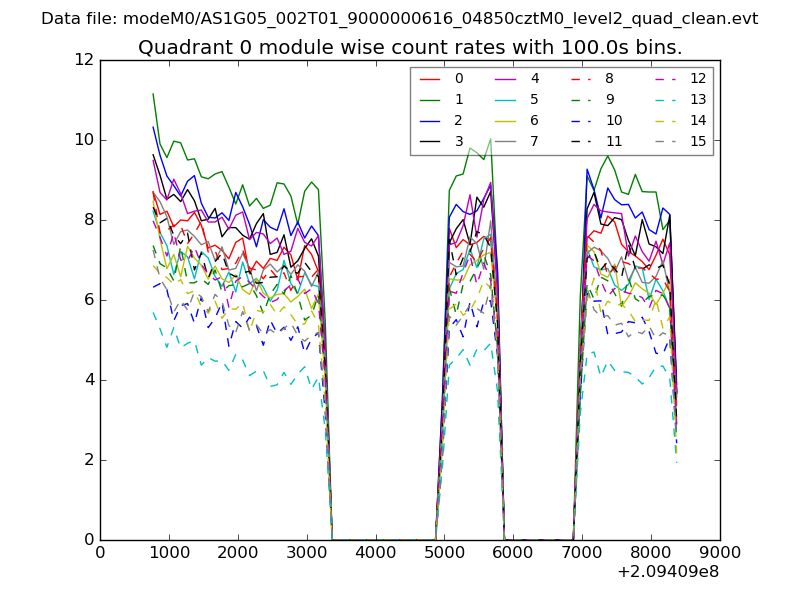
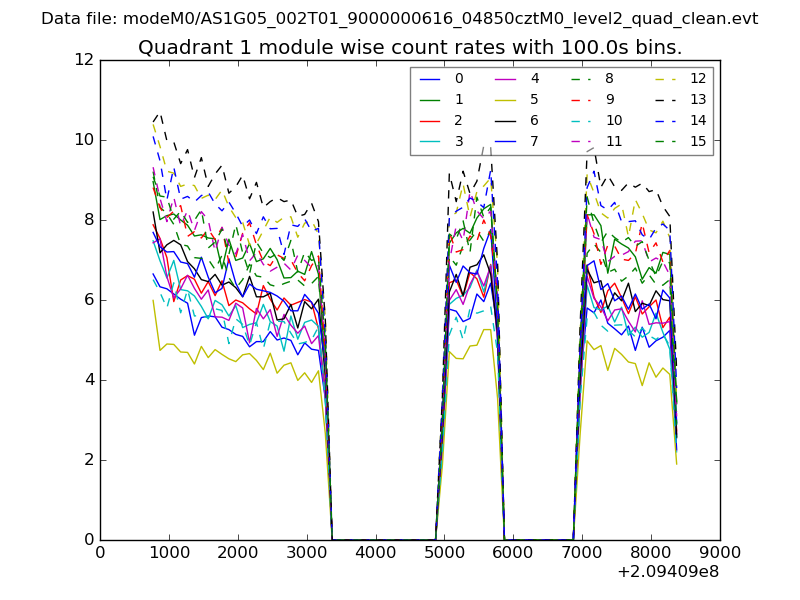
| Module-wise count rates for Quadrant A Data is divided into 100 sec bins |
 |
 |
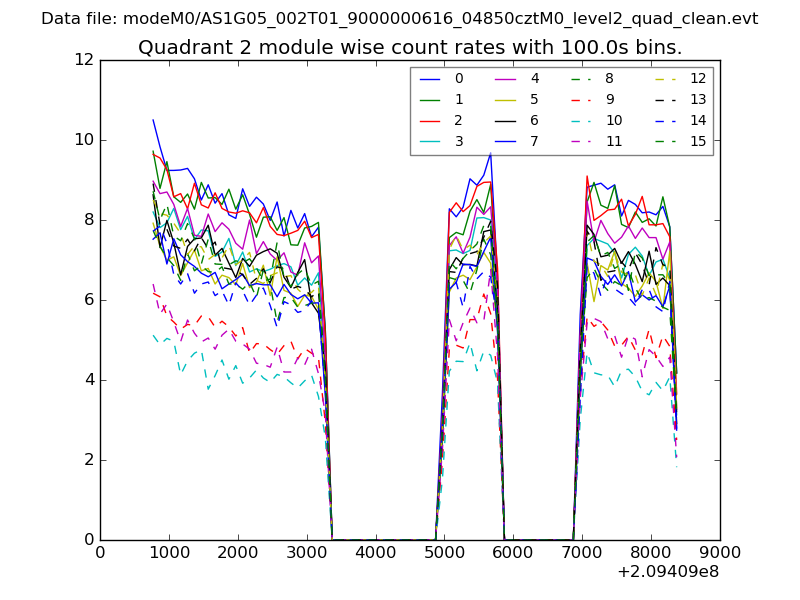
| Module-wise count rates for Quadrant B Data is divided into 100 sec bins |
 |
 |
| Module-wise count rates for Quadrant C Data is divided into 100 sec bins |
 |
 |
| Module-wise count rates for Quadrant D Data is divided into 100 sec bins |
 |
 |
| Parameter | Plot |
|---|---|
| CZT HV Monitor | 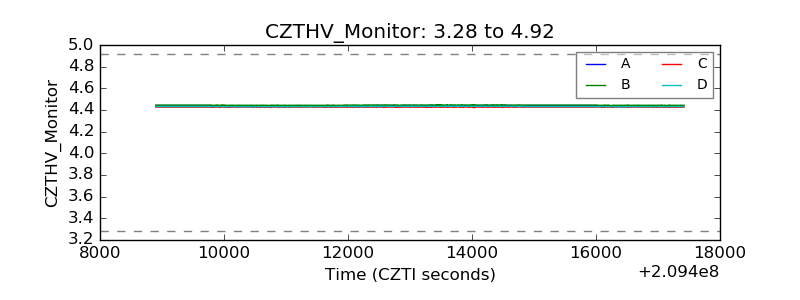 |
| D_VDD | 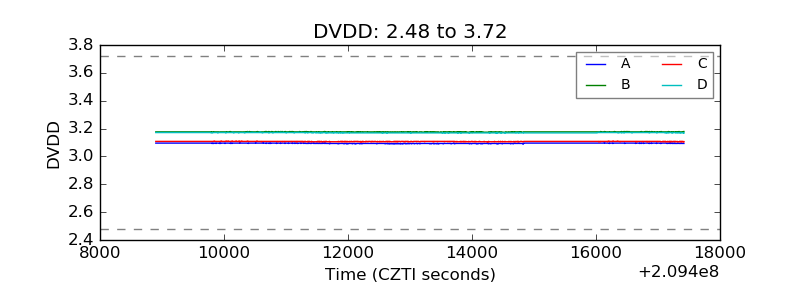 |
| Temperature 1 | 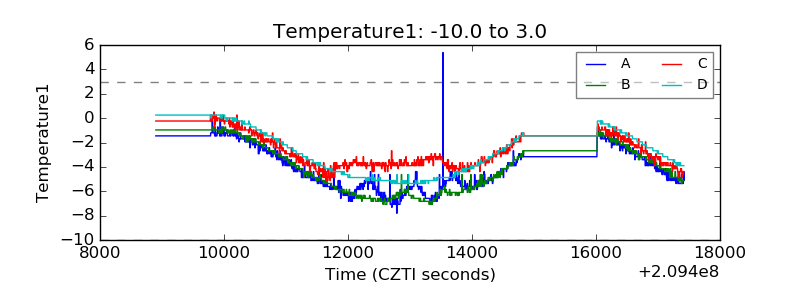 |
| Veto HV Monitor | 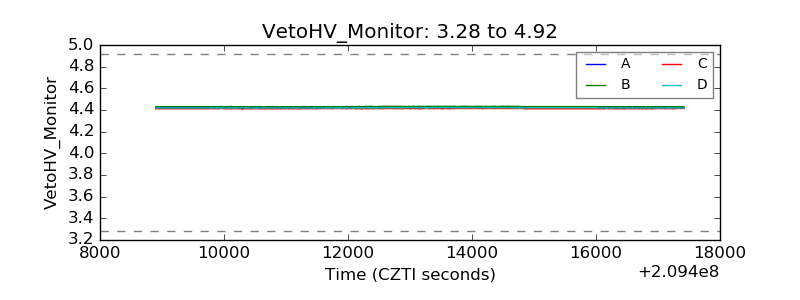 |
| Veto LLD | 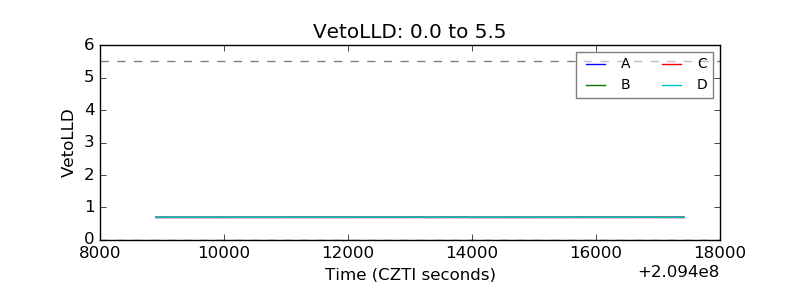 |
| Alpha Counter | 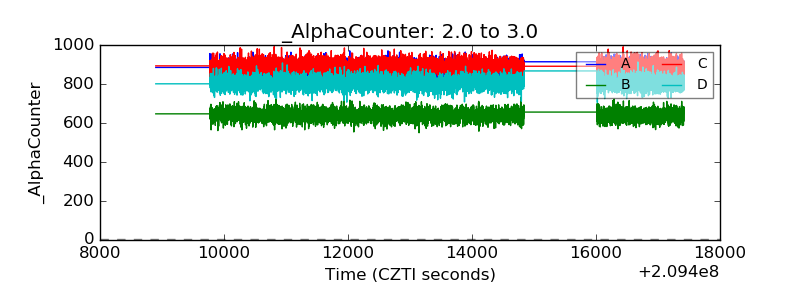 |
| _CPM_Rate | 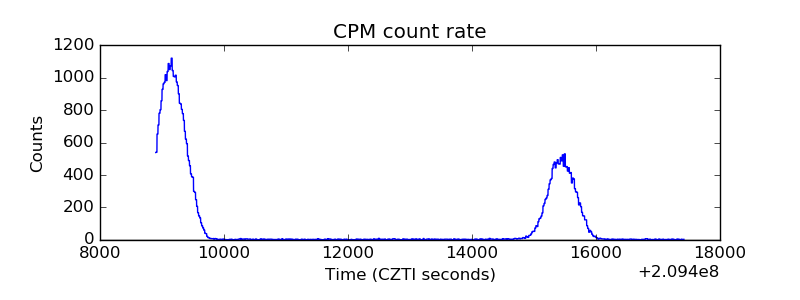 |
| CZT Counter | 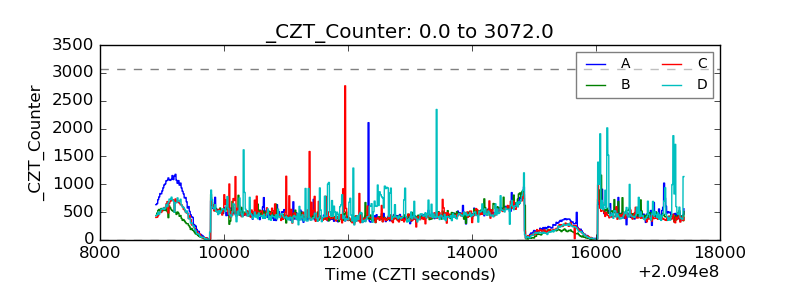 |
| +2.5 Volts monitor |  |
| +5 Volts monitor |  |
| _ROLL_ROT | 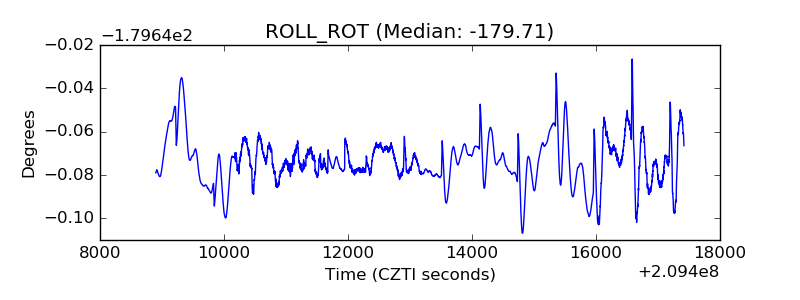 |
| _Roll_DEC | 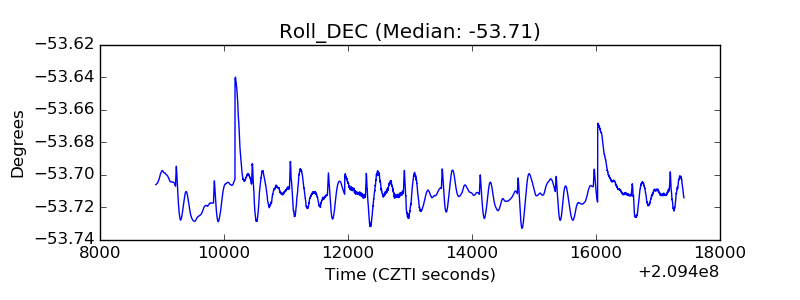 |
| _Roll_RA | 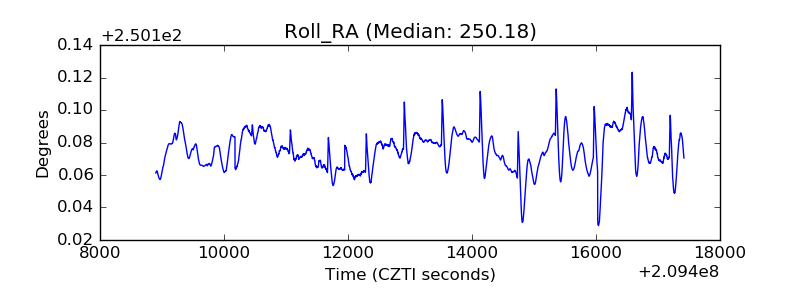 |
| Veto Counter | 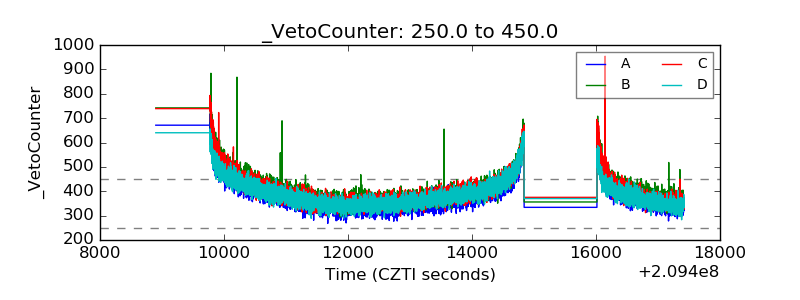 |