| Param | Original file | Final file |
|---|---|---|
| Filename | modeM0/AS1G05_002T01_9000000616_04852cztM0_level2.evt | modeM0/AS1G05_002T01_9000000616_04852cztM0_level2_quad_clean.evt |
| Size (bytes) | 464,048,640 | 89,245,440 |
| Size | 442.6 MB | 85.1 MB |
| Events in quadrant A | 3,500,049 | 554,952 |
| Events in quadrant B | 3,241,811 | 554,755 |
| Events in quadrant C | 3,089,133 | 557,915 |
| Events in quadrant D | 3,736,695 | 537,245 |
| Mode SS | |||
|---|---|---|---|
| Quadrant | BADHDUFLAG | Total packets | Discarded packets |
| A | 0 | 146 | 0 |
| B | 0 | 146 | 0 |
| C | 0 | 146 | 0 |
| D | 0 | 146 | 0 |
| Mode M0 | |||
|---|---|---|---|
| Quadrant | BADHDUFLAG | Total packets | Discarded packets |
| A | 0 | 15538 | 3 |
| B | 0 | 14665 | 2 |
| C | 0 | 14552 | 2 |
| D | 0 | 16433 | 2 |
| Mode M9 | |||
|---|---|---|---|
| Quadrant | BADHDUFLAG | Total packets | Discarded packets |
| A | 0 | 11 | 0 |
| B | 0 | 11 | 0 |
| C | 0 | 11 | 0 |
| D | 0 | 12 | 0 |
| Quadrant | Total seconds | Saturated seconds | Saturation percentage |
|---|---|---|---|
| A | 7145 | 66 | 0.923723% |
| B | 7145 | 23 | 0.321903% |
| C | 7145 | 13 | 0.181945% |
| D | 7145 | 161 | 2.253324% |
Noise dominated data is calculated using 1-second bins in cleaned event files. If a bin has >2000 counts, and if more than 50% of those come from <1% of pixels, then it is considered to be noise-dominated and hence unusable.
| Quadrant | # 1 sec bins | Bins with >0 counts | Bins with >2000 counts | High rate bins dominated by noise | Noise dominated (total time) | Noise dominated (detector-on time) | Marked lightcurve |
|---|---|---|---|---|---|---|---|
| A | 7660 | 7146 | 42 | 42 | 0.55% | 0.59% | 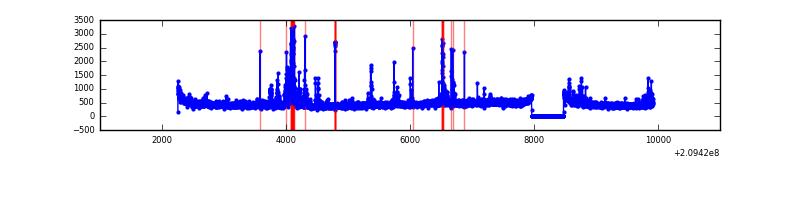 |
| B | 7660 | 7146 | 0 | 0 | 0.00% | 0.00% | 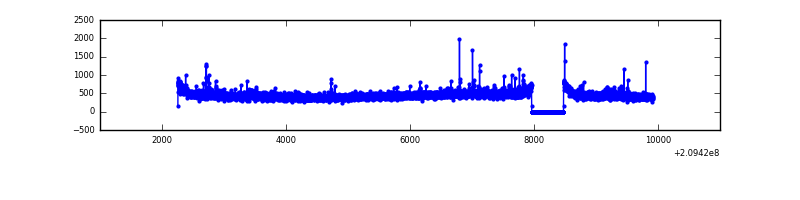 |
| C | 7660 | 7146 | 0 | 0 | 0.00% | 0.00% | 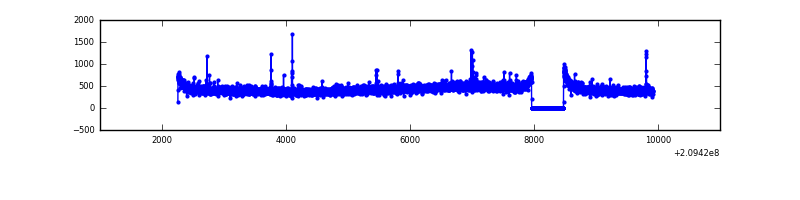 |
| D | 7660 | 7146 | 119 | 119 | 1.55% | 1.67% | 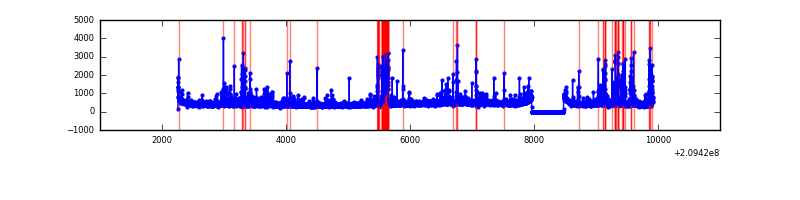 |
Top three noisy pixels from each quadrant. If the there are fewer than three noisy pixels in the level2.evt file, extra rows are filled as -1
| Pixel properties | Quadrant properties | ||||||
|---|---|---|---|---|---|---|---|
| Quadrant | DetID | PixID | Counts | Sigma | Mean | Median | Sigma |
| A | 0 | 50 | 297044 | 1833.64 | 788 | 772 | 161.6 |
| A | 8 | 6 | 77497 | 474.85 | 788 | 772 | 161.6 |
| A | 13 | 251 | 55404 | 338.12 | 788 | 772 | 161.6 |
| B | 14 | 167 | 41726 | 263.56 | 802 | 781 | 155.4 |
| B | 10 | 246 | 22985 | 142.92 | 802 | 781 | 155.4 |
| B | 15 | 54 | 20590 | 127.51 | 802 | 781 | 155.4 |
| C | 9 | 247 | 51588 | 286.32 | 765 | 768 | 177.5 |
| C | 12 | 4 | 14812 | 79.12 | 765 | 768 | 177.5 |
| C | 8 | 128 | 14626 | 78.07 | 765 | 768 | 177.5 |
| D | 13 | 235 | 322289 | 1737.11 | 758 | 733 | 185.1 |
| D | 2 | 136 | 217924 | 1173.31 | 758 | 733 | 185.1 |
| D | 10 | 231 | 75143 | 401.98 | 758 | 733 | 185.1 |
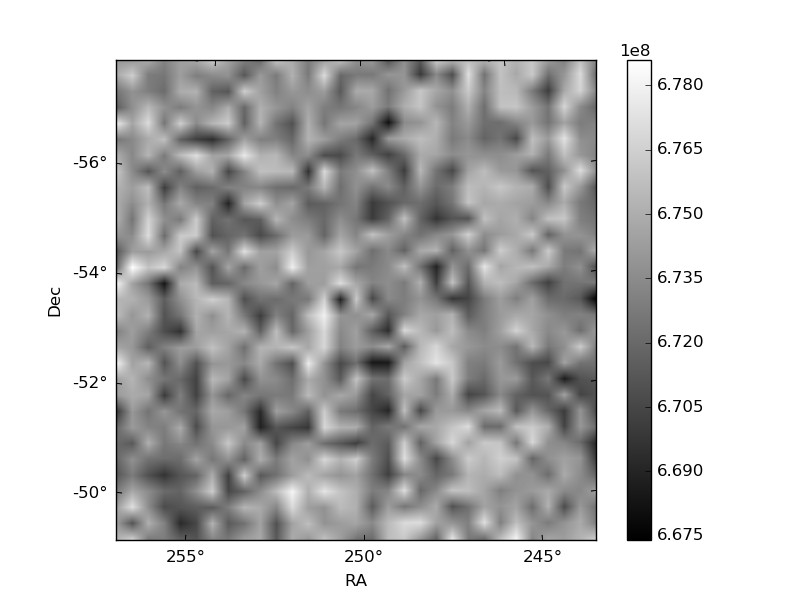
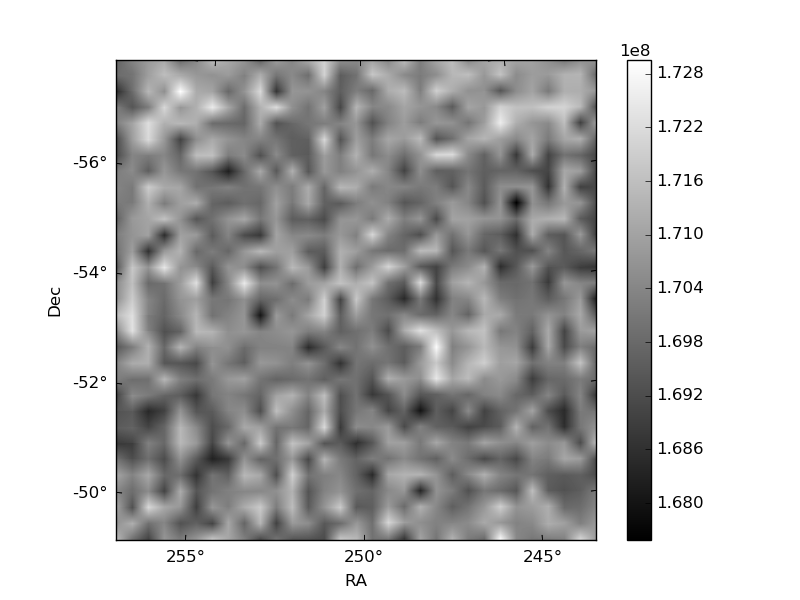
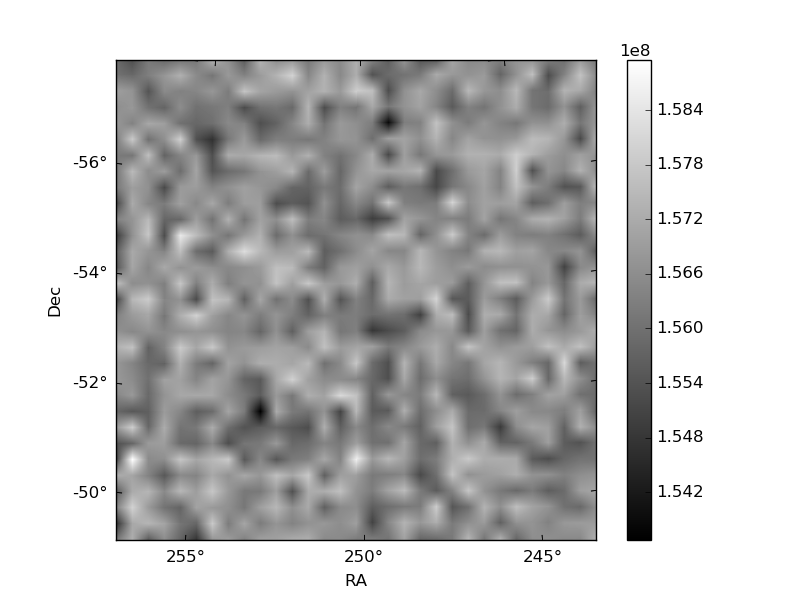
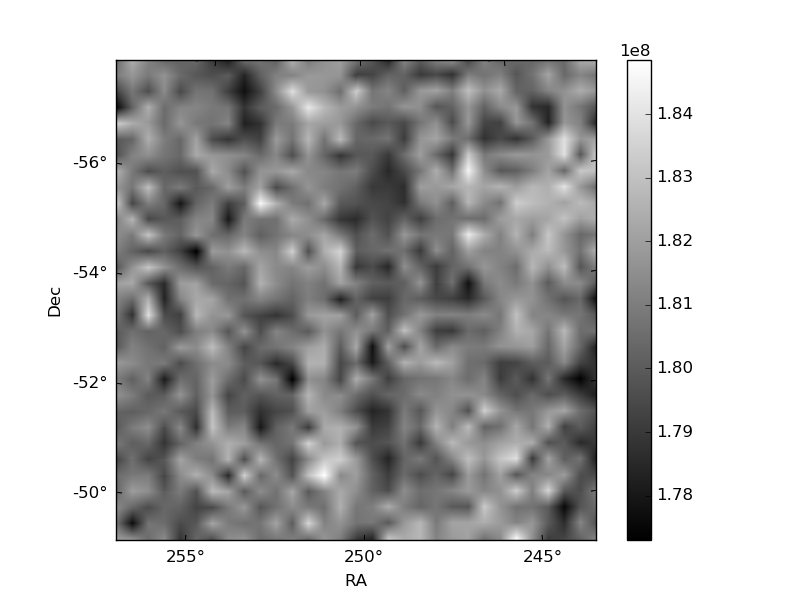
Histogram calculated using DETX and DETY for each event in the final _common_clean file
| Quadrant A | 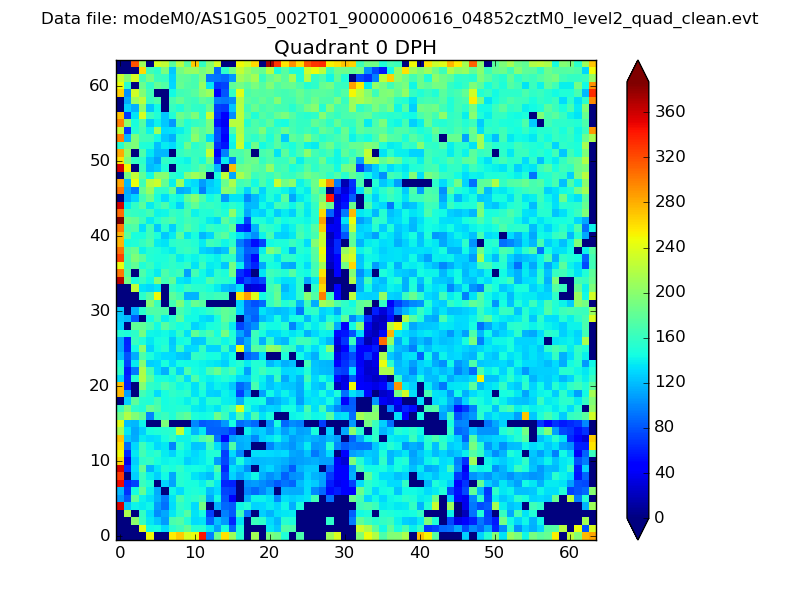 |
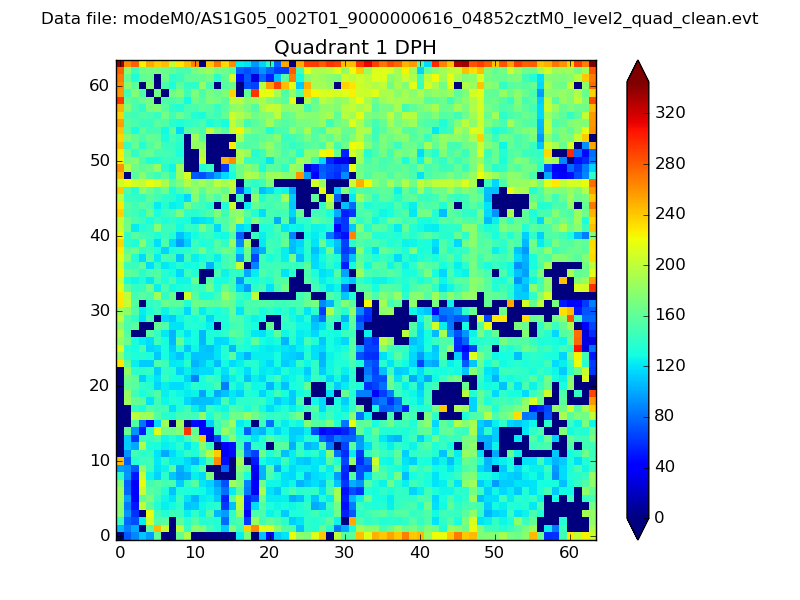 |
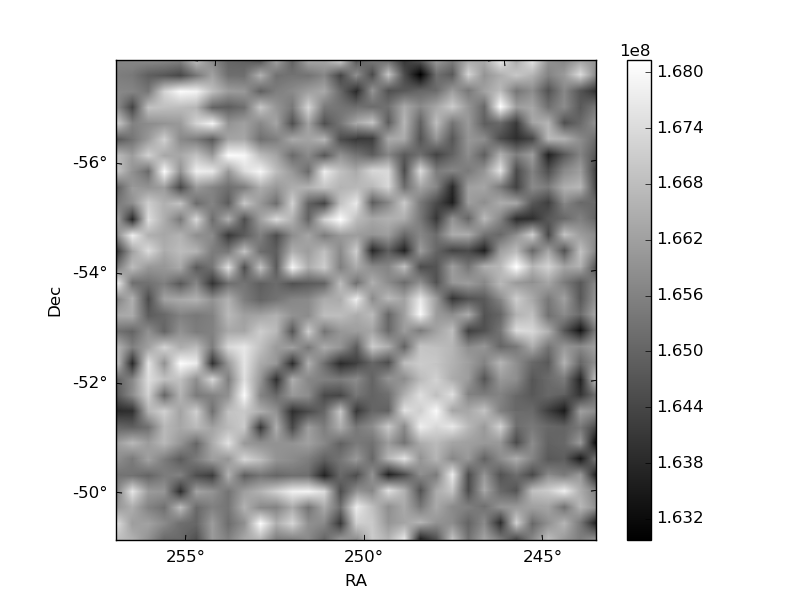
Quadrant B |
|---|---|---|---|
| Quadrant D | 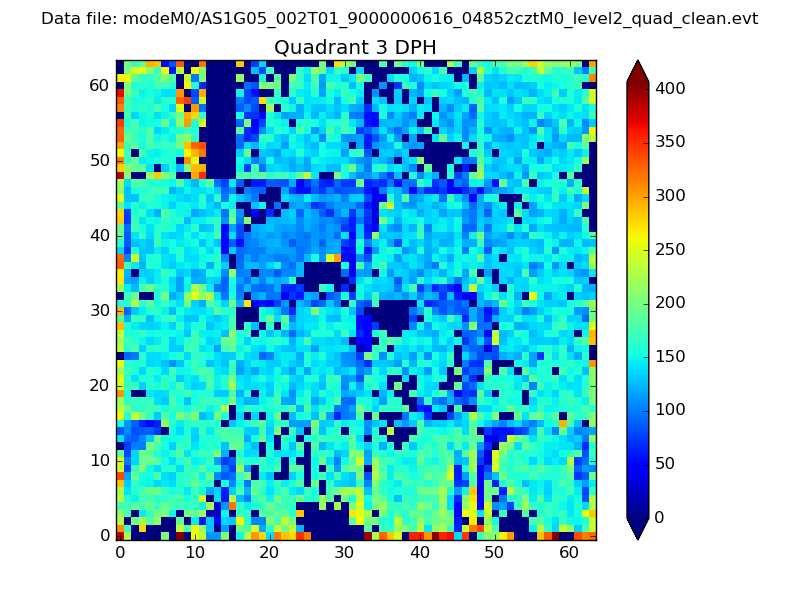 |
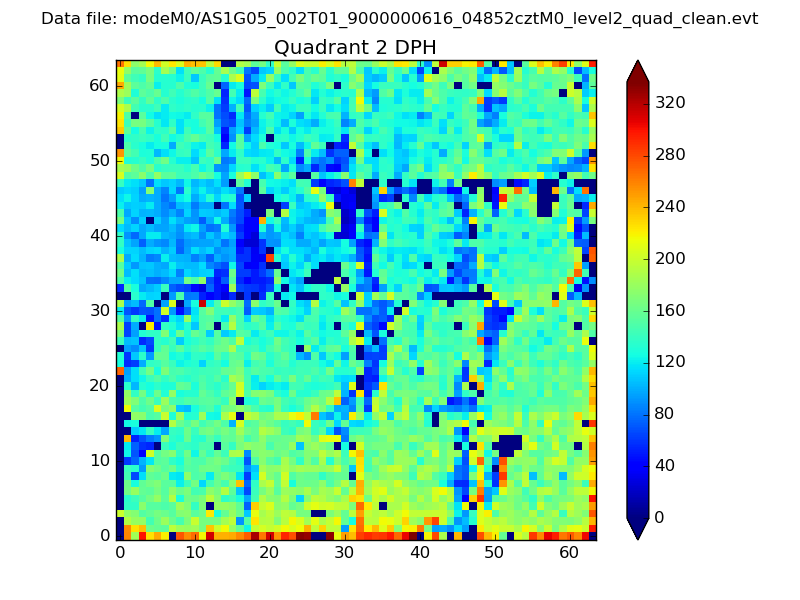 |
Quadrant C |
| Plot type | Count rate plots | Images |
|---|---|---|
| Comparison with Poisson distribution Blue bars denote a histogram of data divided into 1 sec bins. Red curve is a Poisson curve with rate = median count rate of data. |
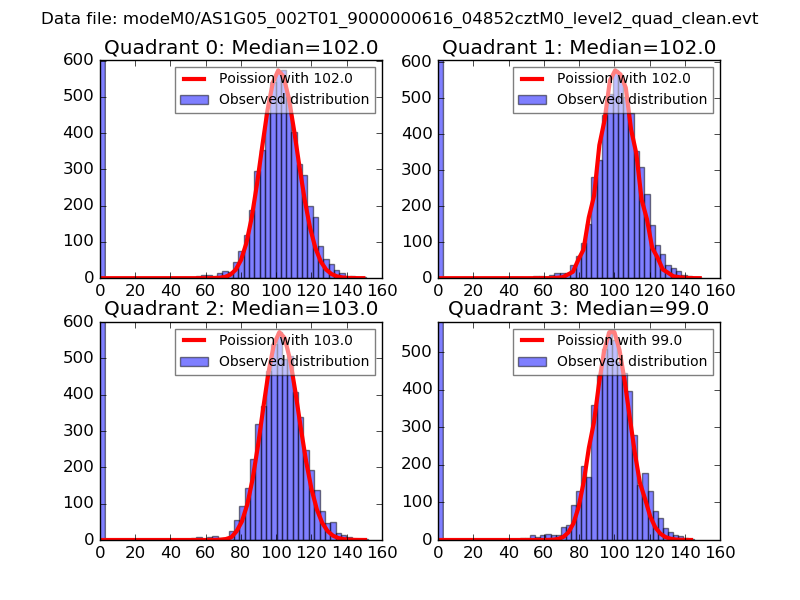 |
 |
| Quadrant-wise count rates Data is divided into 100 sec bins |
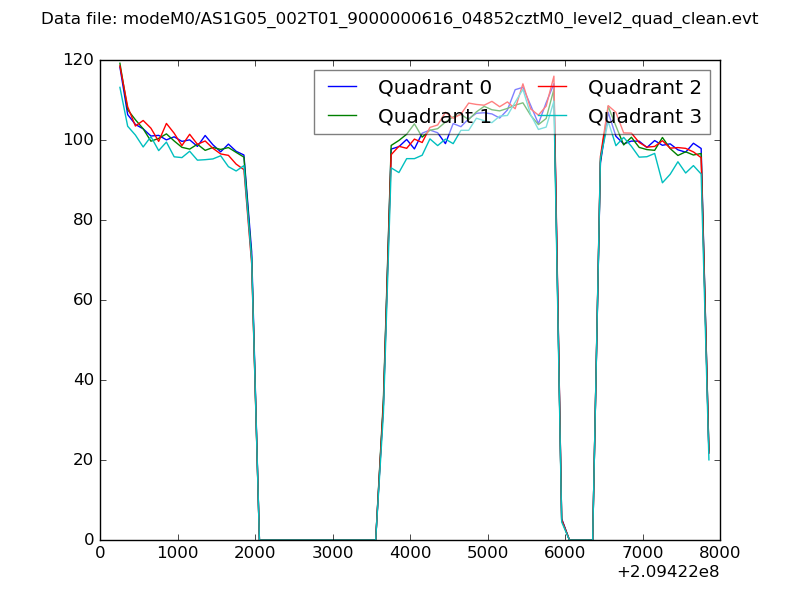 |
|
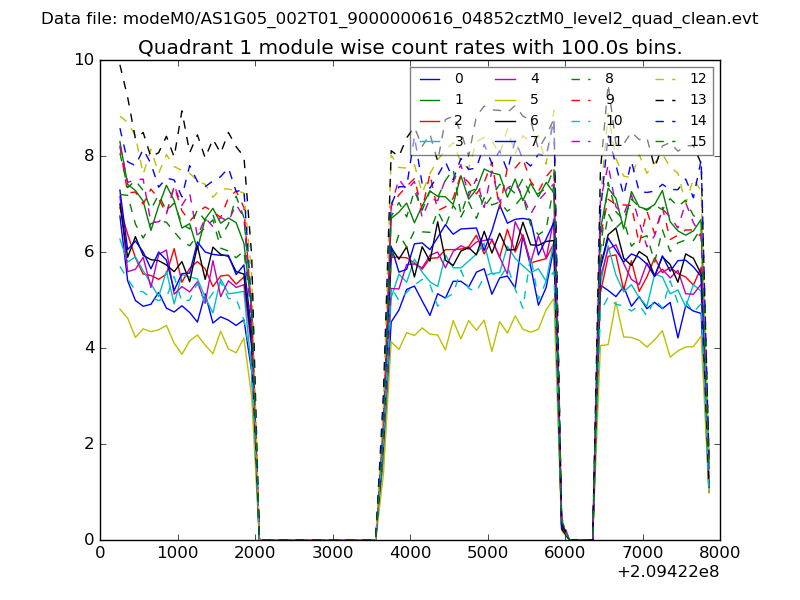
| Module-wise count rates for Quadrant A Data is divided into 100 sec bins |
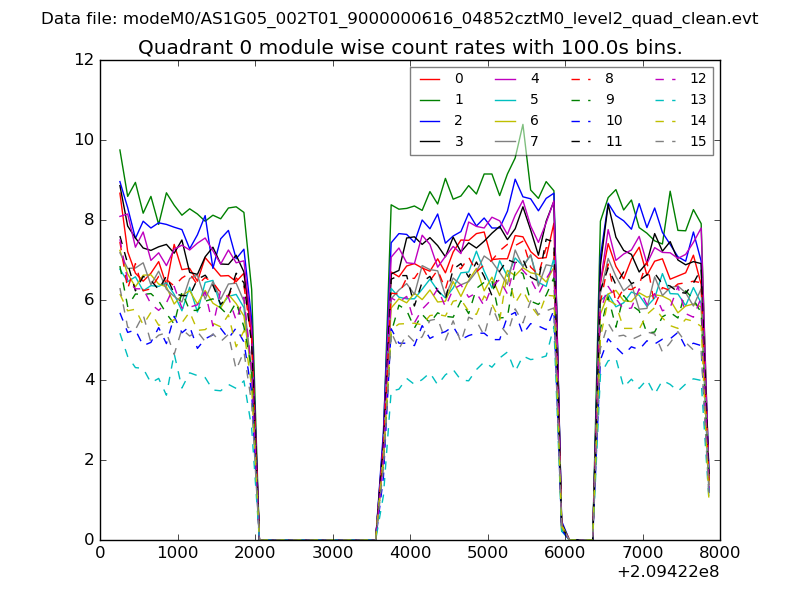 |
 |
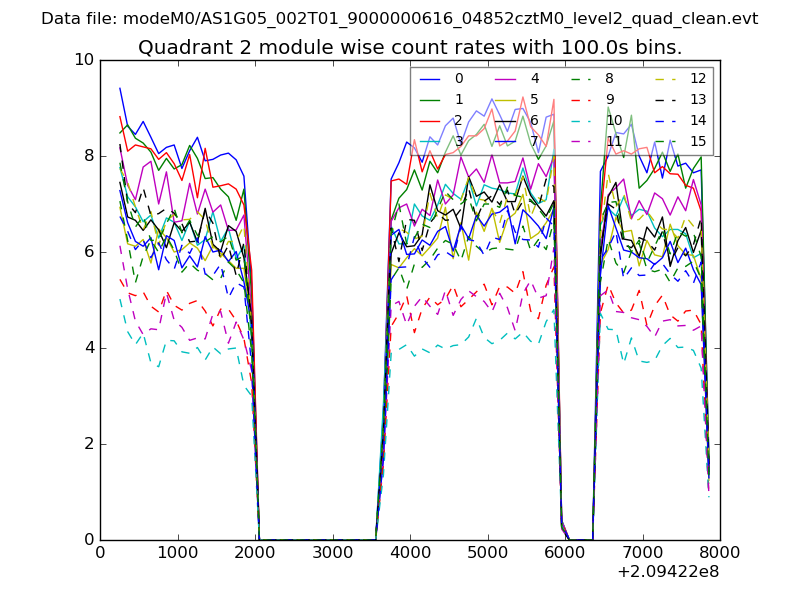
| Module-wise count rates for Quadrant B Data is divided into 100 sec bins |
 |
 |
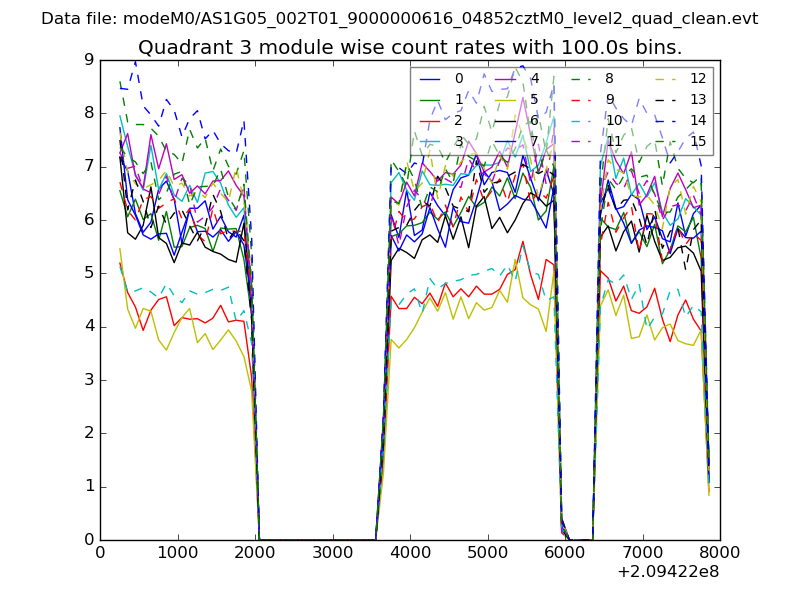
| Module-wise count rates for Quadrant C Data is divided into 100 sec bins |
 |
 |
| Module-wise count rates for Quadrant D Data is divided into 100 sec bins |
 |
 |
| Parameter | Plot |
|---|---|
| CZT HV Monitor | 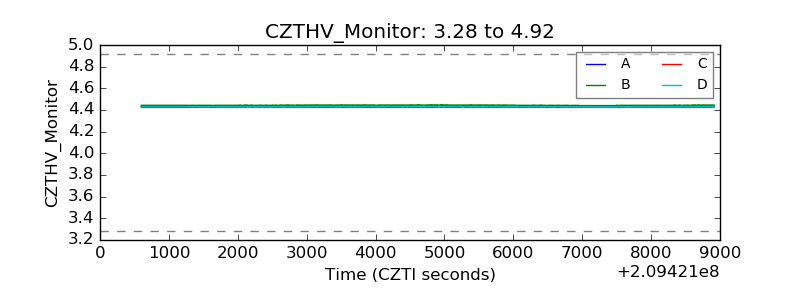 |
| D_VDD | 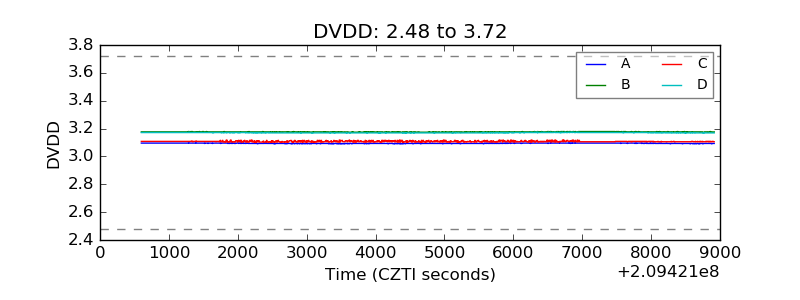 |
| Temperature 1 | 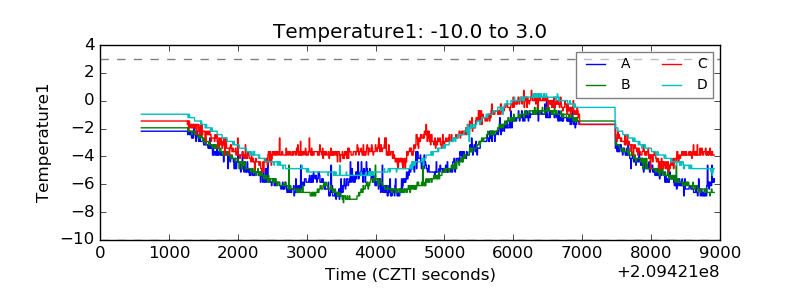 |
| Veto HV Monitor | 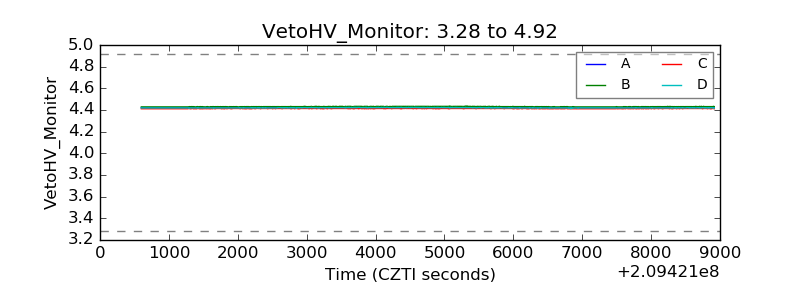 |
| Veto LLD | 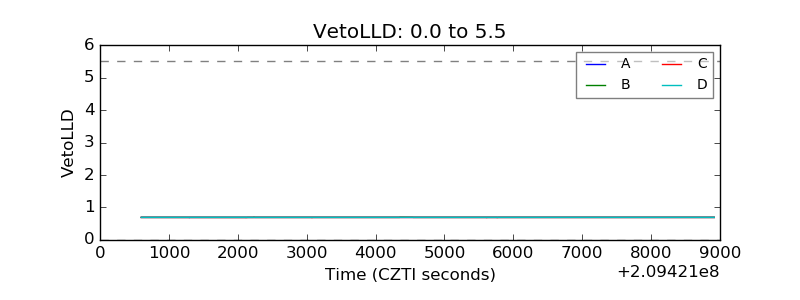 |
| Alpha Counter | 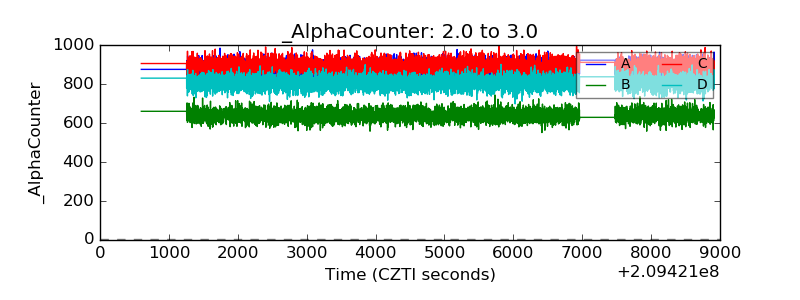 |
| _CPM_Rate | 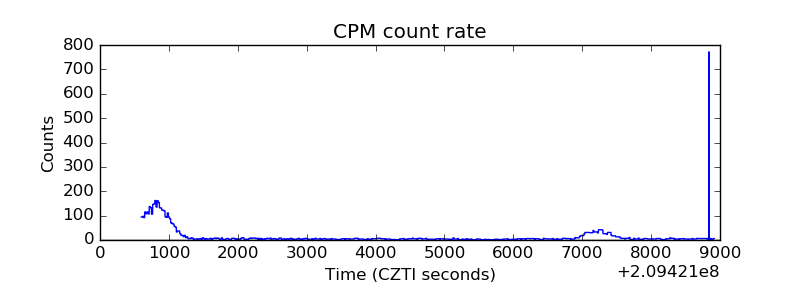 |
| CZT Counter | 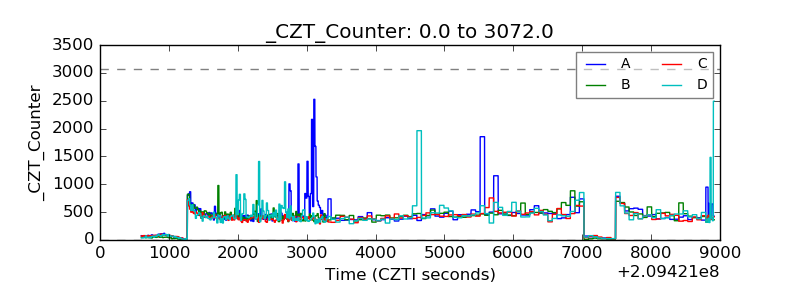 |
| +2.5 Volts monitor |  |
| +5 Volts monitor | 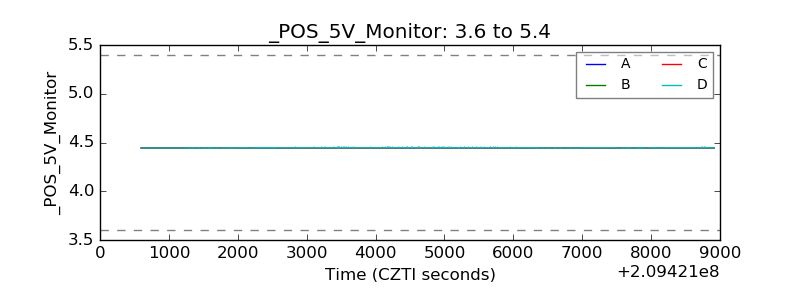 |
| _ROLL_ROT | 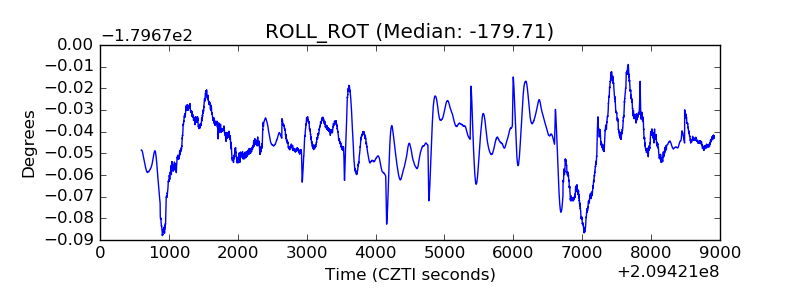 |
| _Roll_DEC | 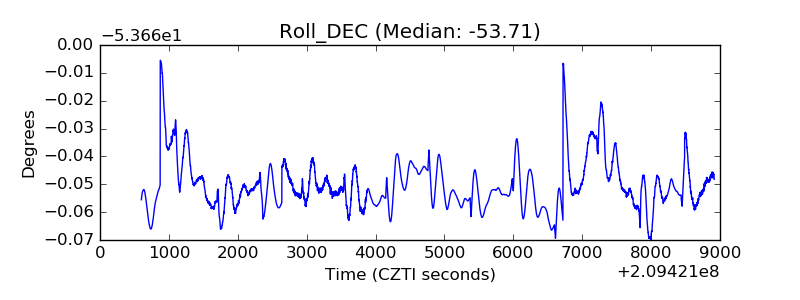 |
| _Roll_RA | 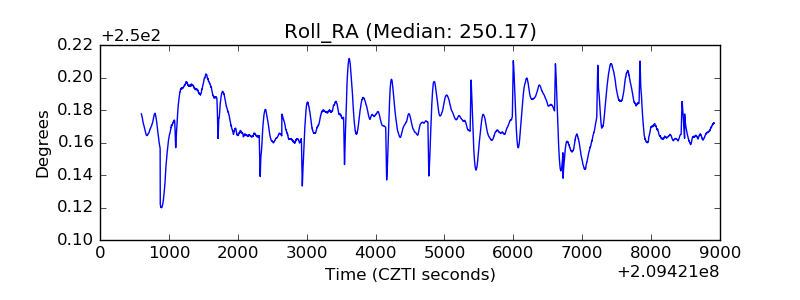 |
| Veto Counter | 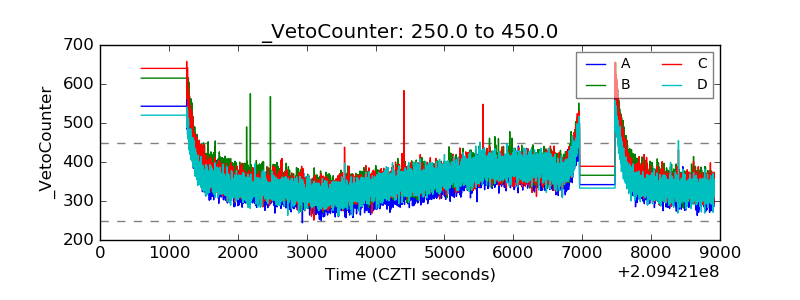 |