| Param | Original file | Final file |
|---|---|---|
| Filename | modeM0/AS1G05_002T01_9000000616_04854cztM0_level2.evt | modeM0/AS1G05_002T01_9000000616_04854cztM0_level2_quad_clean.evt |
| Size (bytes) | 539,501,760 | 88,528,320 |
| Size | 514.5 MB | 84.4 MB |
| Events in quadrant A | 3,911,154 | 535,113 |
| Events in quadrant B | 3,837,484 | 532,165 |
| Events in quadrant C | 3,538,426 | 541,549 |
| Events in quadrant D | 4,508,934 | 516,154 |
| Mode SS | |||
|---|---|---|---|
| Quadrant | BADHDUFLAG | Total packets | Discarded packets |
| A | 0 | 164 | 0 |
| B | 0 | 164 | 0 |
| C | 0 | 164 | 0 |
| D | 0 | 164 | 0 |
| Mode M0 | |||
|---|---|---|---|
| Quadrant | BADHDUFLAG | Total packets | Discarded packets |
| A | 0 | 17474 | 3 |
| B | 0 | 17159 | 2 |
| C | 0 | 16692 | 2 |
| D | 0 | 19283 | 5 |
| Mode M9 | |||
|---|---|---|---|
| Quadrant | BADHDUFLAG | Total packets | Discarded packets |
| A | 0 | 6 | 0 |
| B | 0 | 6 | 0 |
| C | 0 | 6 | 0 |
| D | 0 | 6 | 0 |
| Quadrant | Total seconds | Saturated seconds | Saturation percentage |
|---|---|---|---|
| A | 7992 | 175 | 2.189690% |
| B | 7992 | 196 | 2.452452% |
| C | 7992 | 122 | 1.526527% |
| D | 7991 | 240 | 3.003379% |
Noise dominated data is calculated using 1-second bins in cleaned event files. If a bin has >2000 counts, and if more than 50% of those come from <1% of pixels, then it is considered to be noise-dominated and hence unusable.
| Quadrant | # 1 sec bins | Bins with >0 counts | Bins with >2000 counts | High rate bins dominated by noise | Noise dominated (total time) | Noise dominated (detector-on time) | Marked lightcurve |
|---|---|---|---|---|---|---|---|
| A | 8557 | 7995 | 48 | 48 | 0.56% | 0.60% | 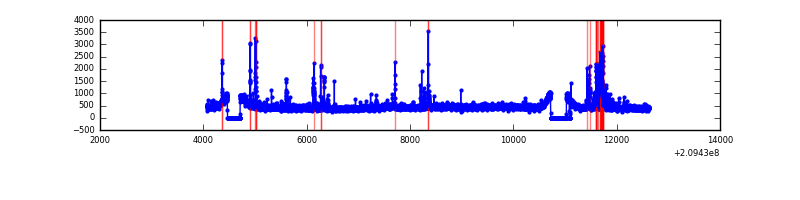 |
| B | 8557 | 7995 | 34 | 34 | 0.40% | 0.43% | 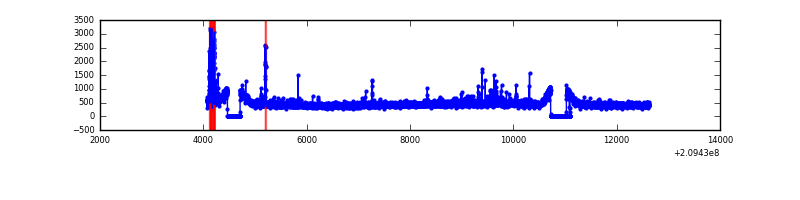 |
| C | 8557 | 7995 | 2 | 2 | 0.02% | 0.03% | 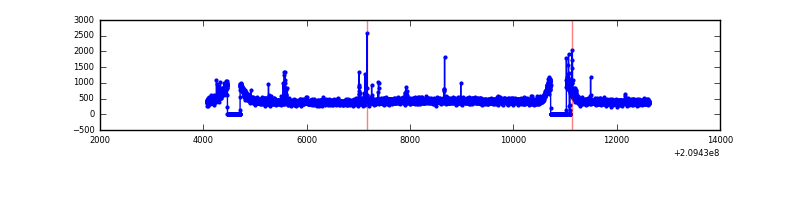 |
| D | 8557 | 7995 | 124 | 124 | 1.45% | 1.55% | 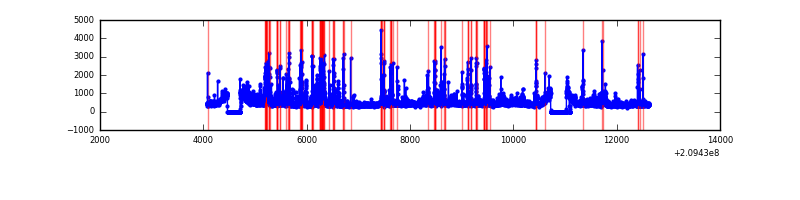 |
Top three noisy pixels from each quadrant. If the there are fewer than three noisy pixels in the level2.evt file, extra rows are filled as -1
| Pixel properties | Quadrant properties | ||||||
|---|---|---|---|---|---|---|---|
| Quadrant | DetID | PixID | Counts | Sigma | Mean | Median | Sigma |
| A | 0 | 50 | 325989 | 1732.9 | 909 | 887 | 187.6 |
| A | 13 | 251 | 61431 | 322.72 | 909 | 887 | 187.6 |
| A | 8 | 6 | 27214 | 140.33 | 909 | 887 | 187.6 |
| B | 10 | 16 | 141493 | 784.64 | 920 | 896 | 179.2 |
| B | 14 | 167 | 66496 | 366.1 | 920 | 896 | 179.2 |
| B | 15 | 204 | 25316 | 136.28 | 920 | 896 | 179.2 |
| C | 12 | 4 | 43818 | 208.41 | 885 | 888 | 206.0 |
| C | 9 | 247 | 32378 | 152.88 | 885 | 888 | 206.0 |
| C | 13 | 61 | 7393 | 31.58 | 885 | 888 | 206.0 |
| D | 13 | 235 | 517157 | 2368.92 | 879 | 850 | 218.0 |
| D | 2 | 136 | 236242 | 1080.03 | 879 | 850 | 218.0 |
| D | 2 | 234 | 194606 | 888.99 | 879 | 850 | 218.0 |
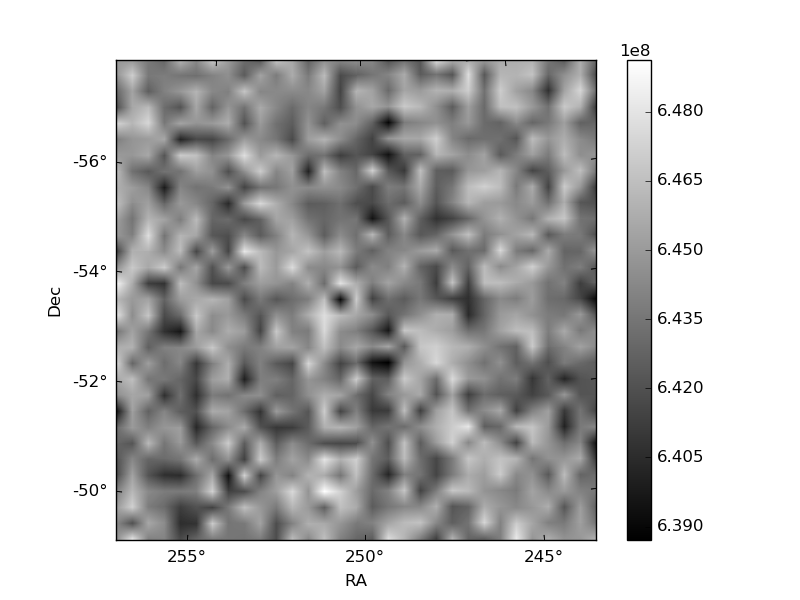
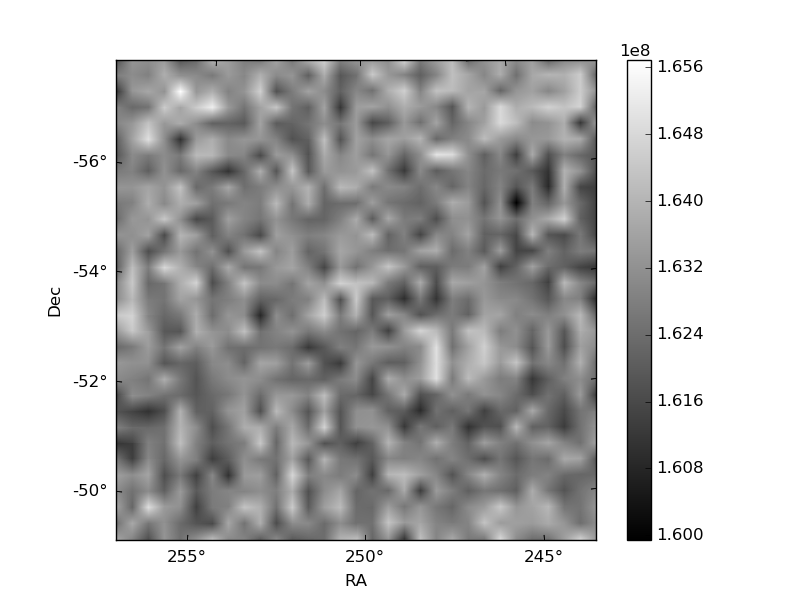
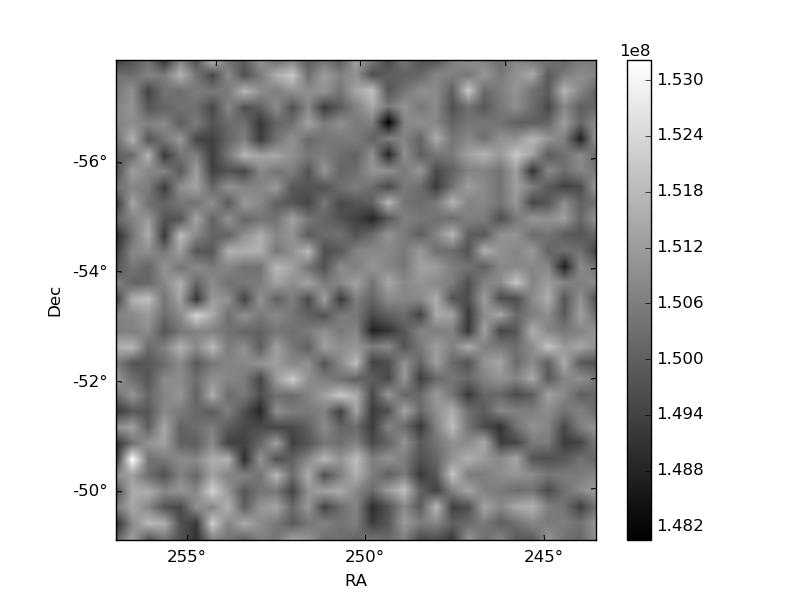
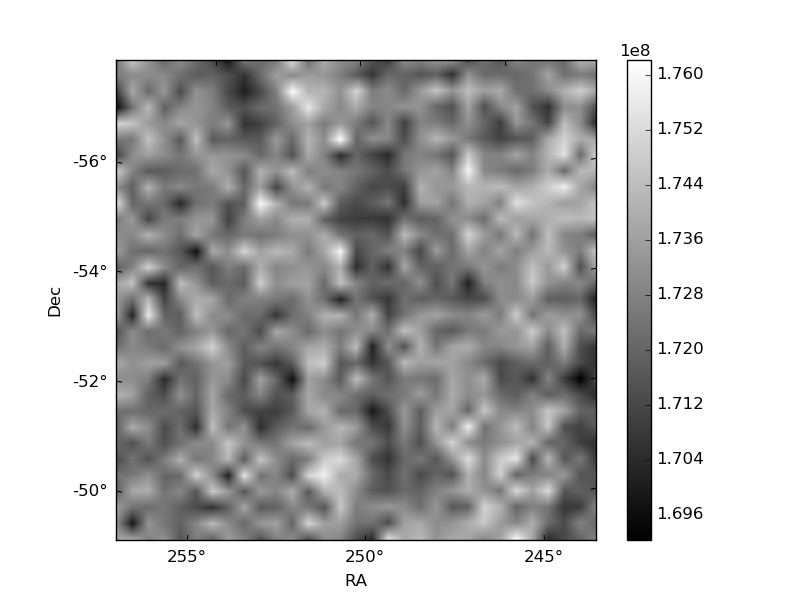
Histogram calculated using DETX and DETY for each event in the final _common_clean file
| Quadrant A | 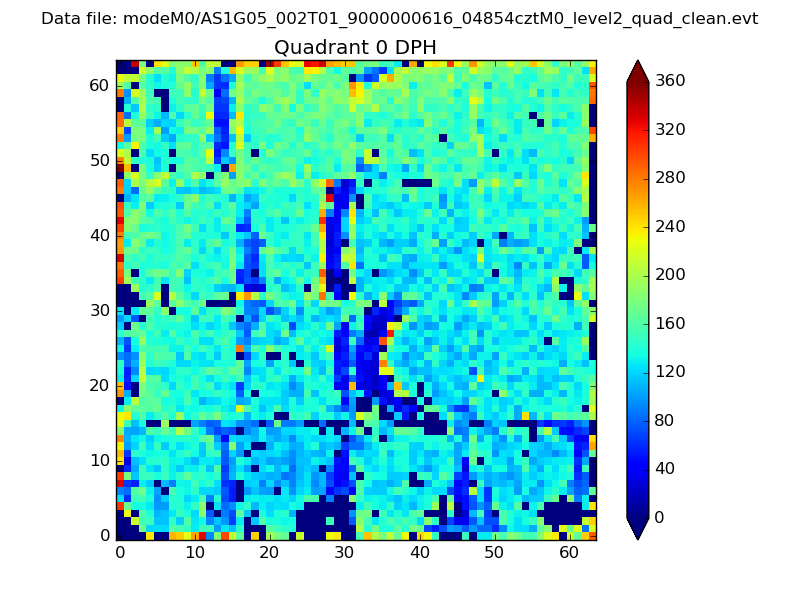 |
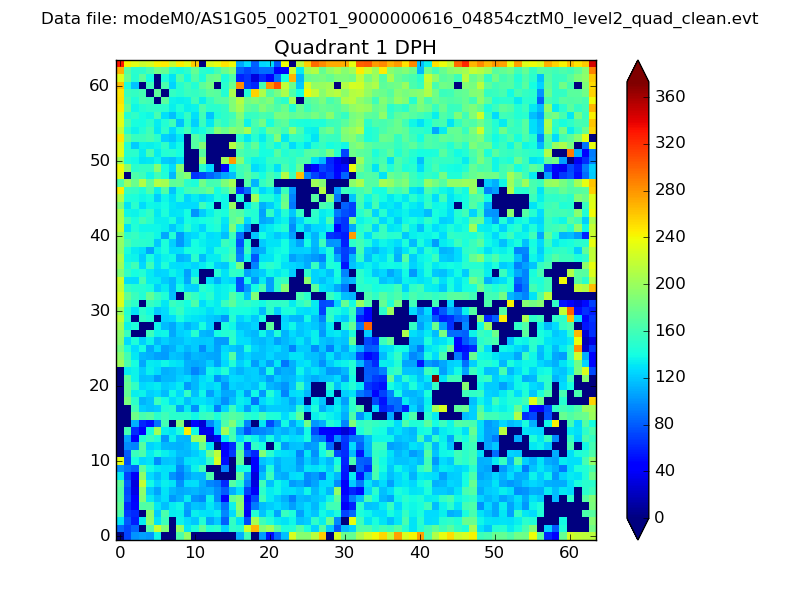 |
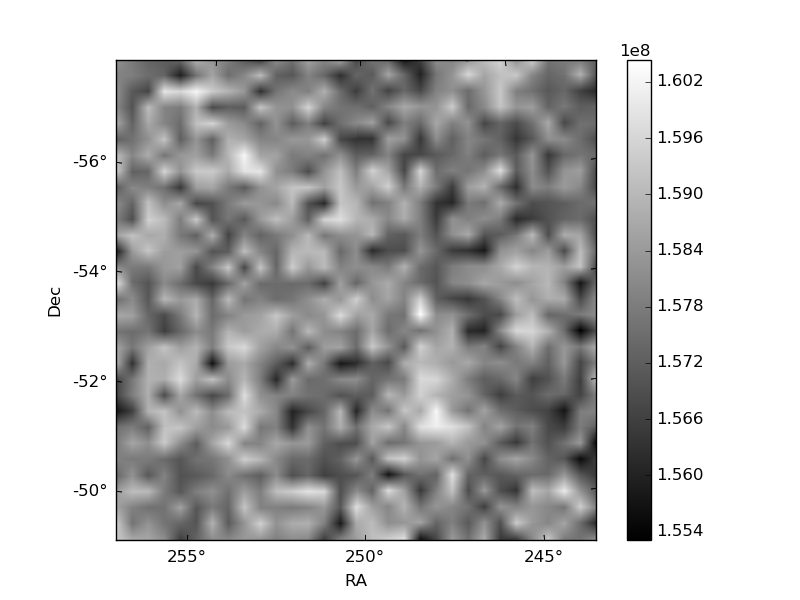
Quadrant B |
|---|---|---|---|
| Quadrant D | 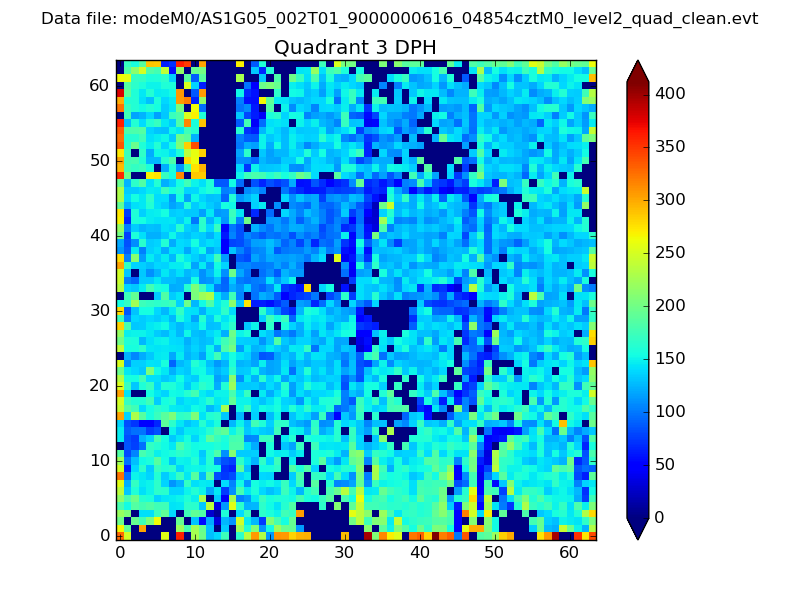 |
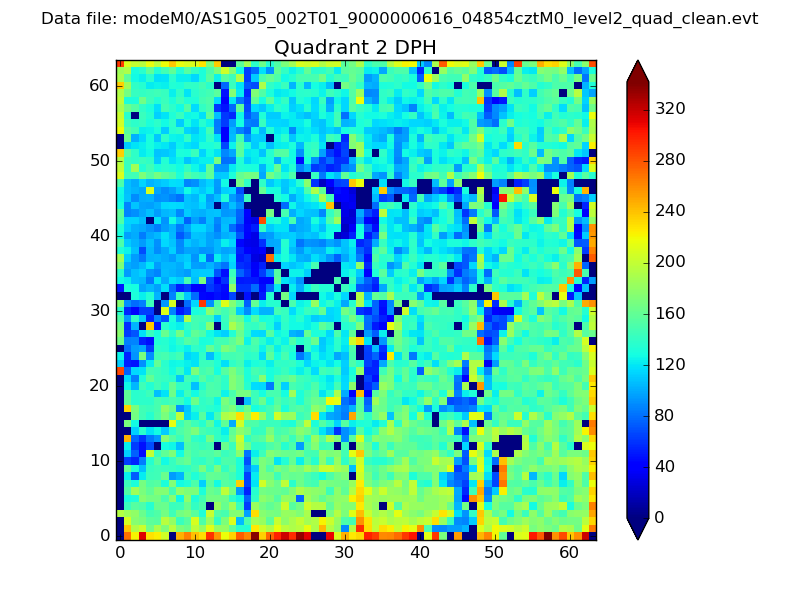 |
Quadrant C |
| Plot type | Count rate plots | Images |
|---|---|---|
| Comparison with Poisson distribution Blue bars denote a histogram of data divided into 1 sec bins. Red curve is a Poisson curve with rate = median count rate of data. |
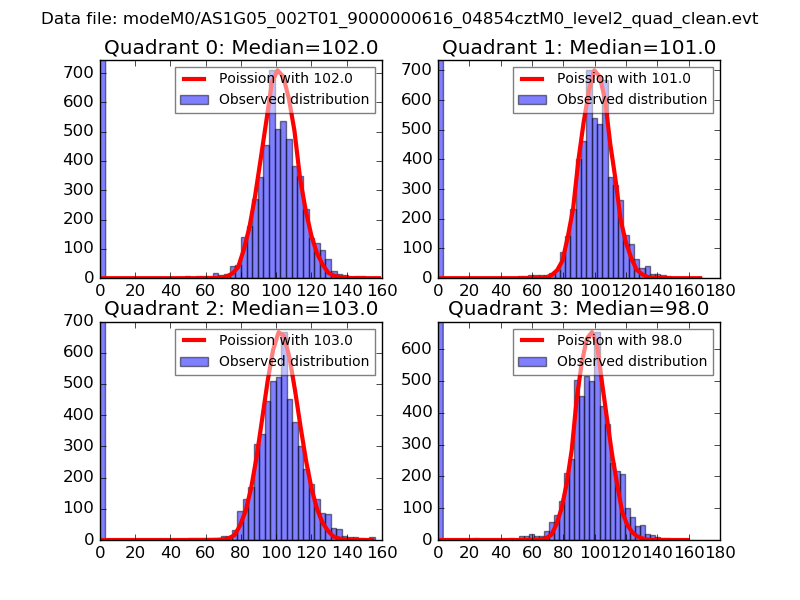 |
 |
| Quadrant-wise count rates Data is divided into 100 sec bins |
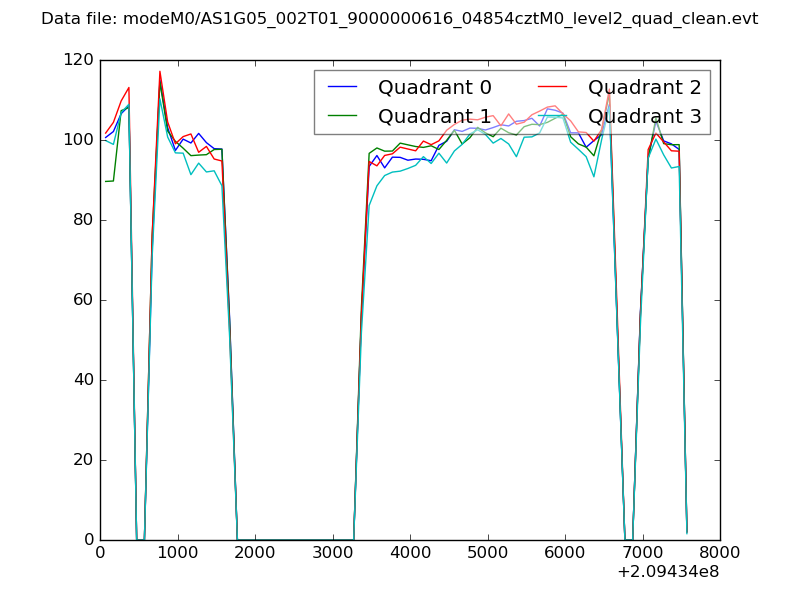 |
|
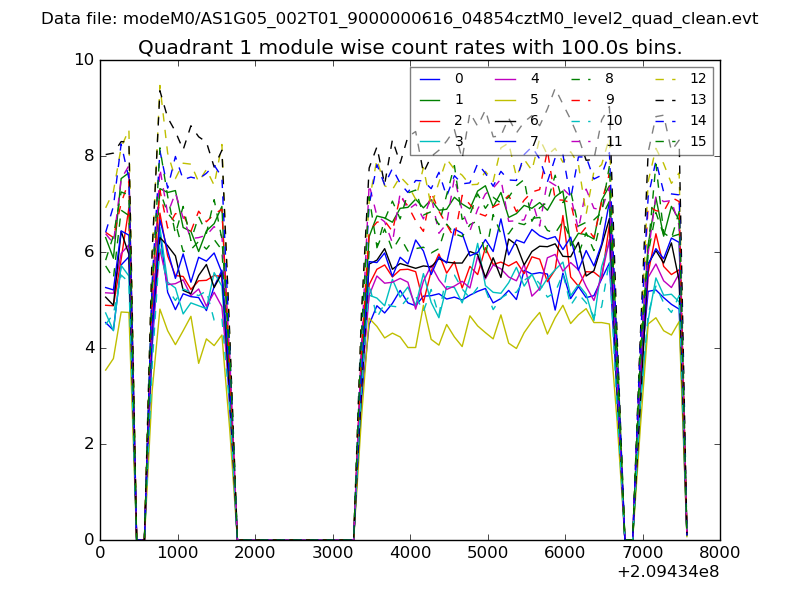
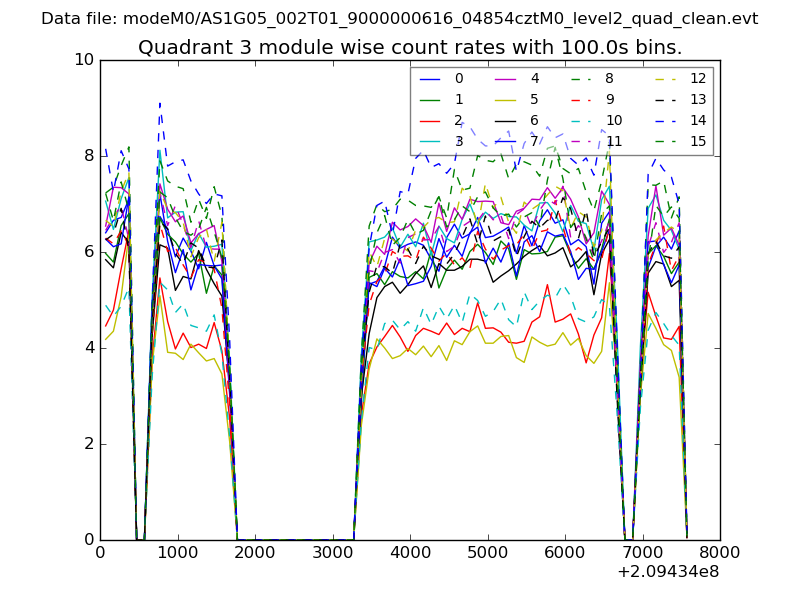
| Module-wise count rates for Quadrant A Data is divided into 100 sec bins |
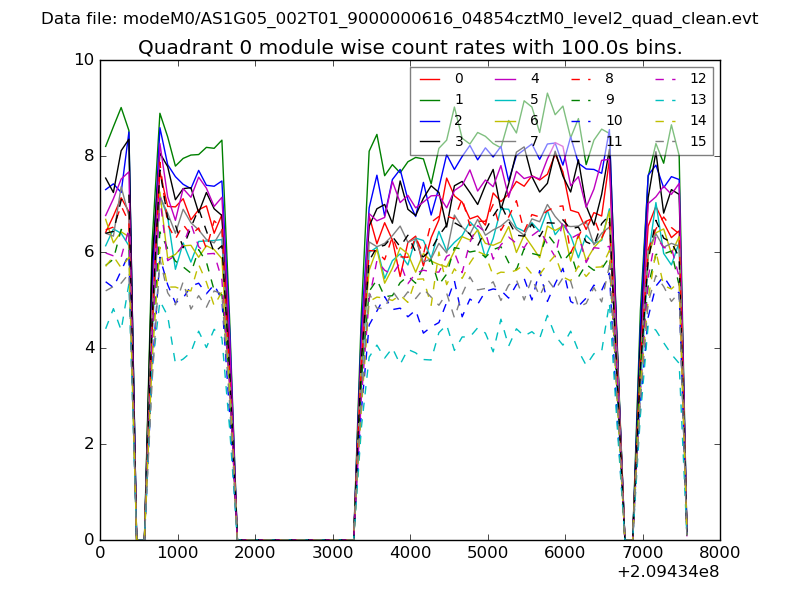 |
 |
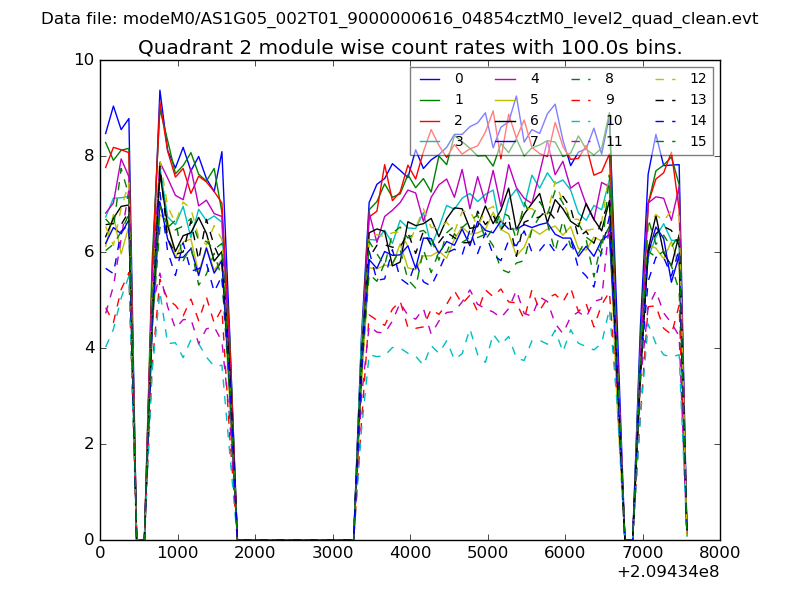
| Module-wise count rates for Quadrant B Data is divided into 100 sec bins |
 |
 |
| Module-wise count rates for Quadrant C Data is divided into 100 sec bins |
 |
 |
| Module-wise count rates for Quadrant D Data is divided into 100 sec bins |
 |
 |
| Parameter | Plot |
|---|---|
| CZT HV Monitor | 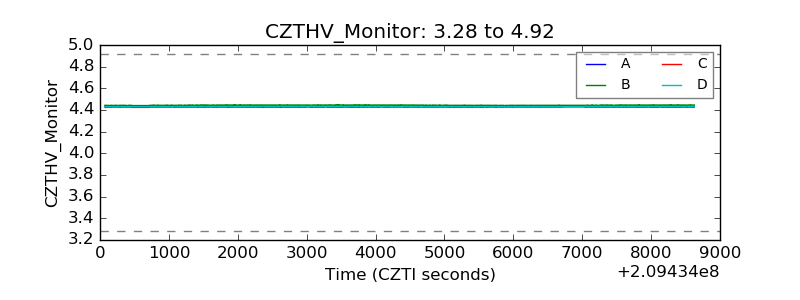 |
| D_VDD | 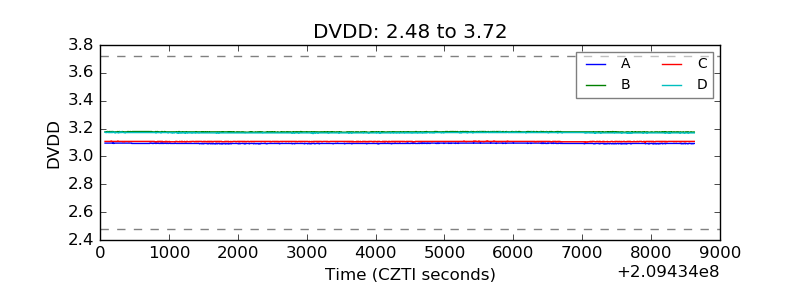 |
| Temperature 1 | 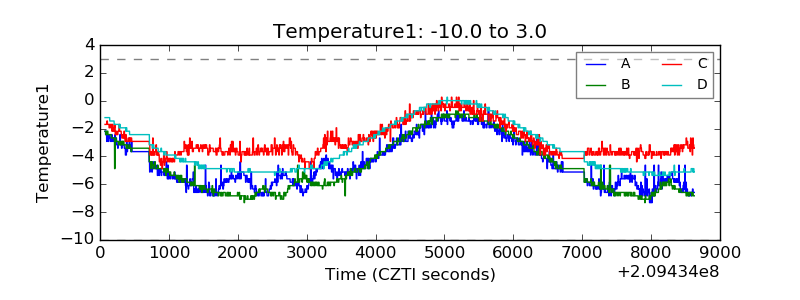 |
| Veto HV Monitor | 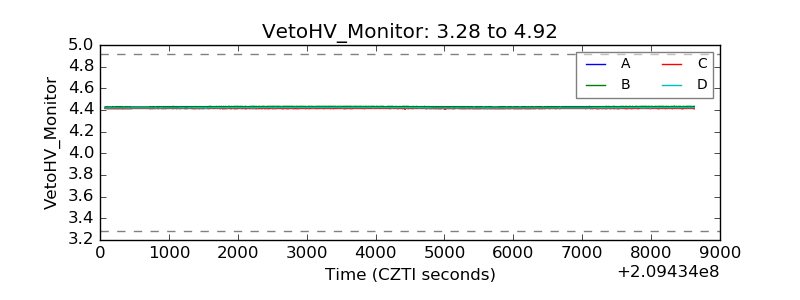 |
| Veto LLD | 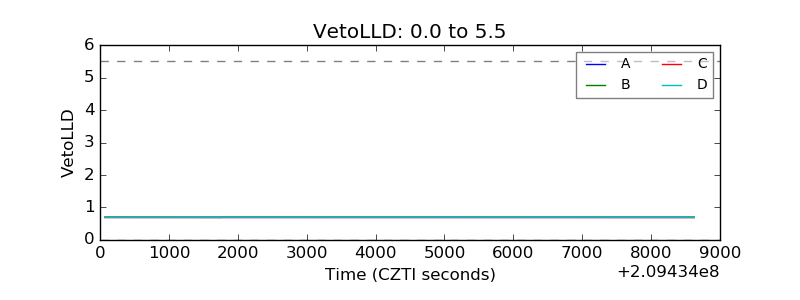 |
| Alpha Counter | 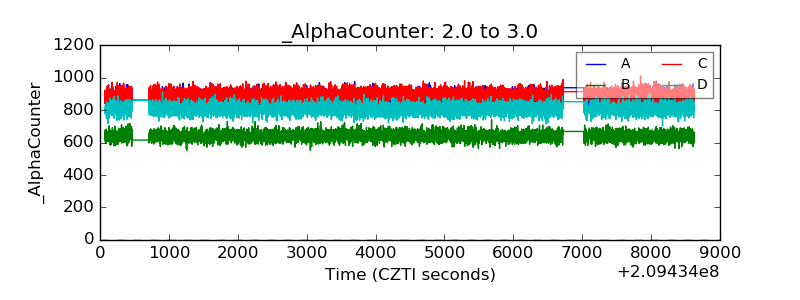 |
| _CPM_Rate | 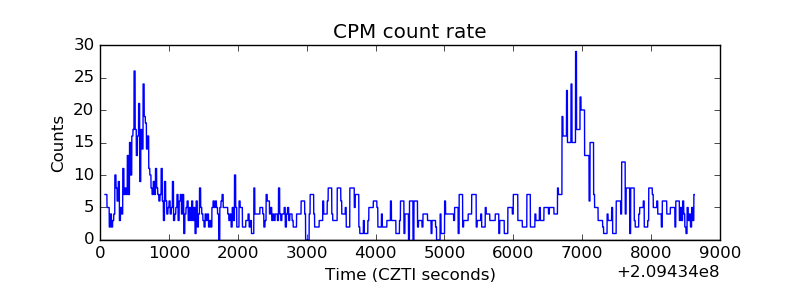 |
| CZT Counter | 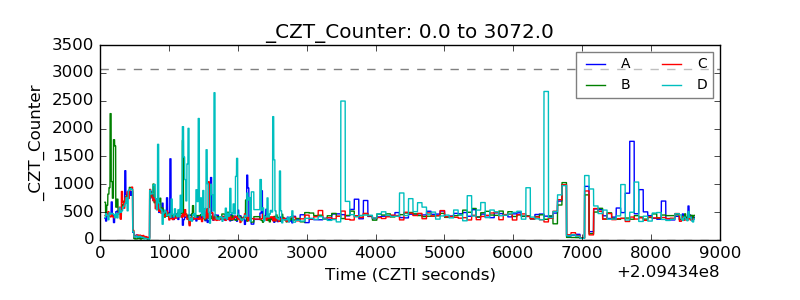 |
| +2.5 Volts monitor |  |
| +5 Volts monitor |  |
| _ROLL_ROT | 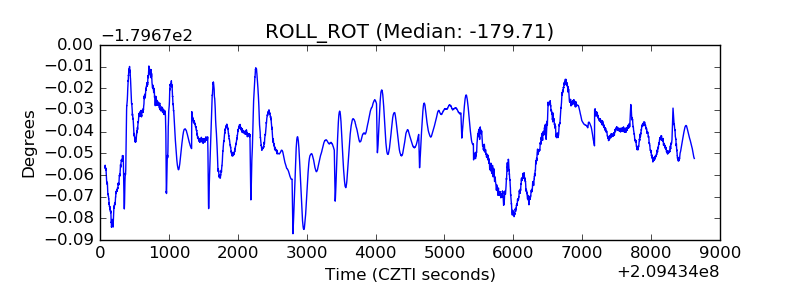 |
| _Roll_DEC | 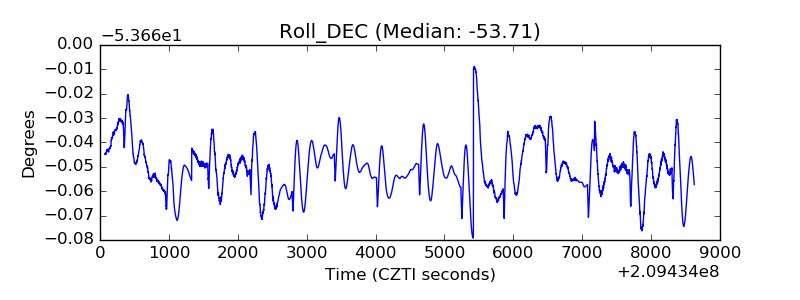 |
| _Roll_RA | 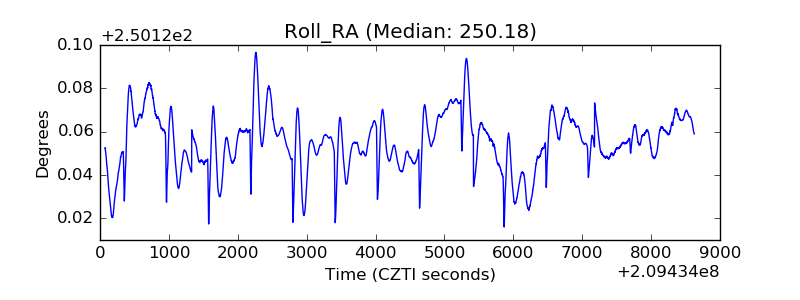 |
| Veto Counter | 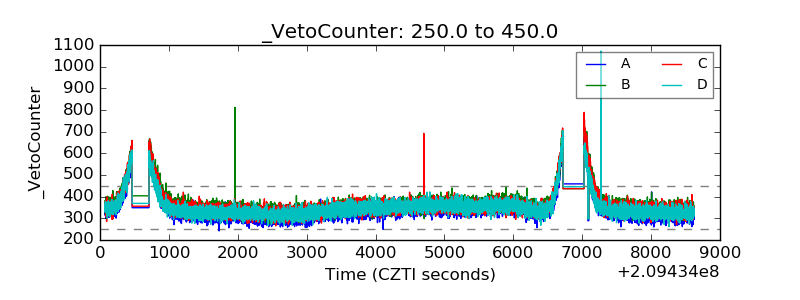 |