| Param | Original file | Final file |
|---|---|---|
| Filename | modeM0/AS1G05_002T01_9000000616_04857cztM0_level2.evt | modeM0/AS1G05_002T01_9000000616_04857cztM0_level2_quad_clean.evt |
| Size (bytes) | 500,374,080 | 92,698,560 |
| Size | 477.2 MB | 88.4 MB |
| Events in quadrant A | 3,442,159 | 572,905 |
| Events in quadrant B | 3,956,276 | 569,424 |
| Events in quadrant C | 3,324,341 | 582,209 |
| Events in quadrant D | 3,917,373 | 556,944 |
| Mode SS | |||
|---|---|---|---|
| Quadrant | BADHDUFLAG | Total packets | Discarded packets |
| A | 0 | 167 | 9 |
| B | 0 | 168 | 12 |
| C | 0 | 170 | 14 |
| D | 0 | 171 | 13 |
| Mode M0 | |||
|---|---|---|---|
| Quadrant | BADHDUFLAG | Total packets | Discarded packets |
| A | 0 | 16740 | 1131 |
| B | 0 | 18051 | 1148 |
| C | 0 | 16591 | 1160 |
| D | 0 | 18356 | 1352 |
| Mode M9 | |||
|---|---|---|---|
| Quadrant | BADHDUFLAG | Total packets | Discarded packets |
| A | 0 | 14 | 0 |
| B | 0 | 14 | 0 |
| C | 0 | 15 | 1 |
| D | 0 | 14 | 0 |
| Quadrant | Total seconds | Saturated seconds | Saturation percentage |
|---|---|---|---|
| A | 7554 | 105 | 1.389992% |
| B | 7551 | 146 | 1.933519% |
| C | 7548 | 86 | 1.139375% |
| D | 7533 | 159 | 2.110713% |
Noise dominated data is calculated using 1-second bins in cleaned event files. If a bin has >2000 counts, and if more than 50% of those come from <1% of pixels, then it is considered to be noise-dominated and hence unusable.
| Quadrant | # 1 sec bins | Bins with >0 counts | Bins with >2000 counts | High rate bins dominated by noise | Noise dominated (total time) | Noise dominated (detector-on time) | Marked lightcurve |
|---|---|---|---|---|---|---|---|
| A | 9473 | 7733 | 14 | 14 | 0.15% | 0.18% | 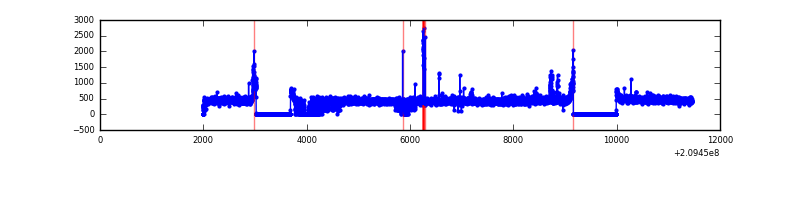 |
| B | 9464 | 7737 | 37 | 37 | 0.39% | 0.48% | 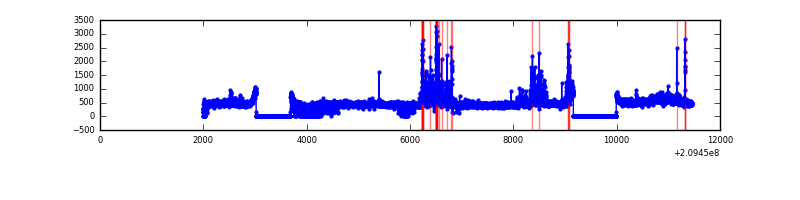 |
| C | 9479 | 7727 | 1 | 1 | 0.01% | 0.01% | 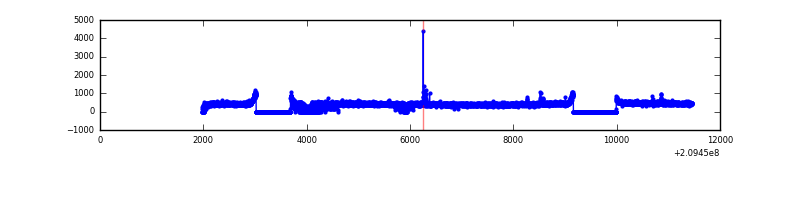 |
| D | 9471 | 7728 | 64 | 64 | 0.68% | 0.83% | 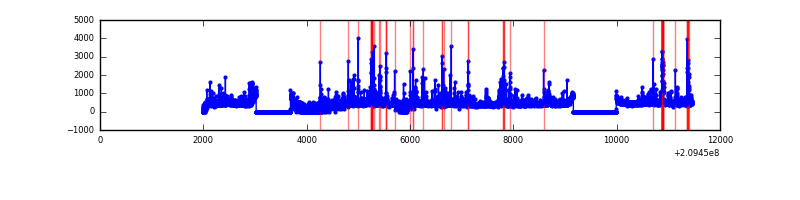 |
Top three noisy pixels from each quadrant. If the there are fewer than three noisy pixels in the level2.evt file, extra rows are filled as -1
| Pixel properties | Quadrant properties | ||||||
|---|---|---|---|---|---|---|---|
| Quadrant | DetID | PixID | Counts | Sigma | Mean | Median | Sigma |
| A | 0 | 50 | 83251 | 465.17 | 858 | 837 | 177.2 |
| A | 8 | 6 | 21270 | 115.33 | 858 | 837 | 177.2 |
| A | 8 | 15 | 13653 | 72.34 | 858 | 837 | 177.2 |
| B | 10 | 16 | 532149 | 3161.36 | 867 | 846 | 168.1 |
| B | 15 | 204 | 22715 | 130.12 | 867 | 846 | 168.1 |
| B | 4 | 80 | 18226 | 103.41 | 867 | 846 | 168.1 |
| C | 12 | 4 | 33917 | 169.08 | 839 | 842 | 195.6 |
| C | 9 | 247 | 9298 | 43.23 | 839 | 842 | 195.6 |
| C | 13 | 61 | 6837 | 30.65 | 839 | 842 | 195.6 |
| D | 1 | 31 | 227410 | 1112.91 | 831 | 804 | 203.6 |
| D | 13 | 235 | 206927 | 1012.31 | 831 | 804 | 203.6 |
| D | 2 | 136 | 173075 | 846.06 | 831 | 804 | 203.6 |
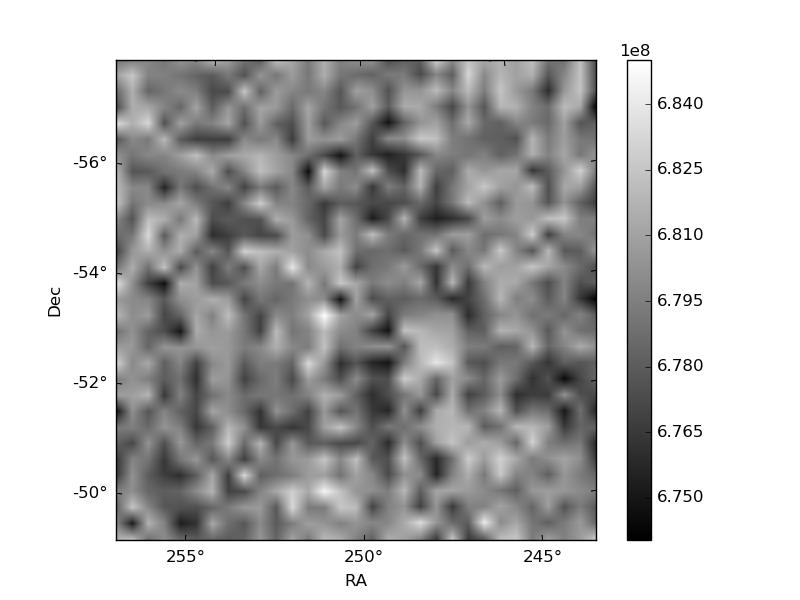
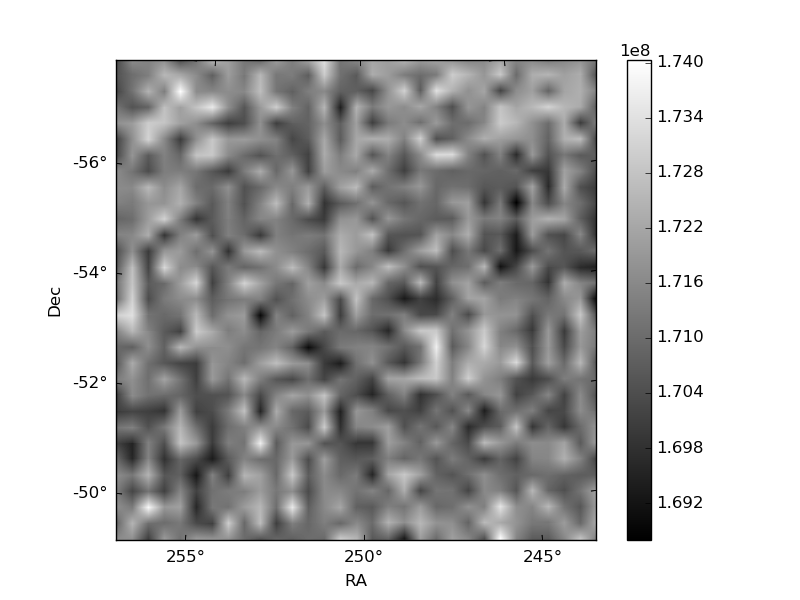
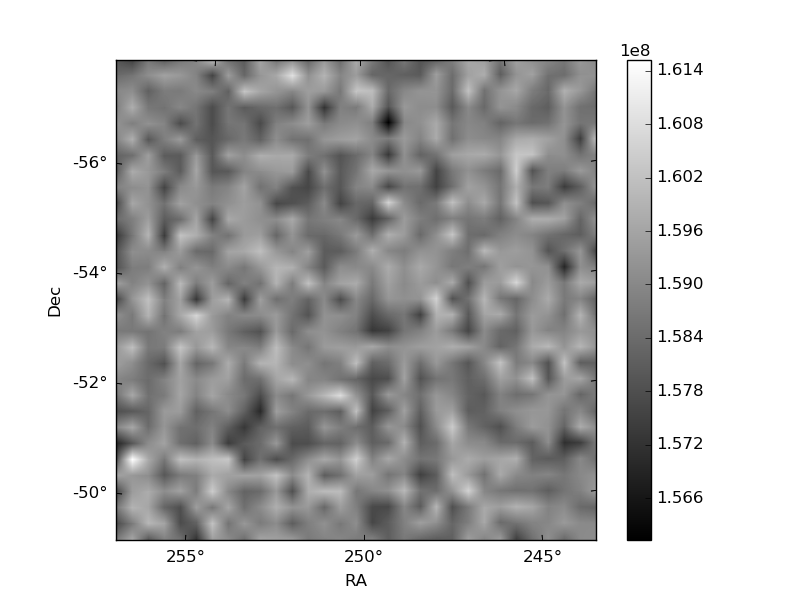
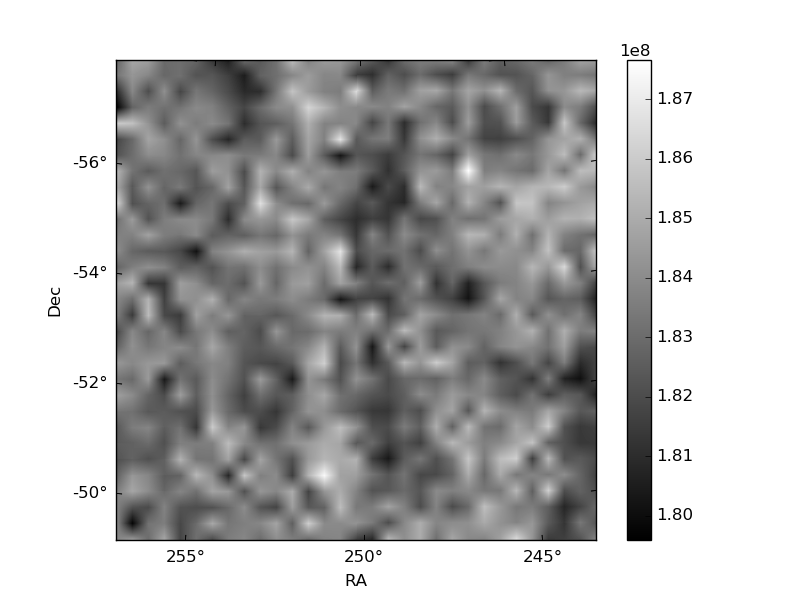
Histogram calculated using DETX and DETY for each event in the final _common_clean file
| Quadrant A | 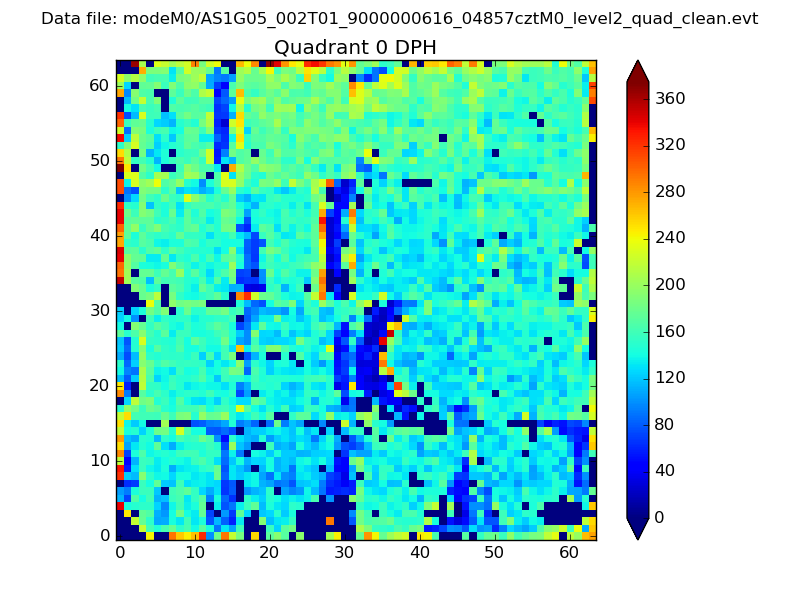 |
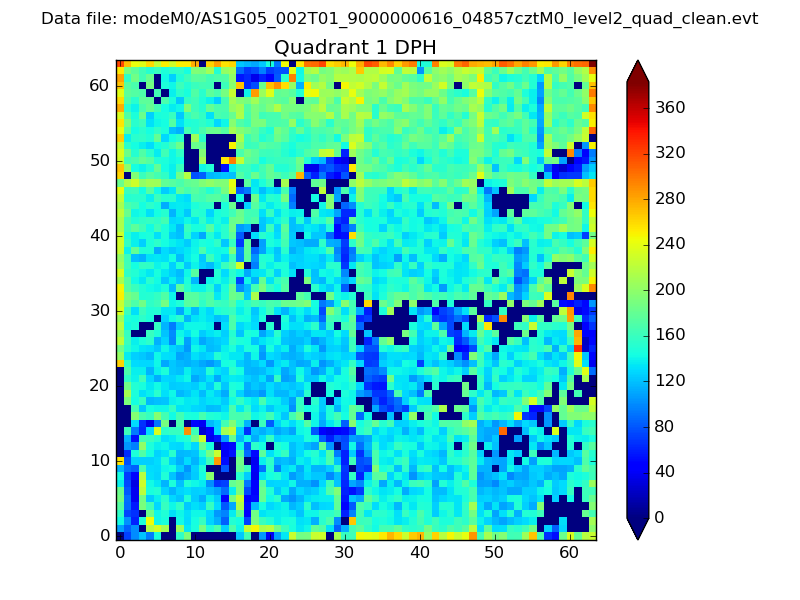 |
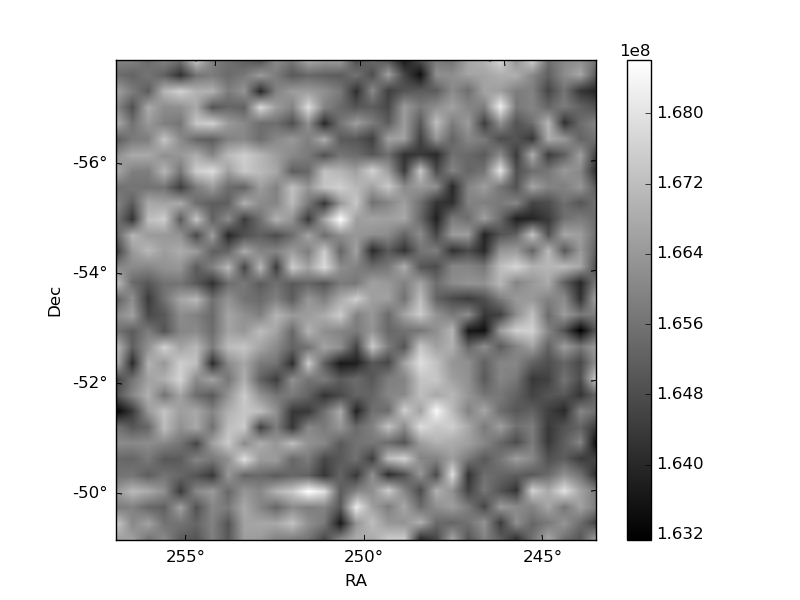
Quadrant B |
|---|---|---|---|
| Quadrant D | 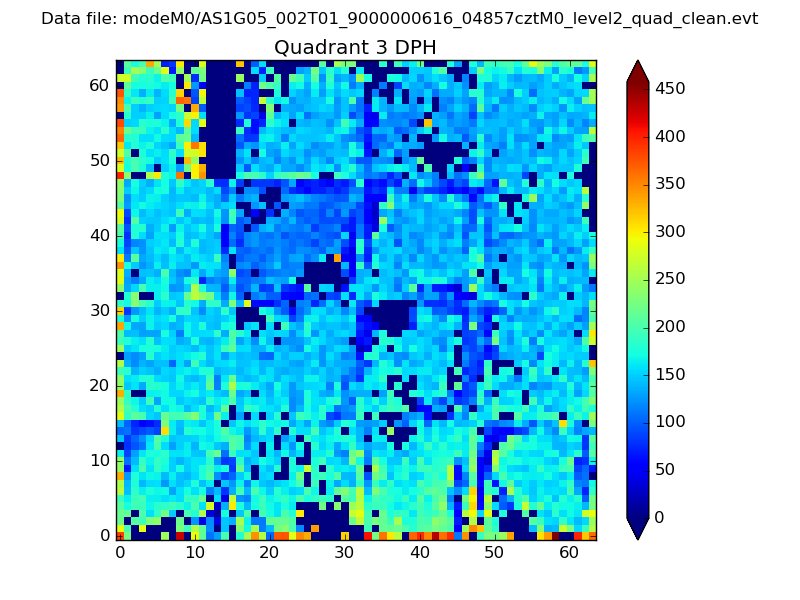 |
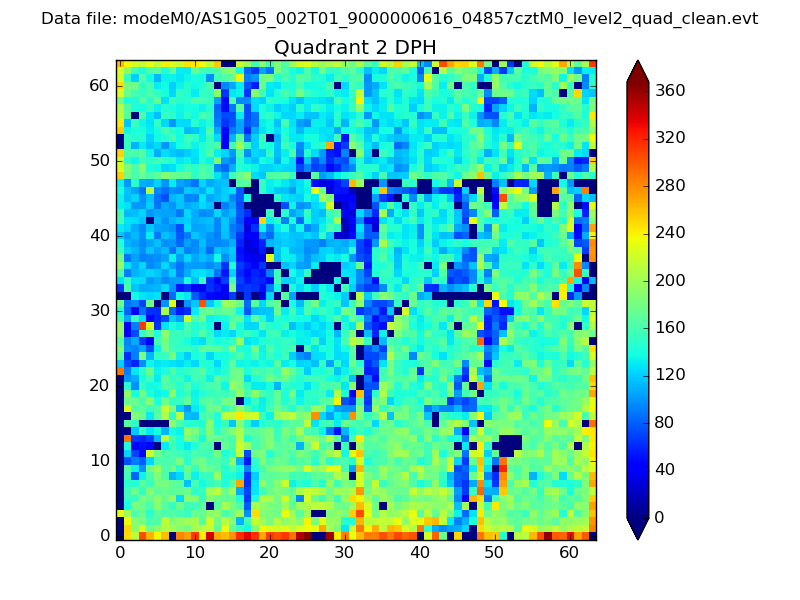 |
Quadrant C |
| Plot type | Count rate plots | Images |
|---|---|---|
| Comparison with Poisson distribution Blue bars denote a histogram of data divided into 1 sec bins. Red curve is a Poisson curve with rate = median count rate of data. |
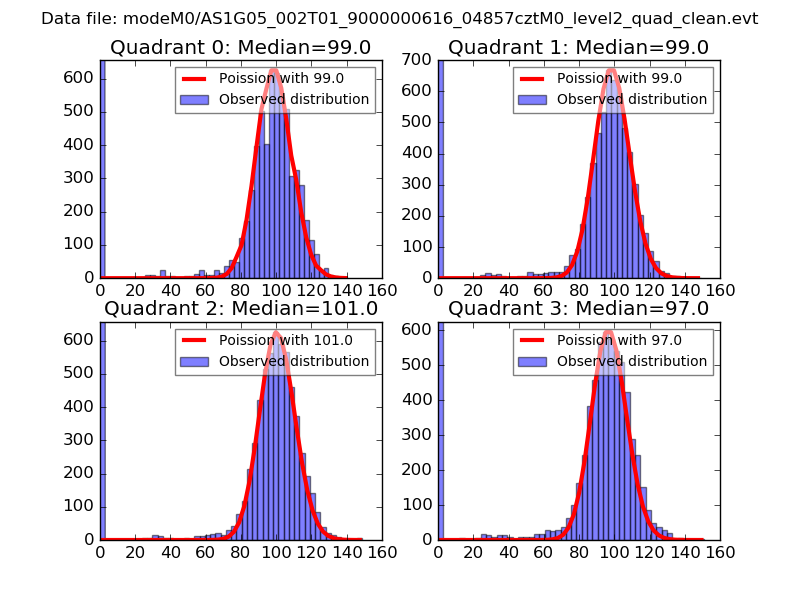 |
 |
| Quadrant-wise count rates Data is divided into 100 sec bins |
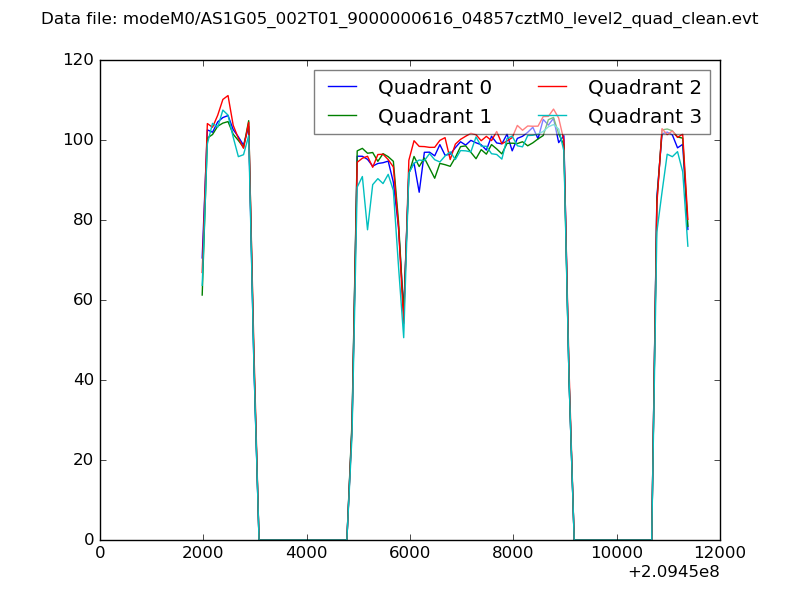 |
|
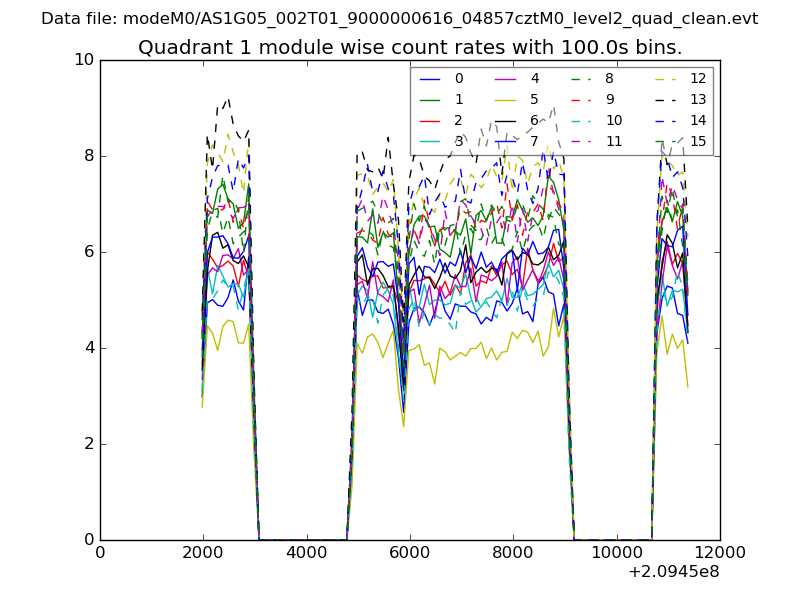
| Module-wise count rates for Quadrant A Data is divided into 100 sec bins |
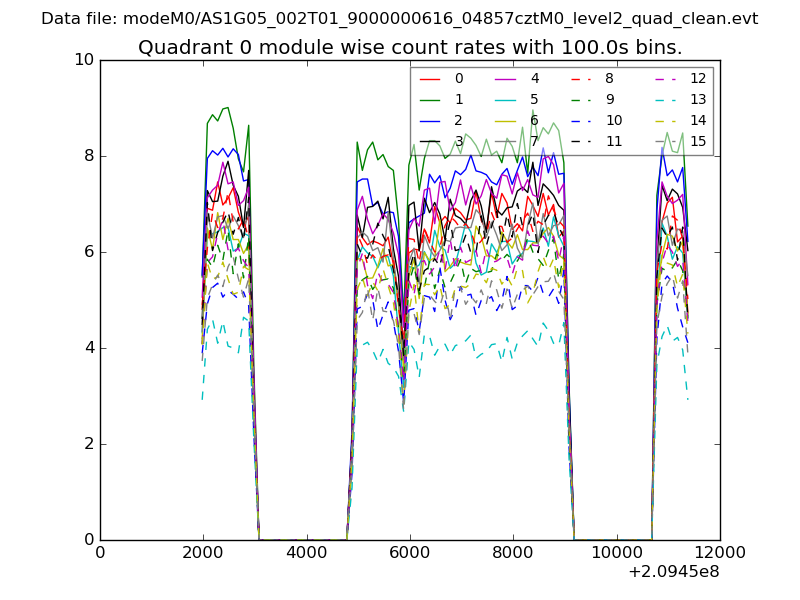 |
 |
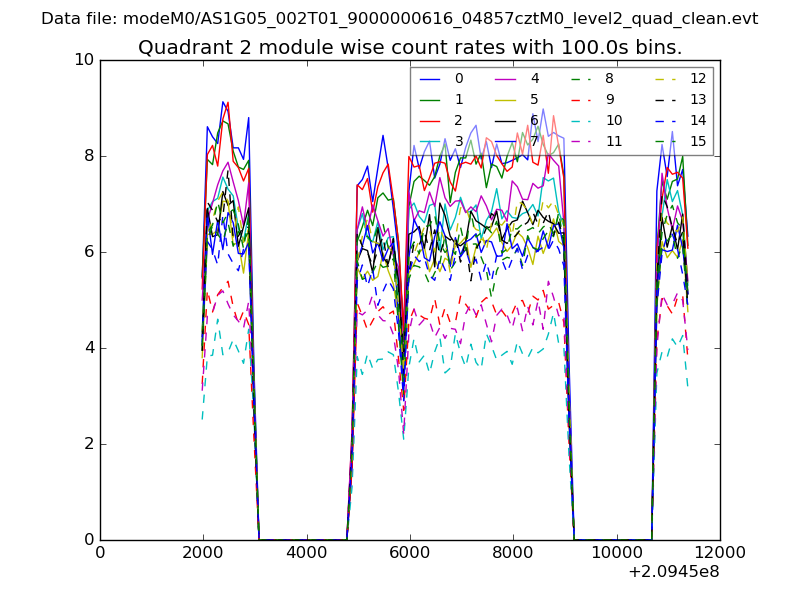
| Module-wise count rates for Quadrant B Data is divided into 100 sec bins |
 |
 |
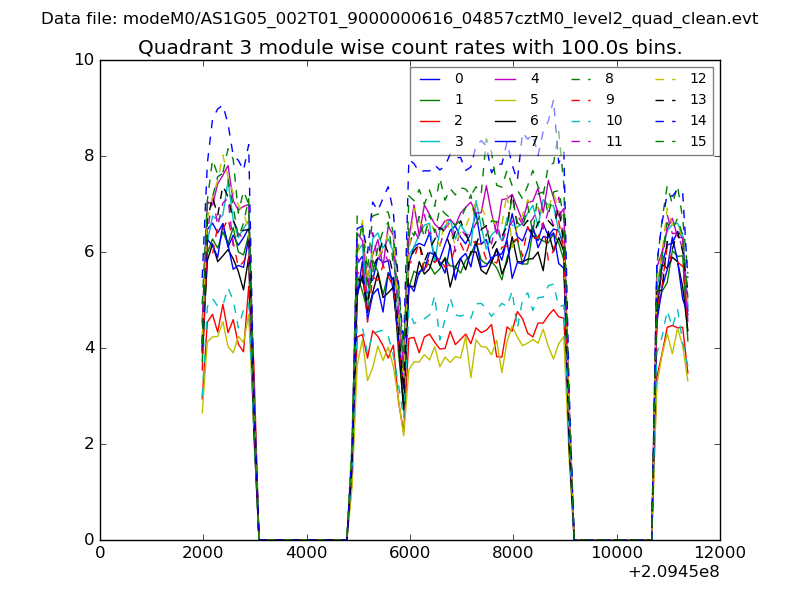
| Module-wise count rates for Quadrant C Data is divided into 100 sec bins |
 |
 |
| Module-wise count rates for Quadrant D Data is divided into 100 sec bins |
 |
 |
| Parameter | Plot |
|---|---|
| CZT HV Monitor | 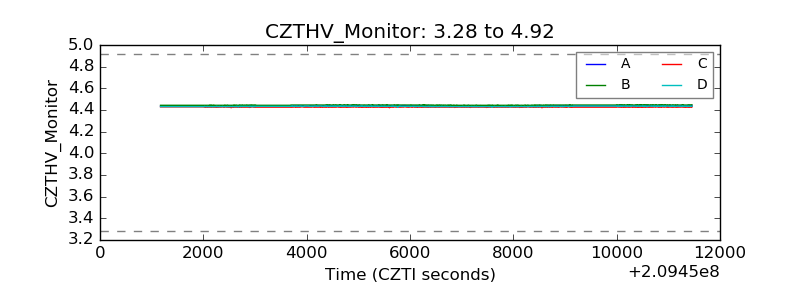 |
| D_VDD | 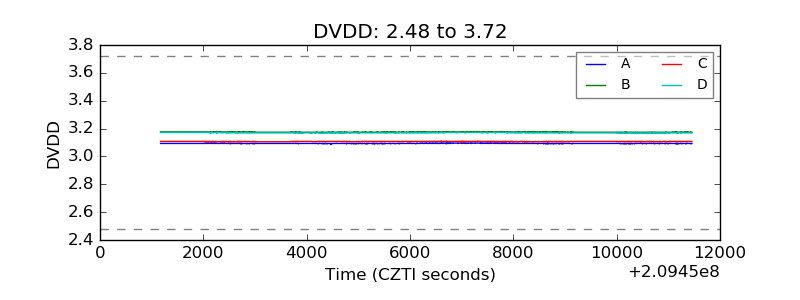 |
| Temperature 1 | 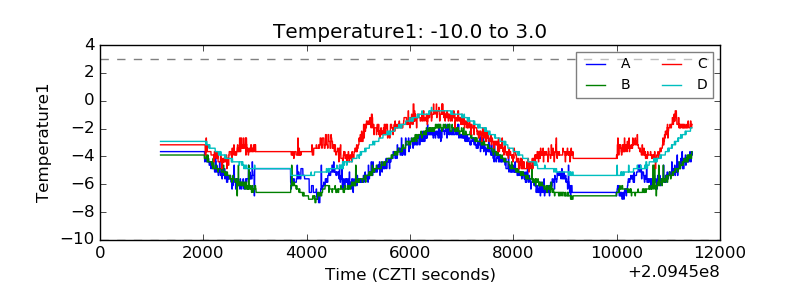 |
| Veto HV Monitor | 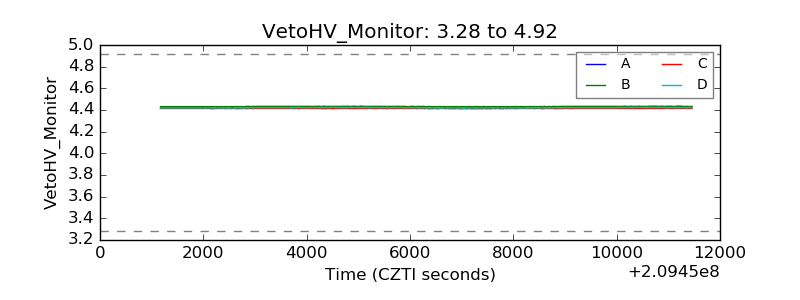 |
| Veto LLD | 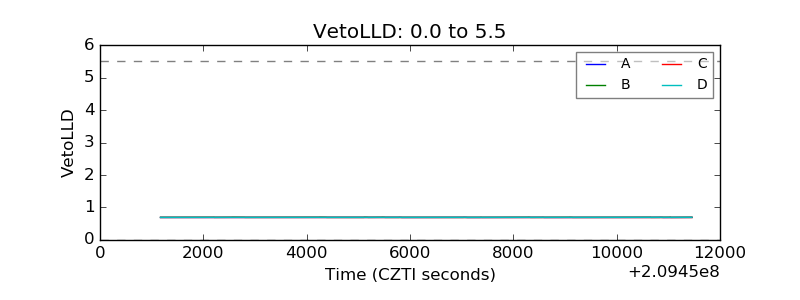 |
| Alpha Counter | 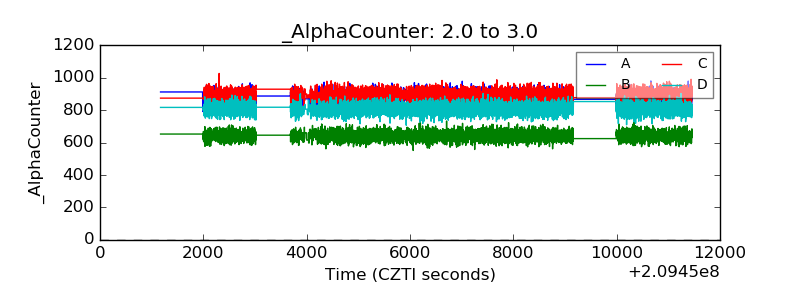 |
| _CPM_Rate | 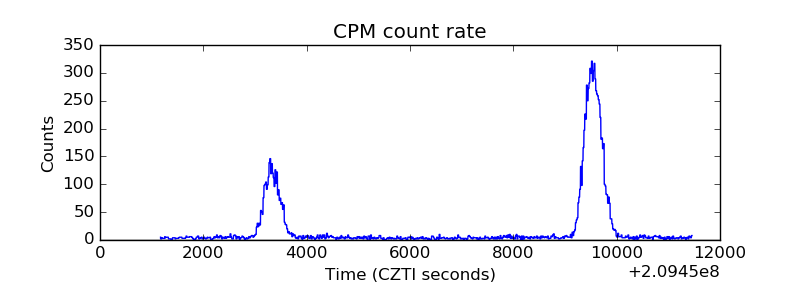 |
| CZT Counter | 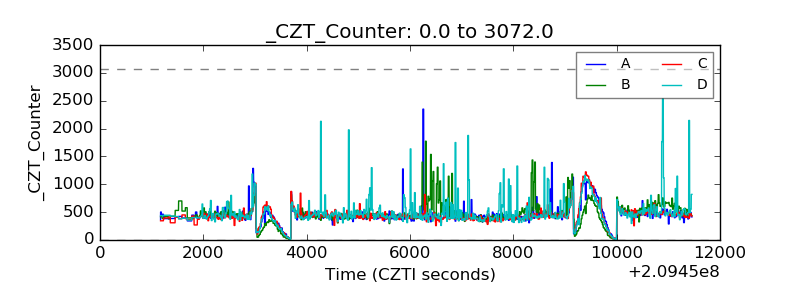 |
| +2.5 Volts monitor |  |
| +5 Volts monitor |  |
| _ROLL_ROT | 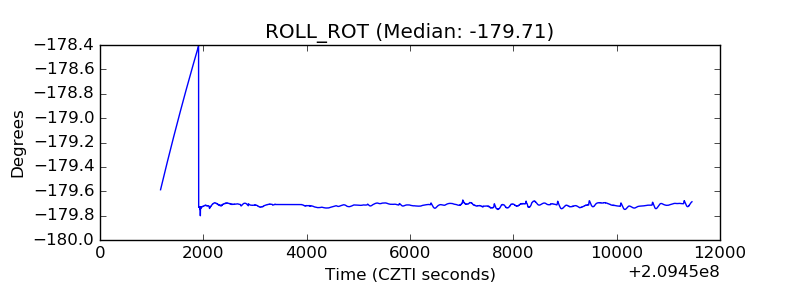 |
| _Roll_DEC | 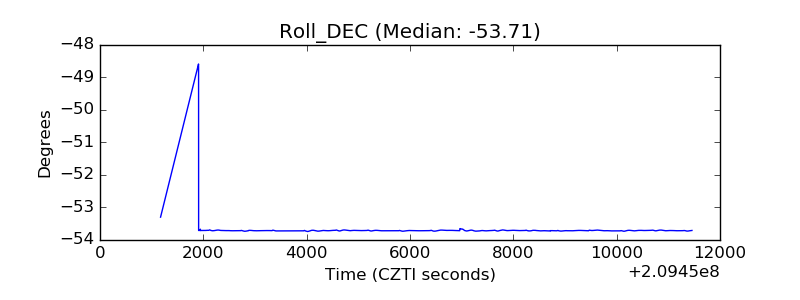 |
| _Roll_RA | 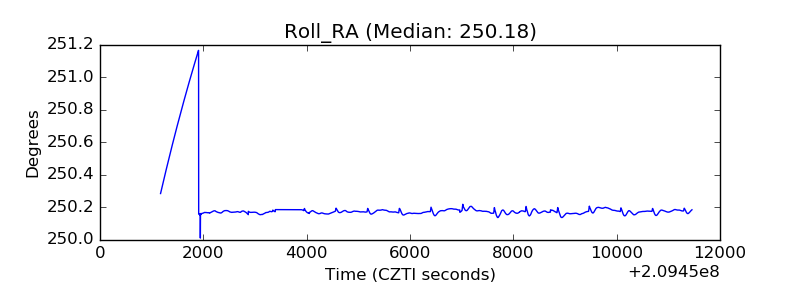 |
| Veto Counter | 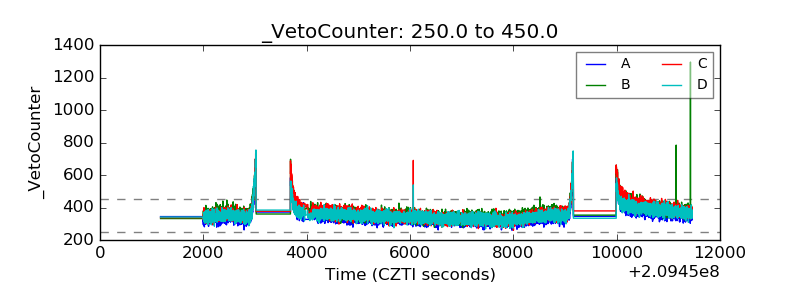 |