| Param | Original file | Final file |
|---|---|---|
| Filename | modeM0/AS1G05_002T01_9000000616_04861cztM0_level2.evt | modeM0/AS1G05_002T01_9000000616_04861cztM0_level2_quad_clean.evt |
| Size (bytes) | 206,182,080 | 32,880,960 |
| Size | 196.6 MB | 31.4 MB |
| Events in quadrant A | 1,356,448 | 198,927 |
| Events in quadrant B | 1,422,088 | 200,215 |
| Events in quadrant C | 1,345,130 | 200,627 |
| Events in quadrant D | 1,922,701 | 189,663 |
| Mode SS | |||
|---|---|---|---|
| Quadrant | BADHDUFLAG | Total packets | Discarded packets |
| A | 0 | 60 | 0 |
| B | 0 | 61 | 1 |
| C | 0 | 61 | 1 |
| D | 0 | 61 | 1 |
| Mode M0 | |||
|---|---|---|---|
| Quadrant | BADHDUFLAG | Total packets | Discarded packets |
| A | 0 | 6156 | 229 |
| B | 0 | 6323 | 239 |
| C | 0 | 6134 | 218 |
| D | 0 | 7873 | 218 |
| Mode M9 | |||
|---|---|---|---|
| Quadrant | BADHDUFLAG | Total packets | Discarded packets |
| A | 0 | 17 | 2 |
| B | 0 | 16 | 1 |
| C | 0 | 15 | 0 |
| D | 0 | 16 | 0 |
| Quadrant | Total seconds | Saturated seconds | Saturation percentage |
|---|---|---|---|
| A | 2877 | 64 | 2.224539% |
| B | 2878 | 53 | 1.841557% |
| C | 2877 | 52 | 1.807438% |
| D | 2883 | 149 | 5.168228% |
Noise dominated data is calculated using 1-second bins in cleaned event files. If a bin has >2000 counts, and if more than 50% of those come from <1% of pixels, then it is considered to be noise-dominated and hence unusable.
| Quadrant | # 1 sec bins | Bins with >0 counts | Bins with >2000 counts | High rate bins dominated by noise | Noise dominated (total time) | Noise dominated (detector-on time) | Marked lightcurve |
|---|---|---|---|---|---|---|---|
| A | 6281 | 2899 | 1 | 1 | 0.02% | 0.03% | 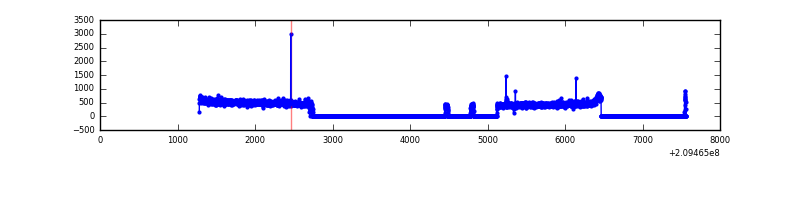 |
| B | 6284 | 2901 | 0 | 0 | 0.00% | 0.00% | 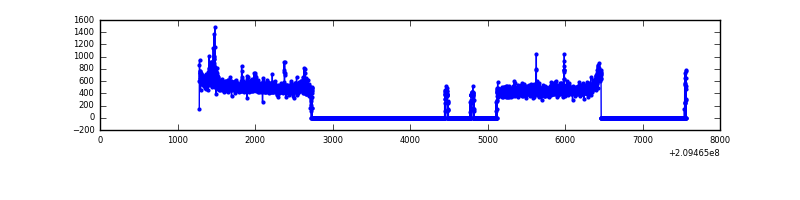 |
| C | 6284 | 2893 | 0 | 0 | 0.00% | 0.00% | 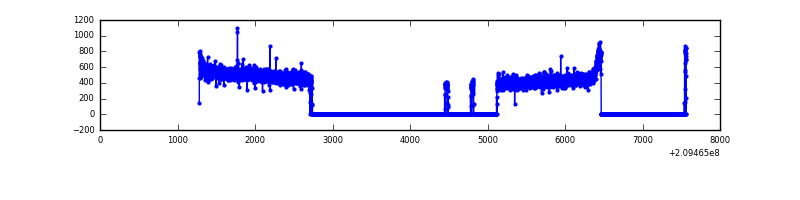 |
| D | 6285 | 2905 | 74 | 74 | 1.18% | 2.55% | 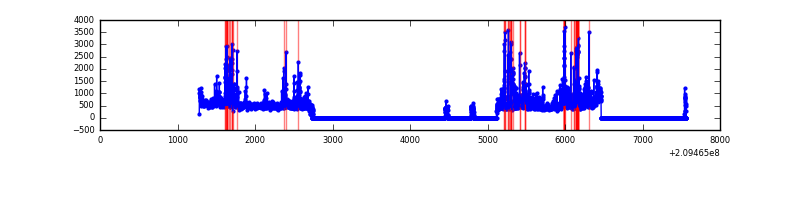 |
Top three noisy pixels from each quadrant. If the there are fewer than three noisy pixels in the level2.evt file, extra rows are filled as -1
| Pixel properties | Quadrant properties | ||||||
|---|---|---|---|---|---|---|---|
| Quadrant | DetID | PixID | Counts | Sigma | Mean | Median | Sigma |
| A | 0 | 50 | 8770 | 116.34 | 349 | 340 | 72.5 |
| A | 12 | 194 | 3457 | 43.02 | 349 | 340 | 72.5 |
| A | 0 | 226 | 3385 | 42.02 | 349 | 340 | 72.5 |
| B | 10 | 16 | 25227 | 362.54 | 351 | 342 | 68.6 |
| B | 4 | 80 | 18644 | 266.63 | 351 | 342 | 68.6 |
| B | 12 | 111 | 6122 | 84.21 | 351 | 342 | 68.6 |
| C | 12 | 4 | 3437 | 38.46 | 343 | 343 | 80.4 |
| C | 13 | 61 | 2821 | 30.8 | 343 | 343 | 80.4 |
| C | 8 | 222 | 1702 | 16.89 | 343 | 343 | 80.4 |
| D | 1 | 31 | 375393 | 4528.21 | 335 | 324 | 82.8 |
| D | 13 | 235 | 101102 | 1216.69 | 335 | 324 | 82.8 |
| D | 2 | 136 | 82922 | 997.21 | 335 | 324 | 82.8 |
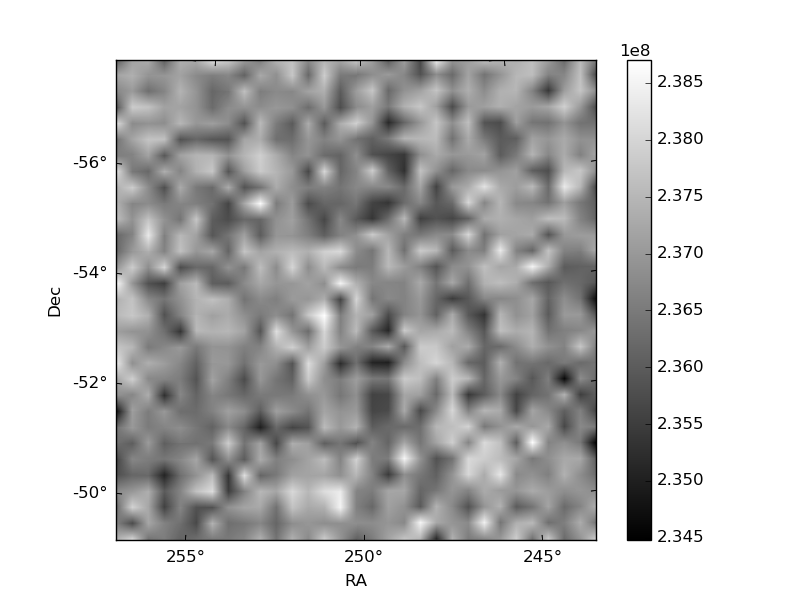
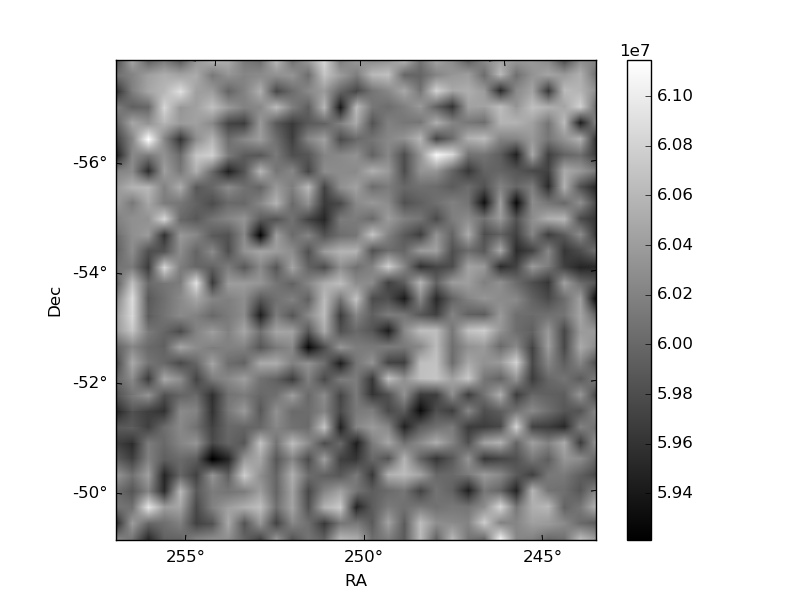
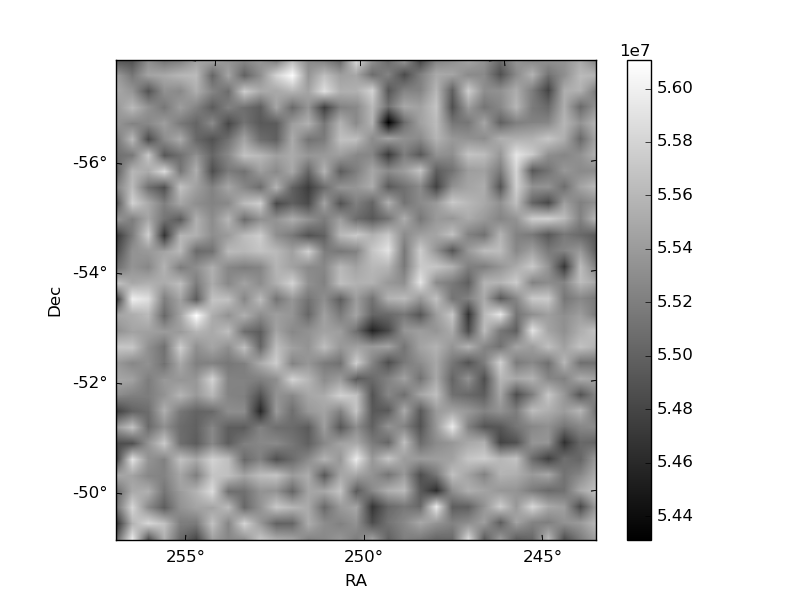
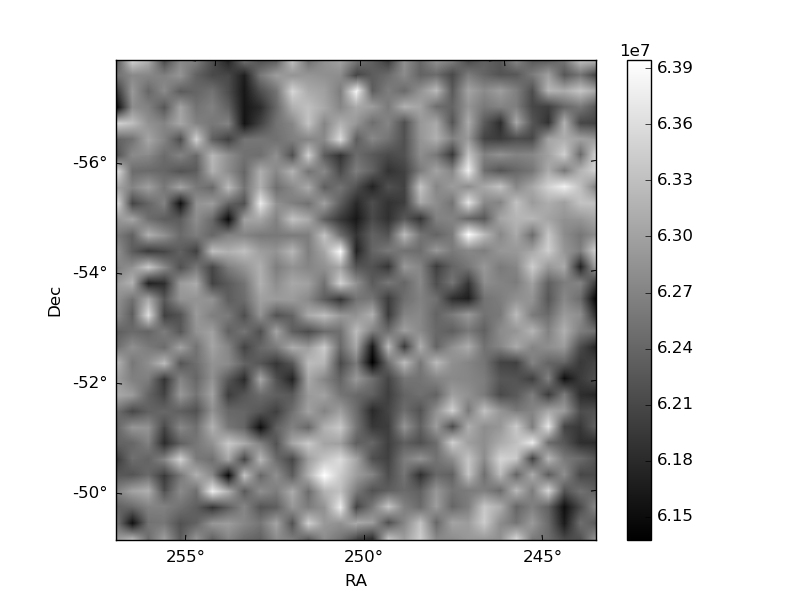
Histogram calculated using DETX and DETY for each event in the final _common_clean file
| Quadrant A | 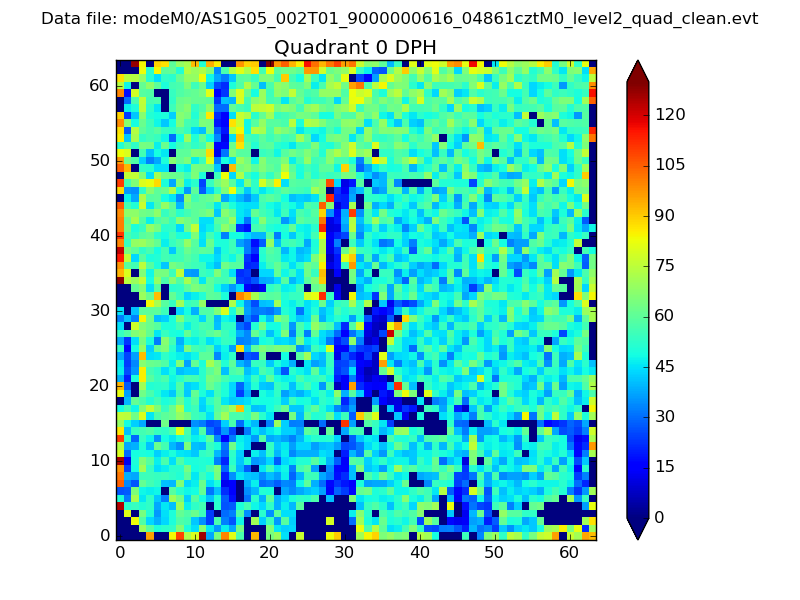 |
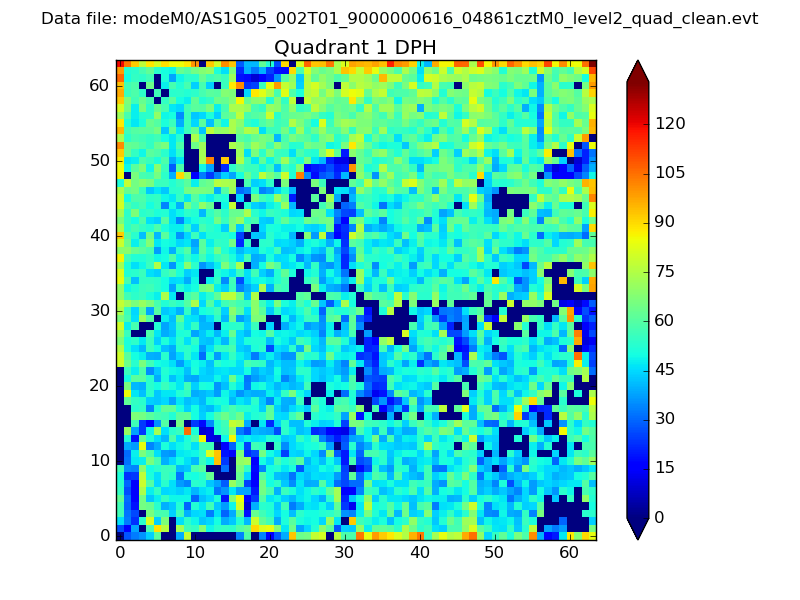 |
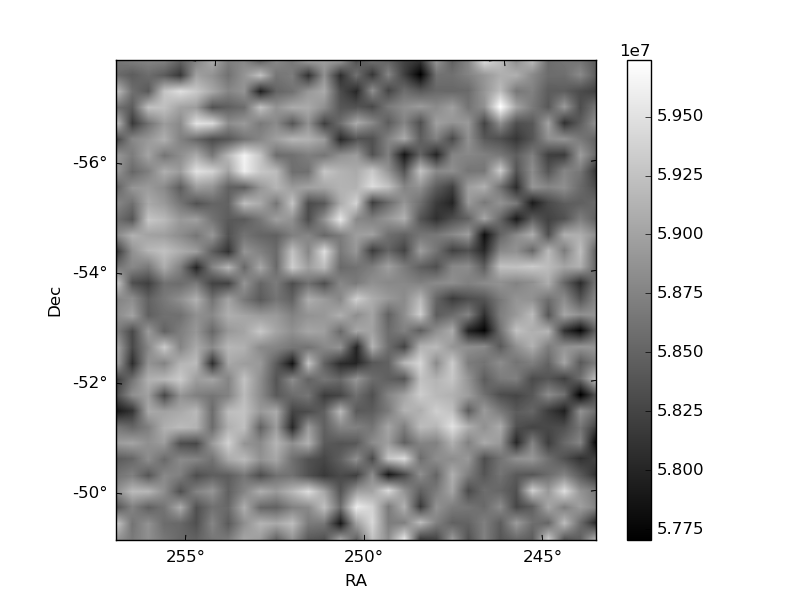
Quadrant B |
|---|---|---|---|
| Quadrant D | 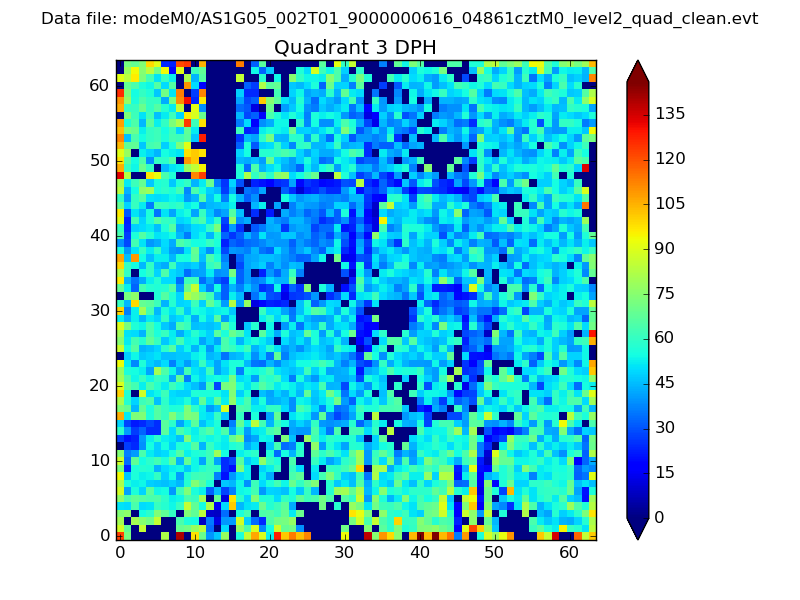 |
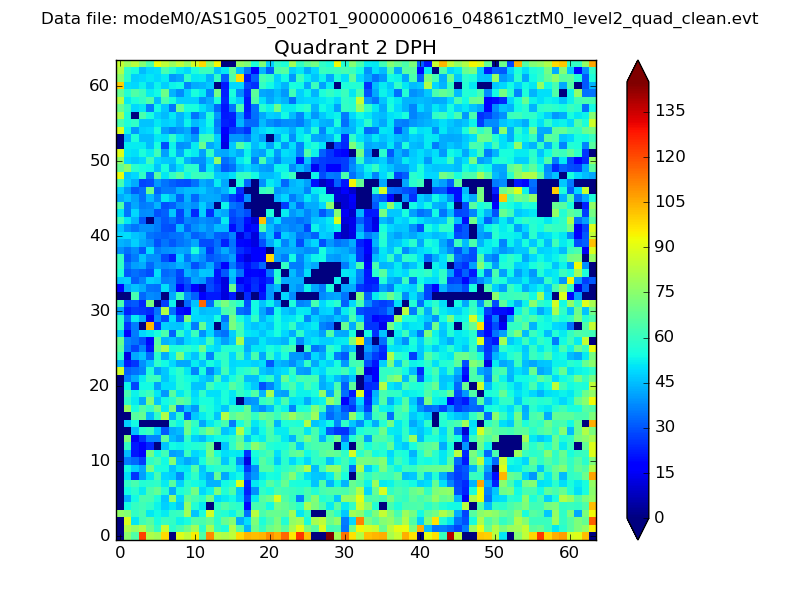 |
Quadrant C |
| Plot type | Count rate plots | Images |
|---|---|---|
| Comparison with Poisson distribution Blue bars denote a histogram of data divided into 1 sec bins. Red curve is a Poisson curve with rate = median count rate of data. |
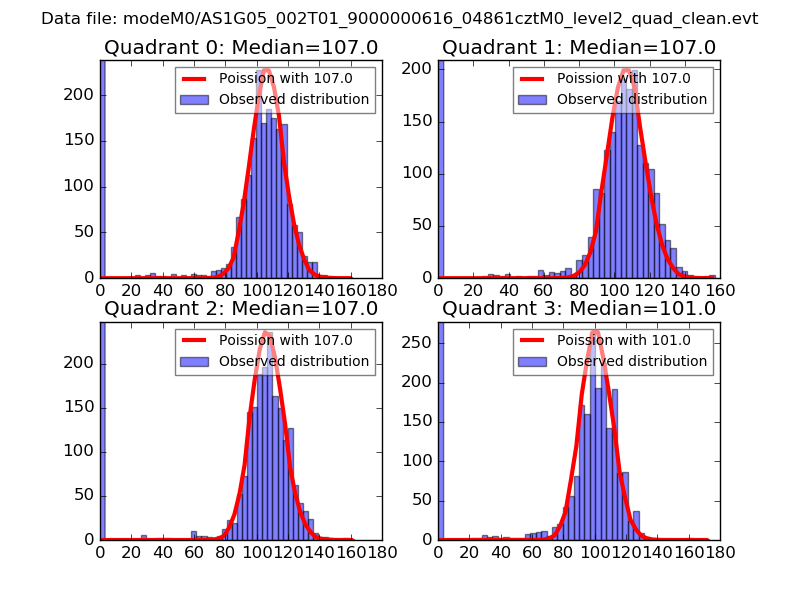 |
 |
| Quadrant-wise count rates Data is divided into 100 sec bins |
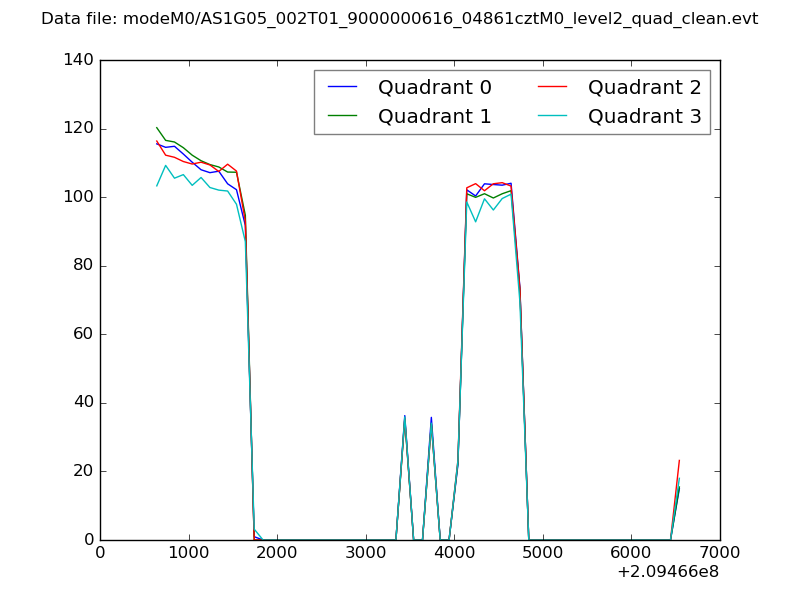 |
|
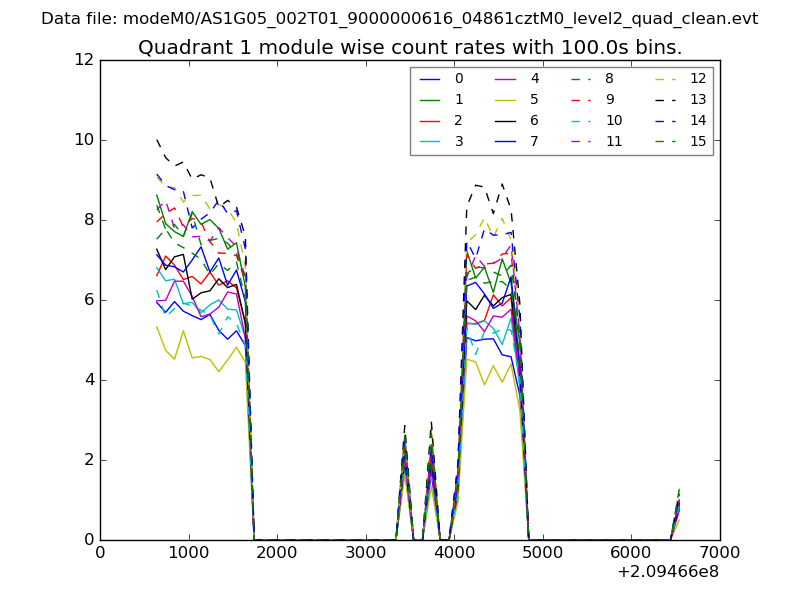
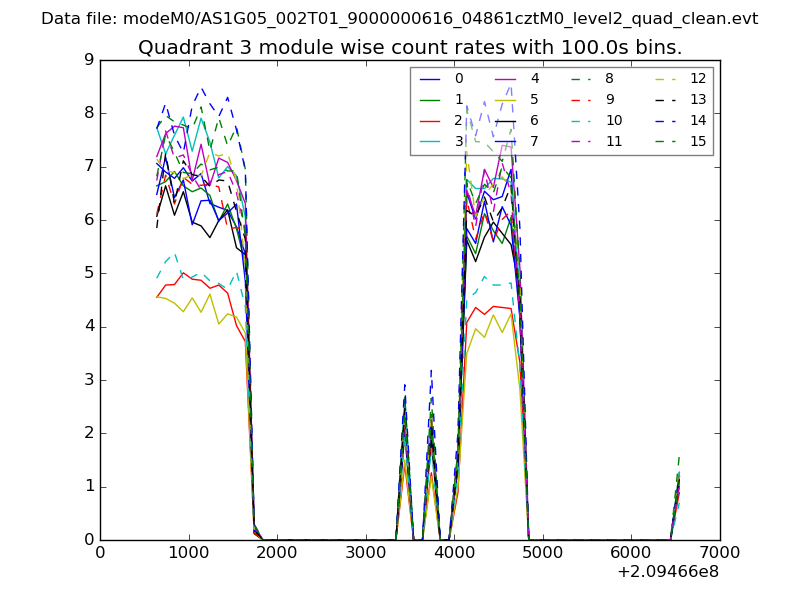
| Module-wise count rates for Quadrant A Data is divided into 100 sec bins |
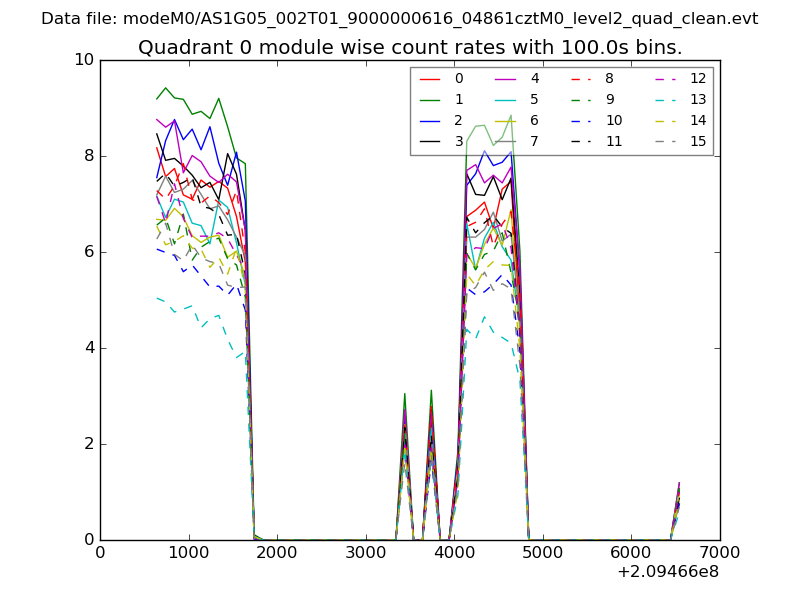 |
 |
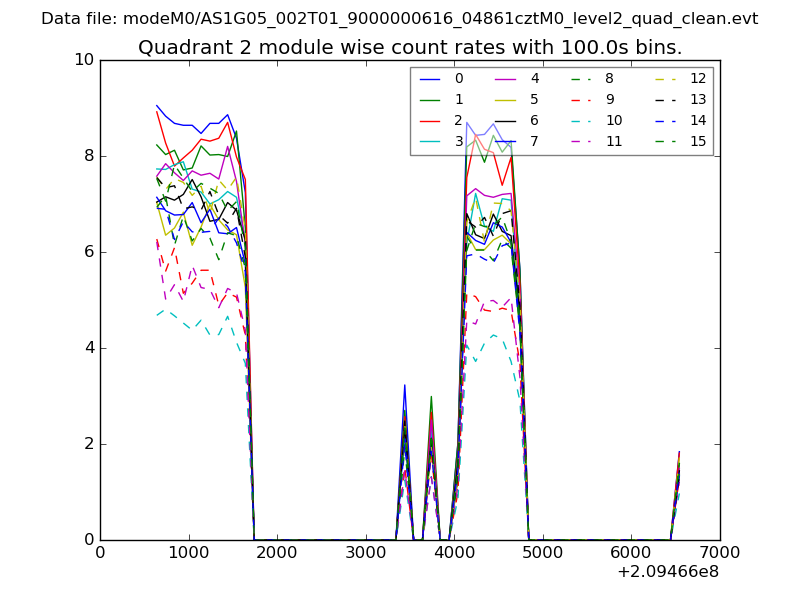
| Module-wise count rates for Quadrant B Data is divided into 100 sec bins |
 |
 |
| Module-wise count rates for Quadrant C Data is divided into 100 sec bins |
 |
 |
| Module-wise count rates for Quadrant D Data is divided into 100 sec bins |
 |
 |
| Parameter | Plot |
|---|---|
| CZT HV Monitor |  |
| D_VDD | 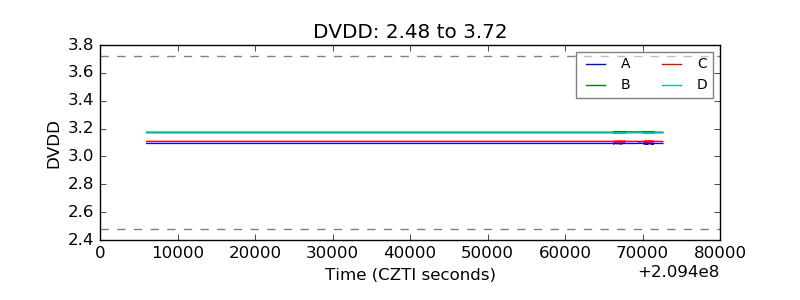 |
| Temperature 1 | 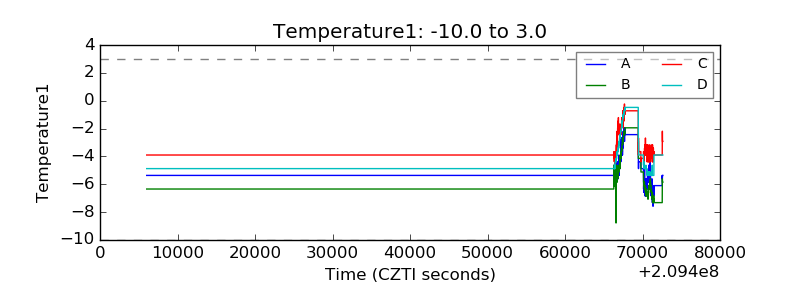 |
| Veto HV Monitor | 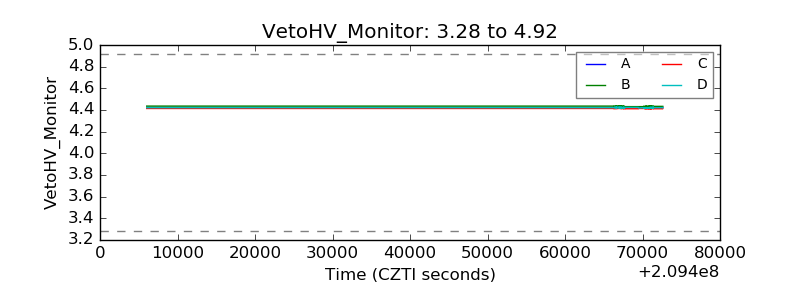 |
| Veto LLD | 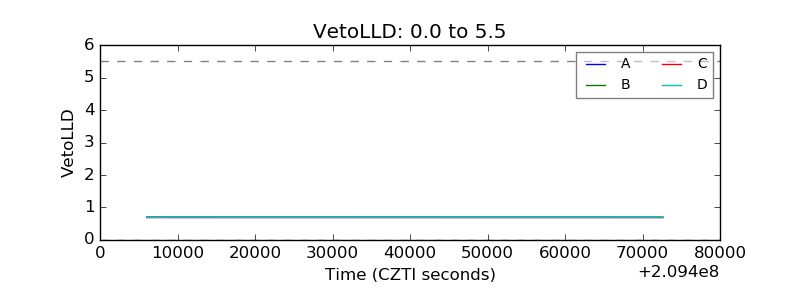 |
| Alpha Counter | 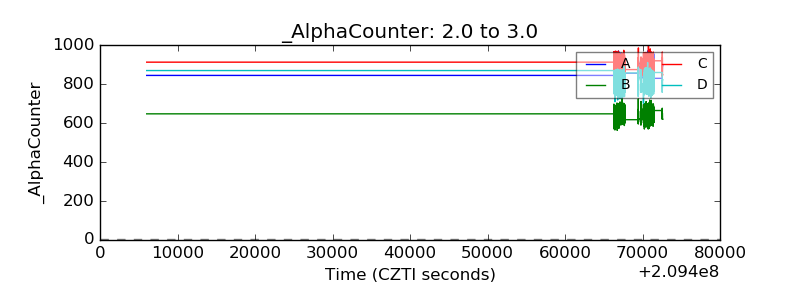 |
| _CPM_Rate | 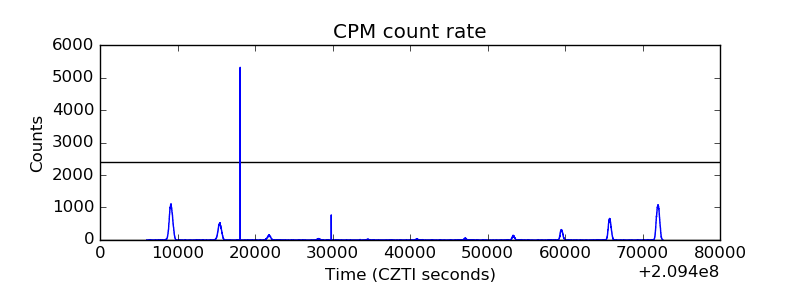 |
| CZT Counter | 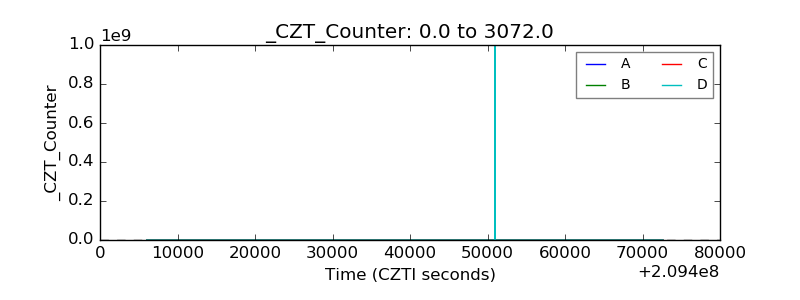 |
| +2.5 Volts monitor |  |
| +5 Volts monitor | 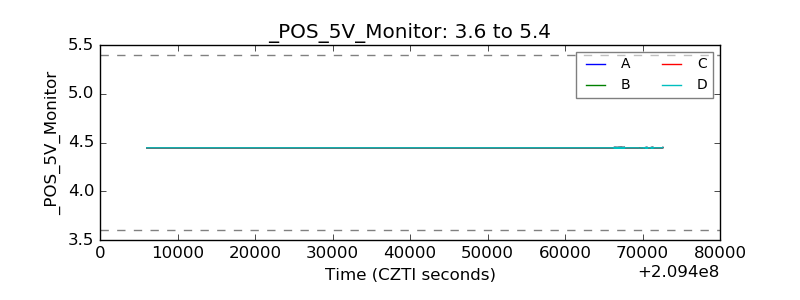 |
| _ROLL_ROT | 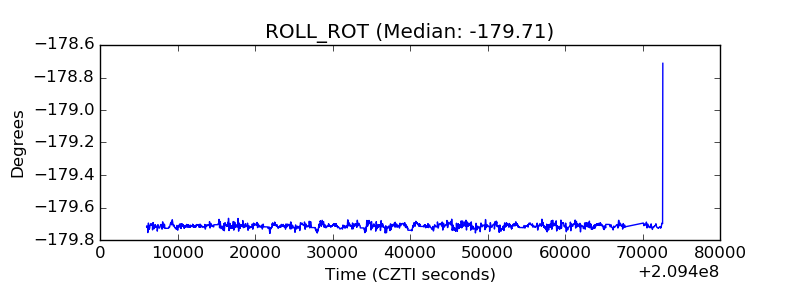 |
| _Roll_DEC | 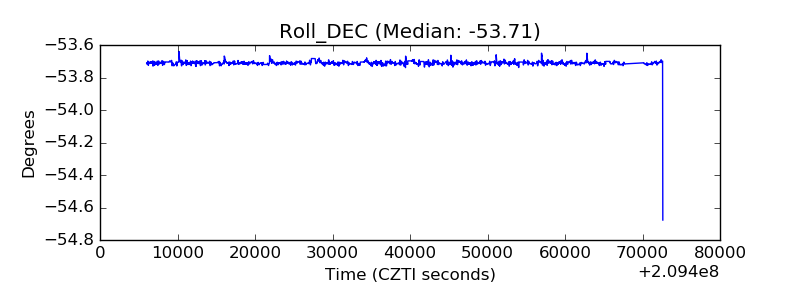 |
| _Roll_RA | 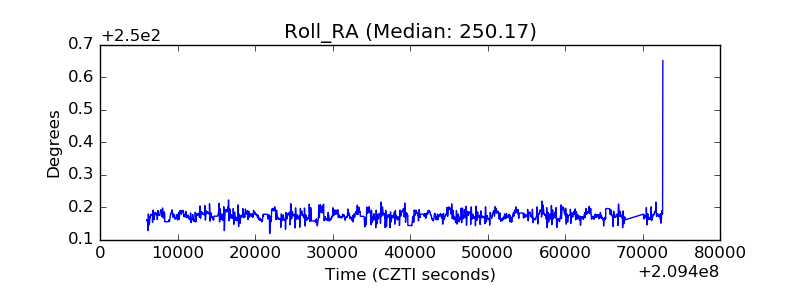 |
| Veto Counter | 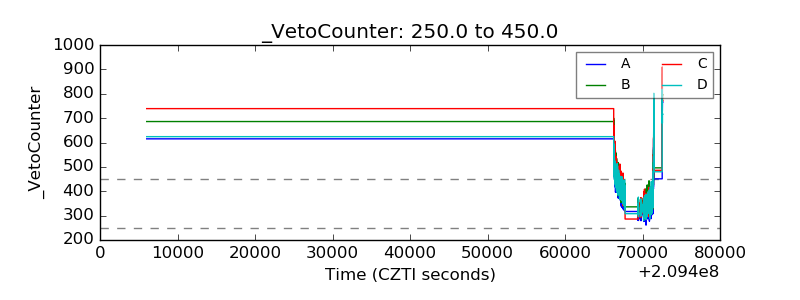 |