| Param | Original file | Final file |
|---|---|---|
| Filename | modeM0/AS1G05_002T01_9000000616_04863cztM0_level2.evt | modeM0/AS1G05_002T01_9000000616_04863cztM0_level2_quad_clean.evt |
| Size (bytes) | 364,095,360 | 77,984,640 |
| Size | 347.2 MB | 74.4 MB |
| Events in quadrant A | 2,402,059 | 501,486 |
| Events in quadrant B | 2,515,239 | 500,613 |
| Events in quadrant C | 2,336,085 | 506,192 |
| Events in quadrant D | 3,409,858 | 479,648 |
| Mode SS | |||
|---|---|---|---|
| Quadrant | BADHDUFLAG | Total packets | Discarded packets |
| A | 0 | 108 | 0 |
| B | 0 | 108 | 0 |
| C | 0 | 108 | 0 |
| D | 0 | 108 | 0 |
| Mode M0 | |||
|---|---|---|---|
| Quadrant | BADHDUFLAG | Total packets | Discarded packets |
| A | 0 | 10974 | 1 |
| B | 0 | 11133 | 1 |
| C | 0 | 10938 | 1 |
| D | 0 | 14002 | 1 |
| Mode M9 | |||
|---|---|---|---|
| Quadrant | BADHDUFLAG | Total packets | Discarded packets |
| A | 0 | 11 | 0 |
| B | 0 | 11 | 0 |
| C | 0 | 11 | 0 |
| D | 0 | 11 | 0 |
| Quadrant | Total seconds | Saturated seconds | Saturation percentage |
|---|---|---|---|
| A | 5337 | 65 | 1.217913% |
| B | 5337 | 56 | 1.049279% |
| C | 5337 | 49 | 0.918119% |
| D | 5337 | 214 | 4.009743% |
Noise dominated data is calculated using 1-second bins in cleaned event files. If a bin has >2000 counts, and if more than 50% of those come from <1% of pixels, then it is considered to be noise-dominated and hence unusable.
| Quadrant | # 1 sec bins | Bins with >0 counts | Bins with >2000 counts | High rate bins dominated by noise | Noise dominated (total time) | Noise dominated (detector-on time) | Marked lightcurve |
|---|---|---|---|---|---|---|---|
| A | 6412 | 5337 | 1 | 1 | 0.02% | 0.02% | 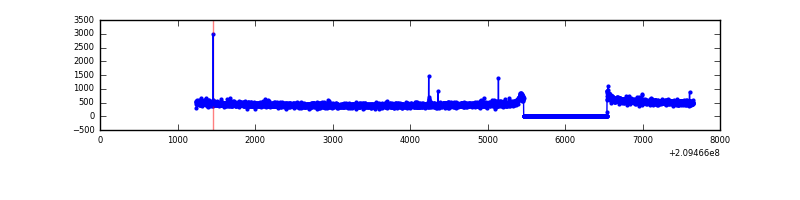 |
| B | 6412 | 5337 | 0 | 0 | 0.00% | 0.00% | 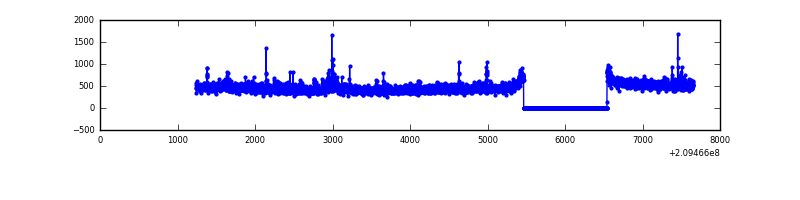 |
| C | 6412 | 5337 | 0 | 0 | 0.00% | 0.00% | 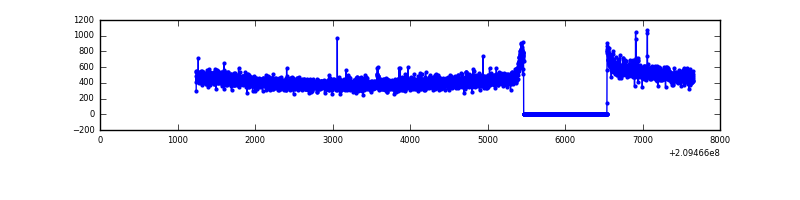 |
| D | 6412 | 5337 | 138 | 138 | 2.15% | 2.59% | 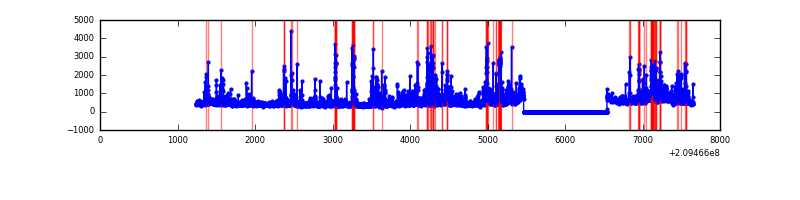 |
Top three noisy pixels from each quadrant. If the there are fewer than three noisy pixels in the level2.evt file, extra rows are filled as -1
| Pixel properties | Quadrant properties | ||||||
|---|---|---|---|---|---|---|---|
| Quadrant | DetID | PixID | Counts | Sigma | Mean | Median | Sigma |
| A | 0 | 50 | 10921 | 81.87 | 618 | 605 | 126.0 |
| A | 12 | 194 | 6173 | 44.19 | 618 | 605 | 126.0 |
| A | 0 | 226 | 6086 | 43.5 | 618 | 605 | 126.0 |
| B | 4 | 80 | 36220 | 298.97 | 618 | 602 | 119.1 |
| B | 7 | 252 | 25235 | 206.76 | 618 | 602 | 119.1 |
| B | 15 | 54 | 21223 | 173.09 | 618 | 602 | 119.1 |
| C | 12 | 4 | 10123 | 69.21 | 595 | 597 | 137.6 |
| C | 13 | 61 | 4931 | 31.49 | 595 | 597 | 137.6 |
| C | 8 | 222 | 2836 | 16.27 | 595 | 597 | 137.6 |
| D | 1 | 31 | 529300 | 3649.67 | 590 | 573 | 144.9 |
| D | 2 | 136 | 240071 | 1653.19 | 590 | 573 | 144.9 |
| D | 2 | 234 | 149595 | 1028.66 | 590 | 573 | 144.9 |
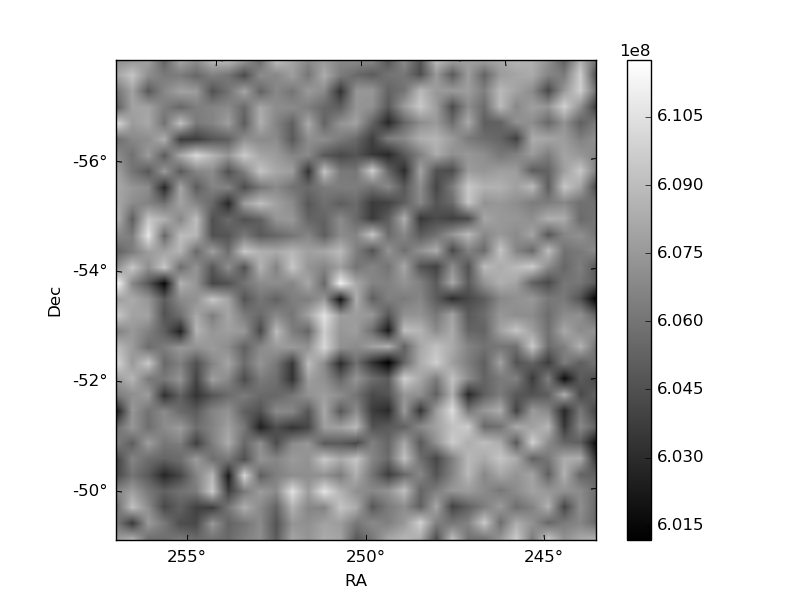
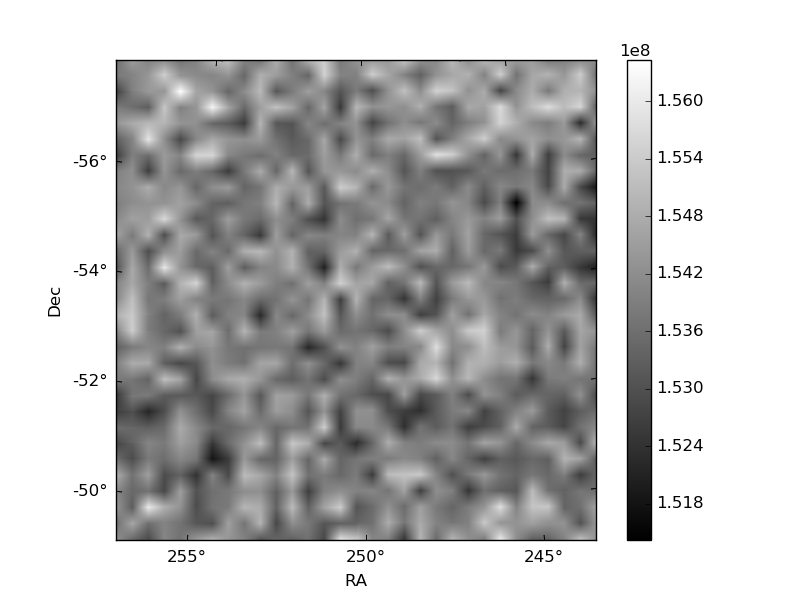
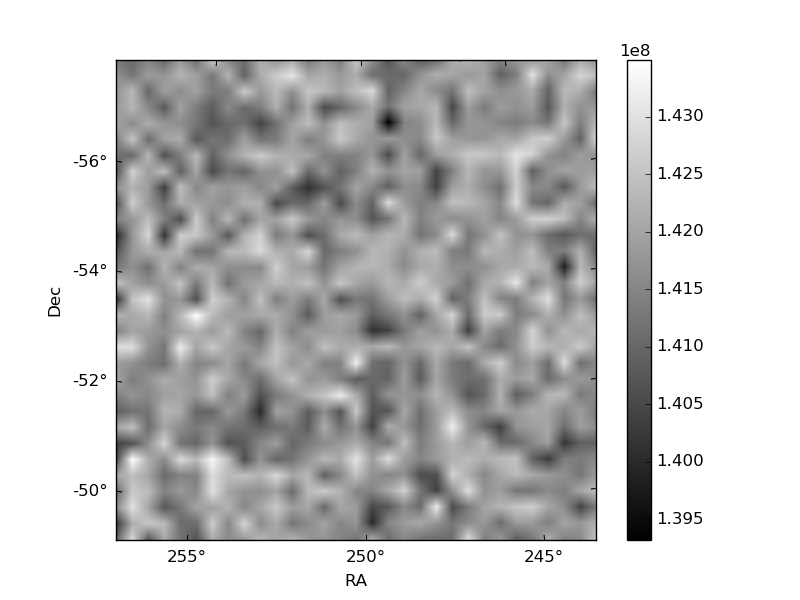
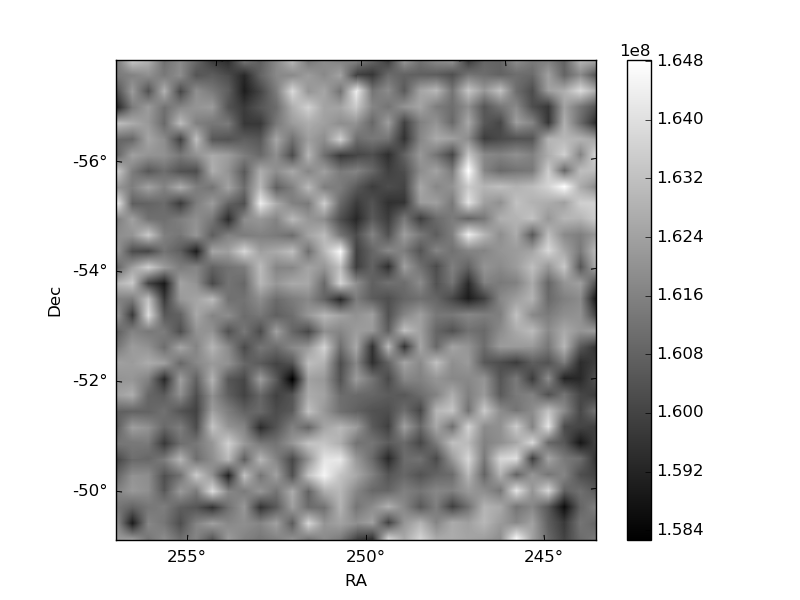
Histogram calculated using DETX and DETY for each event in the final _common_clean file
| Quadrant A | 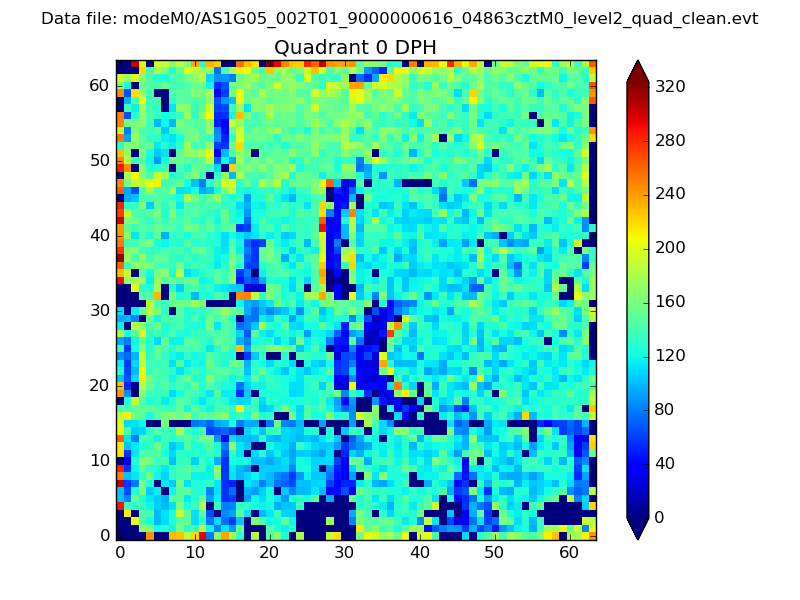 |
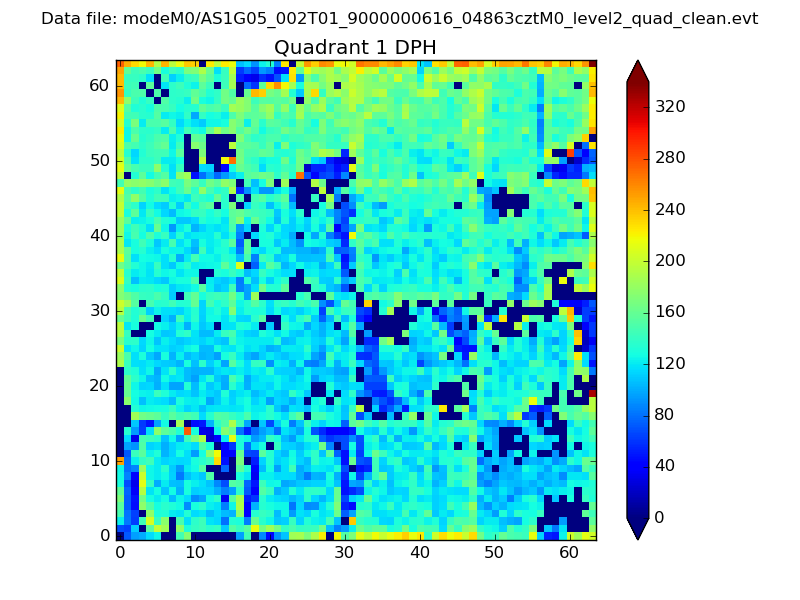 |
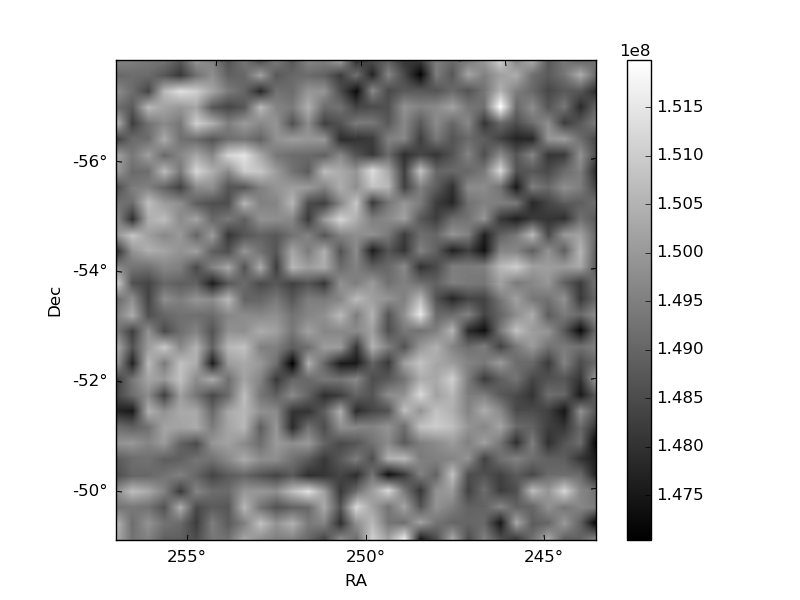
Quadrant B |
|---|---|---|---|
| Quadrant D | 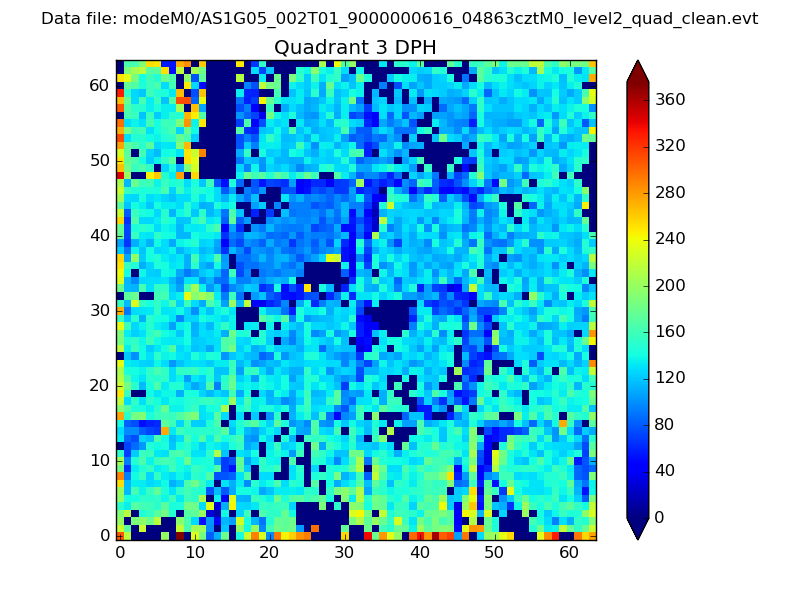 |
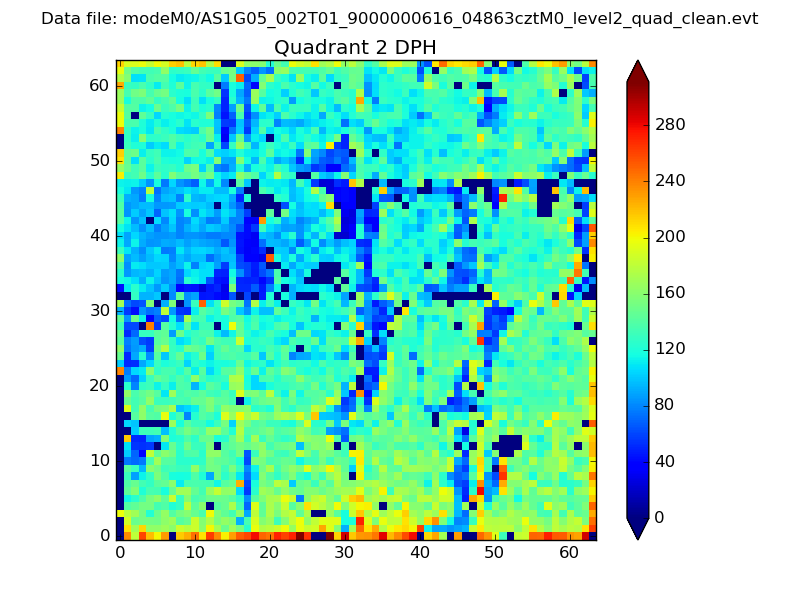 |
Quadrant C |
| Plot type | Count rate plots | Images |
|---|---|---|
| Comparison with Poisson distribution Blue bars denote a histogram of data divided into 1 sec bins. Red curve is a Poisson curve with rate = median count rate of data. |
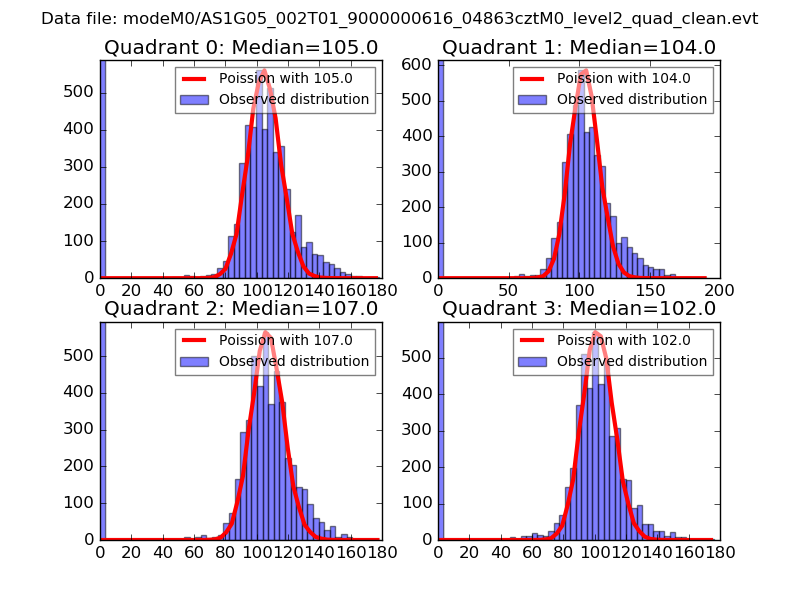 |
 |
| Quadrant-wise count rates Data is divided into 100 sec bins |
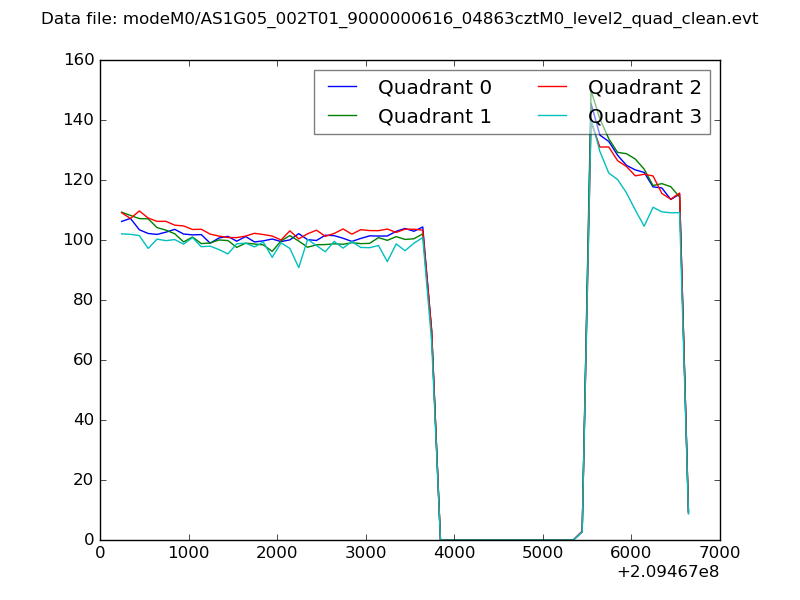 |
|
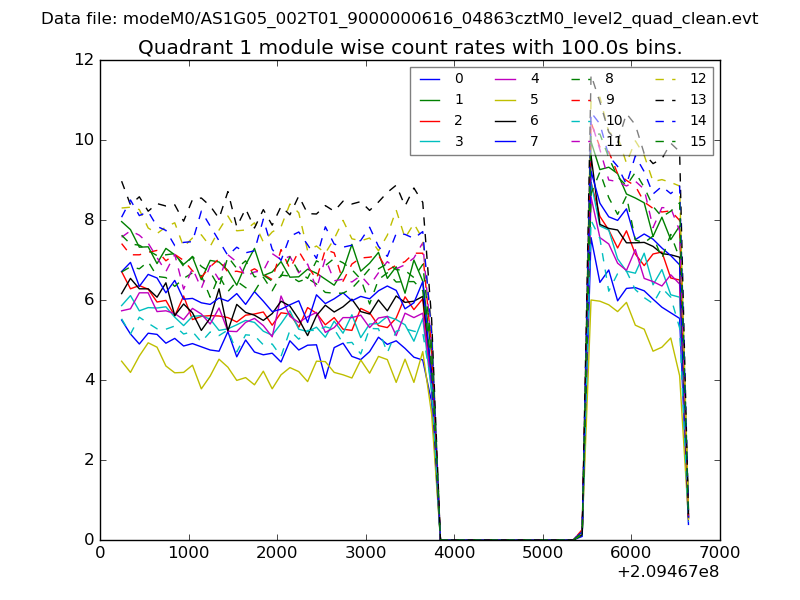
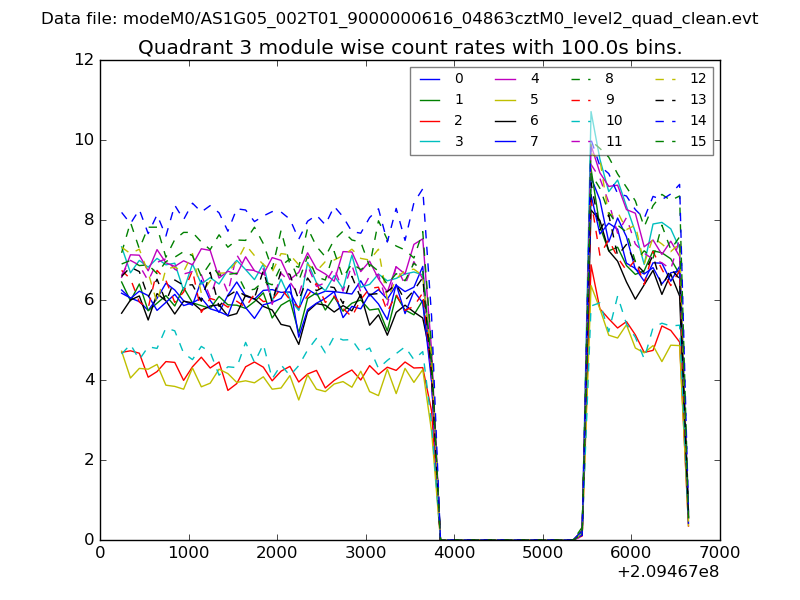
| Module-wise count rates for Quadrant A Data is divided into 100 sec bins |
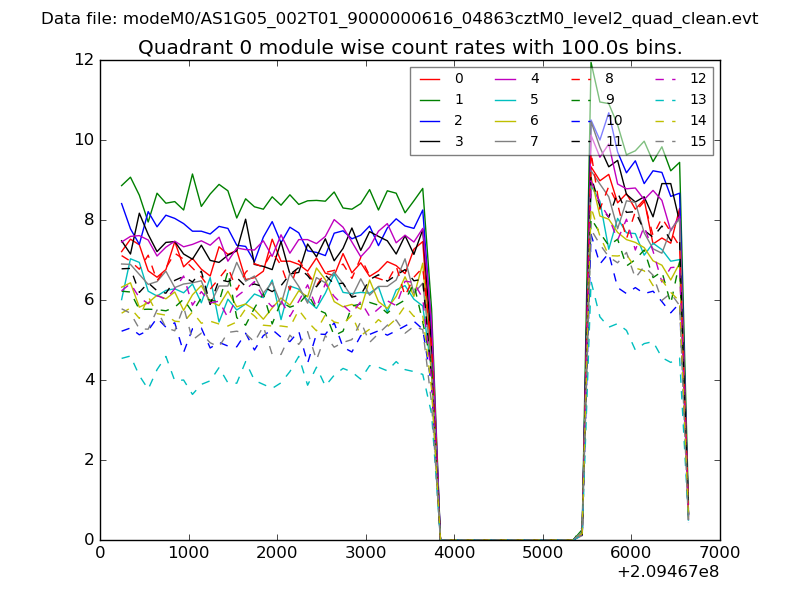 |
 |
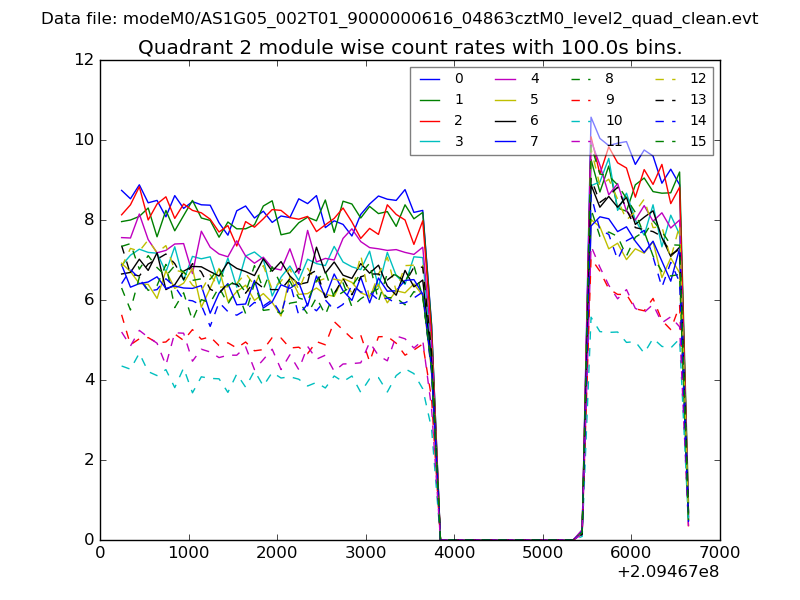
| Module-wise count rates for Quadrant B Data is divided into 100 sec bins |
 |
 |
| Module-wise count rates for Quadrant C Data is divided into 100 sec bins |
 |
 |
| Module-wise count rates for Quadrant D Data is divided into 100 sec bins |
 |
 |
| Parameter | Plot |
|---|---|
| CZT HV Monitor | 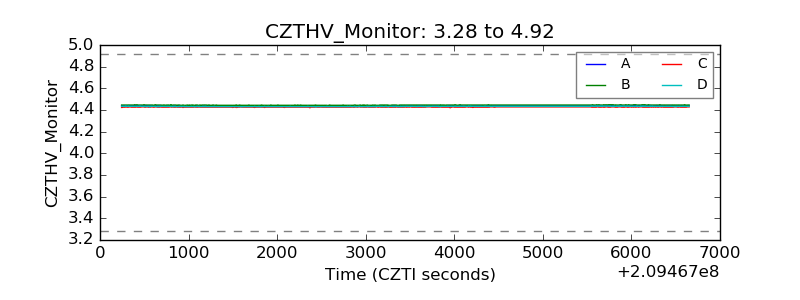 |
| D_VDD | 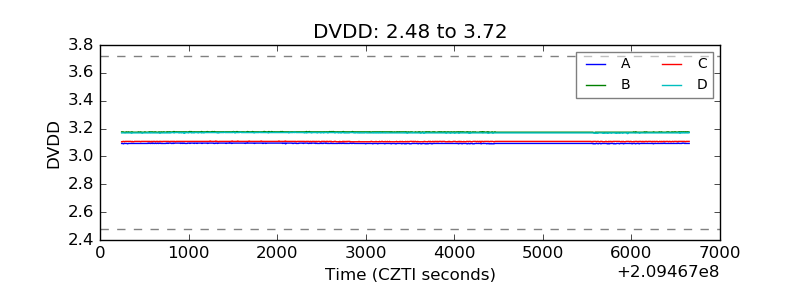 |
| Temperature 1 | 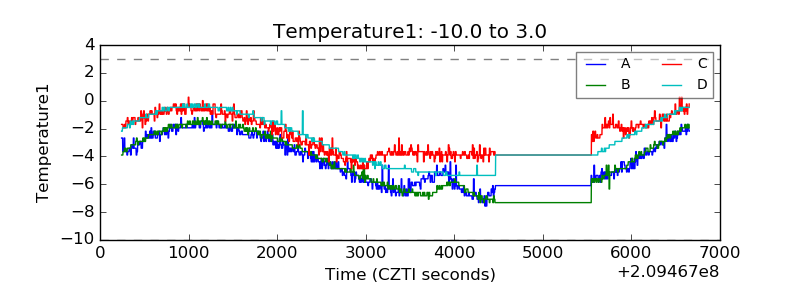 |
| Veto HV Monitor | 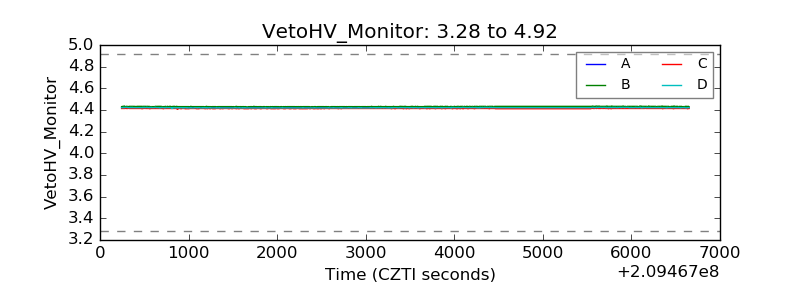 |
| Veto LLD | 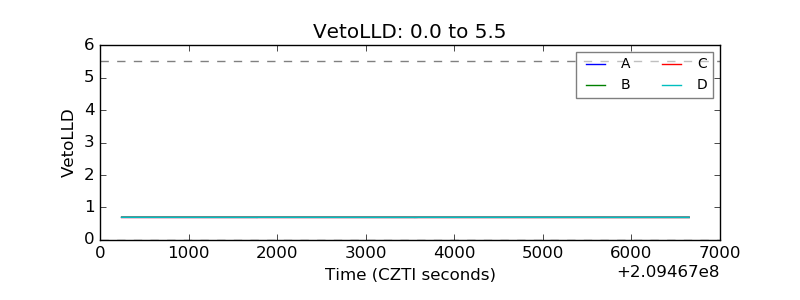 |
| Alpha Counter | 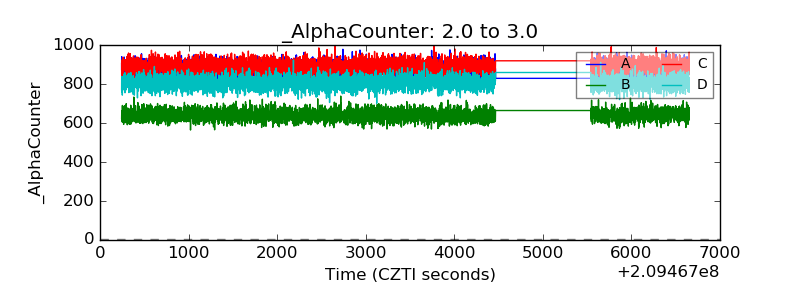 |
| _CPM_Rate | 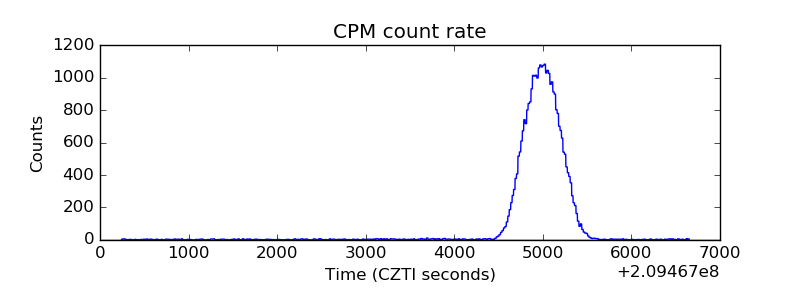 |
| CZT Counter | 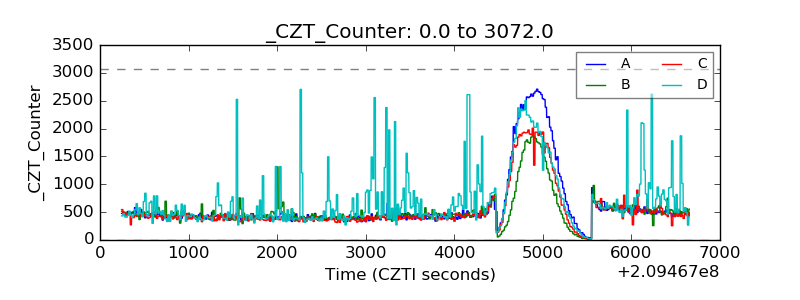 |
| +2.5 Volts monitor |  |
| +5 Volts monitor | 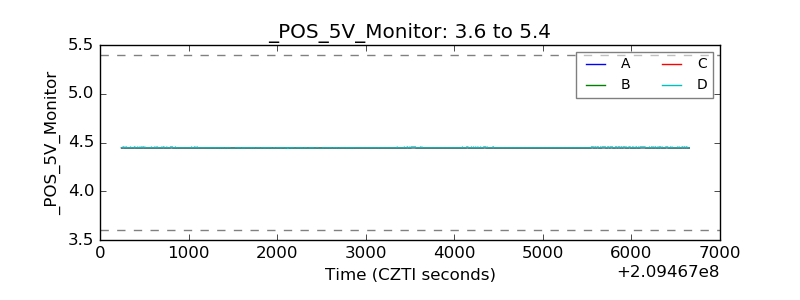 |
| _ROLL_ROT | 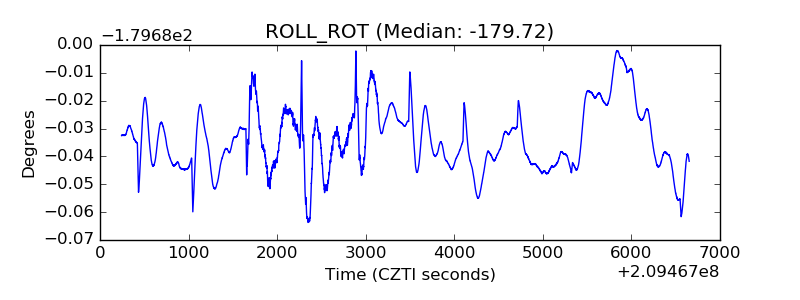 |
| _Roll_DEC | 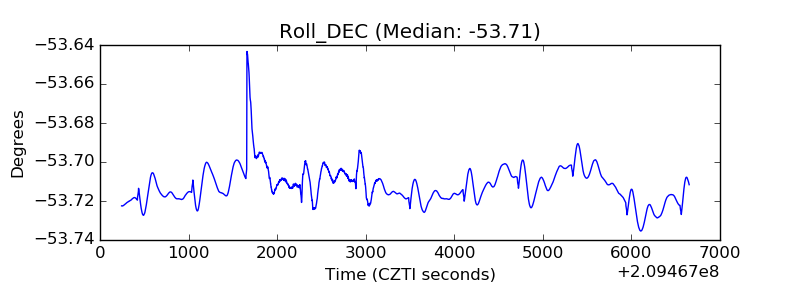 |
| _Roll_RA | 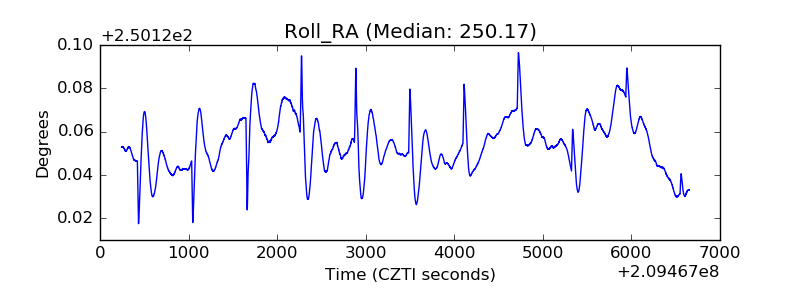 |
| Veto Counter | 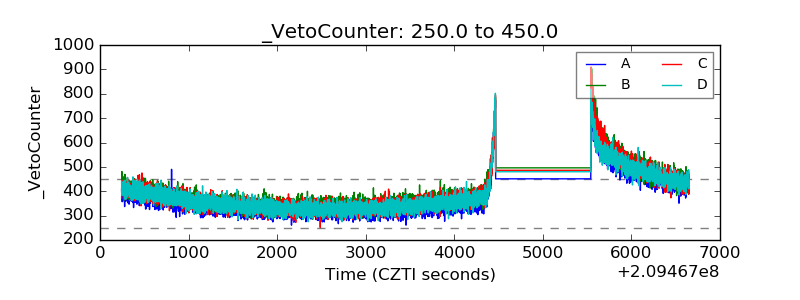 |